Public Health Impacts of Projected 2050 Ozone Concentrations in Mecklenburg County, NC
|
|
|
- Warren Bridges
- 5 years ago
- Views:
Transcription

1 Public Health Impacts of Projected 2050 Ozone Concentrations in Mecklenburg County, NC Presented by: Steven Lippmann 1,2 Co-authors: Karin Yeatts 1, Adel Hanna 3, Lauren Thie 4, and Anna Waller 2 1 Department of Epidemiology, University of North Carolina, Chapel Hill, NC 2 Carolina Center for Health Informatics, Department of Emergency Medicine, University of North Carolina, Chapel Hill, NC 3 Institute for the Environment, University of North Carolina, Chapel Hill, NC 4 Division of Public Health, Department of Health and Human Services, State of North Carolina 1
2 Outline Primer on ozone Walk through the health impact formula Describe our data inputs and results 2

 Ozone (O 3 )")
3 Ozone Creation Volatile Organic Compounds (VOCs) Nitrogen Oxides (NOx) Ozone (O 3 ) Emissions 3


4 Ozone Reduction Volatile Organic Compounds (VOCs) Emissions Nitrogen Oxides (NOx) Ozone (O 3 ) 4
 Emissions Nitrogen Oxides (NOx) Ozone (O")
5 Ozone Reduction Volatile Organic Compounds (VOCs) Emissions Nitrogen Oxides (NOx) Ozone (O 3 ) 5
6 Your Best Guess? How will ozone concentrations change in Mecklenburg County NC from today to 2050? -20% -10% No Change +10% +20% 6
7 Project Overview Combine data on: Emergency department visits (current) Concentration-response associations from the epidemiological literature Ozone levels (current and projected) Population (current and projected) to estimate the future burden of emergency department visits in Mecklenburg County, NC in PLEASE NOTE: These are preliminary results and should not be distributed or cited. 7
8 Health Impact Formula Change in health outcome B Concentration-response functions from epidemiological literature A Baseline incidence e.g. Asthma ED visits from C Change in ozone concentrations D Population at risk 8


9 A Health Data NC DETECT State-wide surveillance data Primary data elements used: ICD-9-CM diagnosis codes (up to 11) Age / sex Patient county of residence Visit date/time Obtained via a data use agreement with state DPH data owners 9 hospitals within Mecklenburg County 9
10 A Asthma ED Visit Incidence Rates Age Group Gender Asthma ED Visit Count (April- October, *) Population (%) (Mean, ) Incidence Rate (per person-day*) Average Count per Day 0-19 Female (13.8) 1.51E Male (14.3) 2.51E Female (20.4) 1.43E Male (19.6) 1.00E Female (12.2) 1.22E Male (11.1) 0.82E Female (5.2) 0.89E Male (3.5) 0.54E Total E Data Source: NC DETECT, Apr-Oct *74 days were determined to have data quality problems and were dropped from both the numerator and denominator. 10
 per 25 ppb increment 2.")
11 B Concentration-Response Functions PRELIMINARY DATA- DO NOT DISTRIBUTE OR CITE Peel et al., 2005 Atlanta, GA Study Incidence Rate Ratio b (0.996, 1.049) per 25 ppb increment 2.2% increase in asthma ED visits per 25 ppb increase in ozone ( ) 11
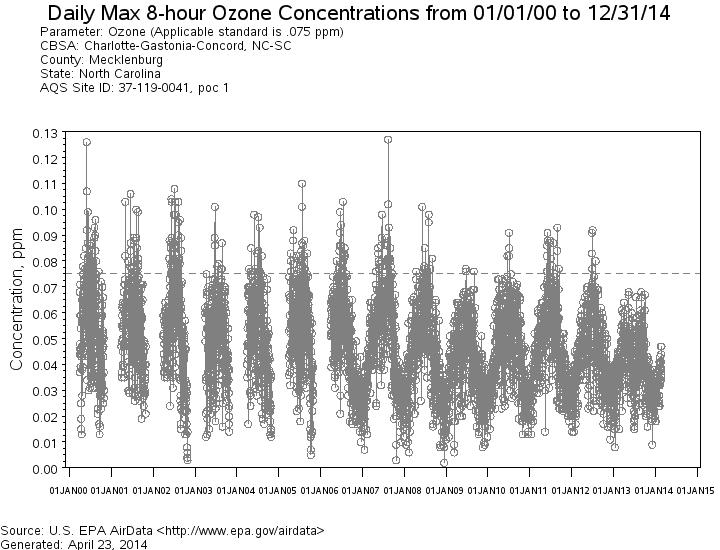
12 C Change in ozone Current Ozone Concentrations MONITOR DATA Mean Daily Maximum 8 Hour Average (ppb): Future Ozone Projections 2050 MODEL DATA Mean Daily Maximum 8 Hour Average (ppb): Data Source: U.S. EPA Air Quality System Mean of 3 monitors within county, April-October Data Source: GCM: NCAR, Resolution: 12km, IPCC Scenario A1B, with Projected Anthropogenic Emissions Inventory, May-August 12

13 C Current Ozone Source: Source: 13
14 C Ozone Concentrations Current Ozone Concentrations Mean Daily Maximum 8 Hour Average (ppb): 51 Data Source: U.S. EPA Air Quality System Mean of 3 monitors within county, April-October Future Ozone Projections 2050 Mean Daily Maximum 8 Hour Average (ppb): Data Source: GCM: NCAR, Resolution: 12km, IPCC Scenario A1B, with Projected Anthropogenic Emissions Inventory, May-August 14


15 C Air Quality Model Model years: IPCC A1B Scenario Projected anthropogenic emissions inventory GCM: NCAR Future climate meteorology: CCSM 2050 Downscaling: Analysis nudging technique 12km resolution For more technical information, contact Adel Hanna at the UNC Institute for the Environment. 15
 Set to baseline levels? X Set to projected future levels?")
16 C Future Air Quality Model Specifications PRELIMINARY DATA- DO NOT DISTRIBUTE OR CITE Meteorology/ Climate Biogenic Emissions Anthropogenic Emissions Greenhouse Gas Scenario (IPCC SRES) Set to baseline levels? X Set to projected future levels? X X X (A1B) 16
17 C Ozone Concentrations Current Ozone Concentrations Mean Daily Maximum 8 Hour Average (ppb): 51 Data Source: U.S. EPA Air Quality System Mean of 3 monitors within county, April-October Future Ozone Projections 2050 Mean Daily Maximum 8 Hour Average (ppb): 45 Data Source: GCM: NCAR, Resolution: 12km, IPCC Scenario A1B, with Projected Anthropogenic Emissions Inventory, May-August Delta: ~6ppb ~11% decrease 17
18 D Population Data 2010: 919,628 US Census : 1,908,598 US EPA ICLUS 1.3.2, A1 Scenario 600, , , , ,358 Population 400, , , , , , , ,000 81, Age Groups 18
19 D Population Scenarios (A) Constant Population (Held at 2010 Population Levels) Data Source: U.S. Census 2010 (B) 2050 Population Size, with 2010 Age-Sex Distribution Data Source: U.S. EPA ICLUS v1.3.2 (C) 2050 Population IPCC A1 Scenario Data Source: U.S. EPA ICLUS v1.3.2 Population Size 919,628 1,908,598 1,908,598 Demographic Profile 45-64, , , , , , , , , , , ,
20 Health Impact Asthma ED Visits Avoided, per warm season Age Group (A) Constant Population (Held at 2010 Population Levels) Data Source: U.S. Census 2010 Population size: 919,628 (B) 2050 Population Size, with 2010 Age-Sex Distribution Data Source: U.S. EPA ICLUS v1.3.2 Population size: 1,908,597 (C) 2050 Population IPCC A1 Scenario Data Source: U.S. EPA ICLUS v1.3.2 Population size: 1,908, Total
 2050 Population Size, with 2010 Age-Sex Distribution Data Source: U.S. EPA ICLUS v1.3.")

21 Health Impact Asthma ED Visits Avoided, per warm season Age Group (A) Constant Population (Held at 2010 Population Levels) Data Source: U.S. Census 2010 Population size: 919,628 (B) 2050 Population Size, with 2010 Age-Sex Distribution Data Source: U.S. EPA ICLUS v1.3.2 Population size: 1,908,597 (C) 2050 Population IPCC A1 Scenario Data Source: U.S. EPA ICLUS v1.3.2 Population size: 1,908, equivalent 9.9 to removing full days Total Seems small? Remember an average day sees about 12.1 asthma ED visits. This is roughly of visits from each warm season
22 Summary Projected summertime ozone concentrations for Mecklenburg County, due to anthropogenic emissions. in asthma emergency department morbidity, moderately sensitive to future population demographics. Continued reductions in anthropogenic emissions are needed to offset climate-changerelated increases in ozone and population dynamics 22

23 Next Steps Scaling up to whole state of North Carolina Age group / Sex /Disease specific concentrationresponse functions Asthma COPD Cardiovascular diseases 2nd air quality projection for 2050 that uses current emissions levels for comparison. 23
 R832751010 R832751010 CDC BRACE (Lauren Thie) 1UE1EH001126-01 Note: Data were obtained from the NC")

24 Acknowledgements CISA Small Project Grant This project also builds off of the following grants: EPA STAR Grant (Adel Hanna) R R CDC BRACE (Lauren Thie) 1UE1EH Note: Data were obtained from the NC DHHS/DPH NC DETECT system under a data use agreement. The NC DETECT Data Oversight Committee does not take responsibility for the scientific validity or accuracy of methodology, results, statistical analyses, or conclusions presented. 24


25 Questions / Contact Info Age 36 in 2050 Age 41 in 2050 Steven Lippmann Department of Epidemiology and Carolinas Center for Health Informatics University of North Carolina at Chapel Hill slippmann@unc.edu 25