Identifying and Addressing Drivers and Barriers to Construct Solar Thermal Power Plant in Mongolia
|
|
|
- Scarlett Ward
- 5 years ago
- Views:
Transcription
1 Identifying and Addressing Drivers and Barriers to Construct Solar Thermal Power Plant in Mongolia A dissertation submitted to Murdoch University for the degree of Master of Science in Renewable Energy Buyanjargal Ser-Od B.Eng, Mongolian University of Science and Technology School of Engineering and Energy Murdoch University 2013
2 DECLARATION I declare that this dissertation is a true account of my research undertaken for identifying and addressing drivers and barriers for constructing solar thermal power plant in Gobi region of Mongolia. All extracts of the work of others are appropriately acknowledged. The main content of this work has not been previously submitted for a degree at any tertiary education institution. Buyanjargal Ser-Od Page ii
3 ABSTRACT Having an adequate energy supply is a crucial issue in encouraging and maintaining the sustainable economic growth of the country. Due to the development of mining activities, the expected electricity demand of the Gobi region of Mongolia is expected to reach 650 MW in Thus, it will be necessary to construct a number of new power plants in the Gobi region of Mongolia because the current installed capacity cannot meet the current peak load and the amount of electricity imported from Russia is constantly increasing. This dissertation focuses on identifying the feasibility of constructing solar thermal power plants in the Gobi region of Mongolia. Moreover, drivers and barriers for constructing solar thermal power plants and possible mitigation measures are discussed in this thesis. The current situation and future perspectives of Mongolian energy sector, Mongolian renewable energy resources and its applications, and development of solar thermal power technology in the world are studied and reviewed within the scope of work of this thesis. Technical and economic analysis on parabolic trough CSP and central receiver CSP are undertaken using the System Advisor Model software for performing preliminary analysis of varies renewable energy technologies. According to the findings of these studies, a 50 MW parabolic trough CSP with 2 hours of thermal energy storage is considered the most suitable option in Gobi Page iii
4 region of Mongolia in terms of the maturity and economic characteristics in comparison with other CSP technologies. In order to implement a 50MW parabolic trough CSP in Mongolia, it is necessary to consider drivers and barriers, and mitigation measures for dealing with the barriers. An abundant solar resource in the Gobi region of Mongolia, renewable energy legality and policy, and the necessity of constructing new power plants in the Gobi region are considered as the main drivers. On the other hand, there are barriers for implementing CSP such as high initial capital cost, and the lack of professional workers. However, it is possible to mitigate these barriers by using Clean Development Mechanism funding formulated in the Kyoto Protocol and preparation of professional workers by vocational training offered by TAFE colleges and universities. Moreover, there are also further potential cost reductions in CSP technologies expected through technological and efficiency improvement measures. Page iv
5 Contents DECLARATION... ii ABSTRACT... iii LIST OF FIGURES... vii LIST OF TABLES... viii ACKNOWLEDGEMENT INTRODUCTION Background Research focus Document outline Methodology THE MONGOLIAN ENERGY SECTOR AND THE NECESSITY FOR NEW POWER PLANTS Country profile Location Population Governance and Administrative structure Climate Economy Central Energy System General CES and Energy markets CES s power plants and electricity generation Transmission grid of CES Future perspective of energy demand and supply Expected mining activities and their energy demand Current possibility of CES, necessity of new power plants DEVELOPMENT OF RENEWABLE ENERGY IN MONGOLIA General Legal environment of the renewable energy Renewable energy resources and its utilization Solar energy resource and its utilization Wind energy resource, and its utilization Hydropower resource, and its utilization Geothermal energy resource, and its utilization DEVELOPMENT OF CONCENTRATING SOLAR THERMAL POWER PLANT Brief history of CSP technology Page v
6 4.2. CSP technology Parabolic trough Central Receiver or Solar Tower Linear Fresnel Reflector Parabolic Dish Thermal energy storage Comparison of CSP technologies Current situation and future prospects of CSP technologies FEASIBILITY TO CONSTRUCT CSP PLANT IN MONGOLIA General Solar Resource Assessment of the proposed site Site selection Solar Resource Technical and Economic model for evaluating CSP RETScreen software System Advisor Model Technical and Economic analysis of CSP technologies Parabolic trough CSP Solar Tower CSP Selection of the best technology for Mongolia DRIVERS AND BARRIERS FOR CONSTRUCTING CSP IN MONGOLIA Drivers Barriers and its mitigation measures CONCLUSIONS AND RECOMMENDATIONS REFERENCES APPENDIX Page vi
7 LIST OF FIGURES Figure 2.1. The geographical location of Mongolia... 7 Figure The ecological zones of Mongolia... 8 Figure 2.3. Administrative units of Mongolia Figure 2.4. Mongolian Energy System Figure 2.5. Single Buyer Model Figure 2.6. Electricity generation and distribution of CES Figure 2.7. Peak Load of CES Figure 2.8. The participants of power plants in peak load Figure 2.9. Import and Export of CES Figure The 220 kv and 110 KV OHTL Figure Main mines in Southern Mongolia Figure Peak demand forecast of CES and South Gobi Figure 3.1. Solar energy resource distribution map of Mongolia Figure 3.2. Sunshine duration zones of Mongolia Figure 3.3. Wind resource atlas of Mongolia Figure 3.4. Geothermal energy resources of Mongolia Figure The classification of CSP technology Figure 4.2. The general view of parabolic trough and CSP system Figure 4.3. The general view of Central Receiver and CSP system Figure 4.4. The general view of Linear Fresnel reflector and system Figure 4.5. The basic scheme of parabolic dish Figure 4.6. Process flow diagram of Andasol 1 CSP Figure 4.7. The cumulative installed capacity of CSP Figure 4.8. CSP capacity forecast Figure The LCOE of existing and proposed CSP projects Figure The expected tariff development Figure Overview on main technological/efficiency improvement measures Figure Cost reduction forecast Figure Cost comparison of dispatchable CSP vs conventional plants Figure Most potential areas for constructing CSPs Figure The proposed site for constructing CSP in Mongolia Figure 5.3. Solar resource atlas of Mongolia Figure 5.4. The seasonal changes of the DNI and clearness index Figure 5.5. The solar radiation data, Meteonorm Figure 5.6. RETScreen energy model for CSP Figure 5.7. The breakdown of the capital costs assumption (Parabolic Troughs) Figure 5.8. Plot Real LCOE vs Full load hours of TES Figure 5.9. The breakdown of the capital costs assumption (Solar Tower) Figure Plot Real LCOE vs Full load hours of TES Page vii
8 LIST OF TABLES Table 2.2. Power plants of CES Table 2.3. Potential large scale mines in Southern Mongolia Table 3.1. Solar energy sources of Mongolia Table Wind resources at 30m (good to excellent sites) Table 3.3. Wind resources at 30m (moderate to excellent sites) Table 3.4. Solar and wind hybrid power stations Table 3.5. Hydropower plants of Mongolia Table Comparison of CSP technologies Table Direct Normal Radiation at the proposed site and its variability, NASA data Table 5.2. The main results of the economic analysis (Parabolic Troughs) Table 5.3. The main results of the economic analysis (Solar Tower) Table 5.4. Technical characteristics of CSP technologies Table 5.5. Comparison of CSP technologies by economic parameters Page viii
9 ACKNOWLEDGEMENT I would like to especially thank my supervisor, Dr. Trevor Pryor, for his kind help, guidance, and full review.. Moreover, I would like to express my sincere gratitude to Natasha Warnock, International Liaison Officer for her invaluable support. Finally, Lastly I would like to thank my wife, Ganchimeg Gurbazar, sons and daughter, who had to give up precious family time with me over the past two years in Western Australia allowing me to studying in Murdoch University, and without whose support and encouragement I could never have achieved this important goal in my life. Page 1
10 1. INTRODUCTION 1.1. Background A well developed energy infrastructure providing an adequate energy supply is one of the key factors for encouraging and maintaining the sustainable economic growth of any country. Therefore, countries continue to develop new generating capacity in order to have adequate power capacity in accordance with their economic growth and energy demand. In terms of energy sector development, the Mongolian energy system consists of four regional energy systems, and a number of isolated small diesels and renewable energy sources for supplying aimags 1 and soum centres, which are not connected to the regional energy systems. Although, total installed capacity of the Mongolian energy system has reached MW, large-scale power plants have not been constructed since 1990 in the Mongolian energy sector. On the other hand, Mongolia has huge mineral resources such as gold, copper, coal and other minerals. Therefore, the mining sector has grown rapidly in Mongolia since 2009 particularly in the Gobi region of Mongolia. For example, Tavan Tolgoi coking coal deposit and Oyu Tolgoi copper deposit are located in Umnugobi aimag. The expected power demand of these two mining developments is about 400 MW. However, Umnugobi aimag is not connected to the electrical grid and the only energy infrastructure is a 6MW combined heat and power (CHP) plant. In addition, Umnugobi aimag is located about 500 km from the 1 Aimag is the administrative unit of Mongolia. Note: According to Law of Mongolia on Administrative and Territorial Units and Their Governance, the territory of Mongolia is divided into Aimags and Capital city, Aimag into Soums, Soum into Baghs, the Capital city into Districts, and the District into Khoroos. Page 2
11 capital city and the nearest high voltage transmission lines are located approximately 300 km from the mining sites. Although the Government has decided to construct a 220 kv transmission line from the Central Energy System (CES) to Tavan Tolgoi and Oyu Tolgoi, the installed capacity of the CES is not enough to supply the expected new demands of these mining activities. Therefore, it is necessary to construct new power plant in the Gobi region. In addition, governments of developed and developing countries have implemented energy policies for improving energy efficiency, and increasing the utilization of renewable energy sources for reducing the negative effects of greenhouse gas emissions and the environmental impacts of conventional power plants. To assist this process the Mongolian Parliament enacted the Law of Mongolia on Renewable Energy and the National Renewable Energy Program for encouraging the utilization of renewable energy sources. As discussed later, Mongolia has quite good solar and wind resources; particularly in the Gobi region which has good solar resources. One of the technologies used for converting solar energy into electricity or heat energy is concentrating solar power (CSP) technology. This type of plant concentrates solar beam radiation to increase the temperature of a heat transfer fluid in the receiver and this heated fluid is used to generate electricity. By using a thermal energy storage system or fossil fuel-fired backup, CSP plants can generate electricity according to demand. Nowadays, there are four major CSP technologies in use: parabolic trough, central receiver, linear Fresnel reflector and parabolic dish. However, the required initial capital cost and the resulting electricity cost of CSP are still higher than traditional coal or gas fired power plants Page 3
12 (Hang et al. 2008). However, the utilization of CSP has increased significantly since 2007 and there is potential for cost reductions in CSP through mass production and technology development. According to the estimations of A.T.Kearney and ESTELA (2010), CSP technology will compete with conventional power plants by 2015 in terms of electricity costs. Based on the above mentioned factors, there is significant potential to utilize solar thermal power plant in the Gobi region for supplying the electricity demand of the region. This is one of the motivations of this thesis, to determine the feasibility of utilizing solar thermal power stations in the Gobi region of Mongolia. This thesis intends to study the feasibility of a 50 MW solar thermal power plant in the Gobi region of Mongolia and to identify and address the drivers and barriers of such a solar power plant Research focus As mentioned in the previous section, four major CSP technologies are used in the world. Each of these technologies has their own advantages and disadvantages. Thus, it is necessary to determine which technology is more suitable in Mongolian conditions in terms of technical and economic characteristics. Therefore, this thesis deals with the following fundamental research questions: Which CSP technology is the best option for utilizing in the Gobi region of Mongolia in terms of technical and economic criteria? What are the drivers and barriers for utilizing solar thermal plant in the Gobi region? What are the important considerations for addressing barriers for constructing solar thermal plant in Mongolia? Page 4
13 1.3. Document outline In Chapter 2, the current situation of the Mongolian energy sector and its future perspectives are discussed. Also, the necessity of new power plants is assessed in this chapter. Chapter 3 describes the renewable energy resources of Mongolia and their current applications. Chapter 4 describes the development of the solar thermal power plant technologies. The discussion also includes a technical comparison of four CSP technologies and future cost reduction potentials for these CSP technologies. Chapter 5 includes the technical and economic analysis on parabolic troughs and central receiver CSP technologies. The drivers and barriers for constructing CSP plant in the Gobi region of Mongolia are discussed in Chapter 6, with conclusions and recommendations provided in Chapter Methodology The following methodologies are used to deal with the research issues: Literature survey and literature review. The literature reviews mainly focus on identifying the development of solar thermal power plant technologies, and on the utilisation of solar thermal plants in developed and developing countries which have similar climatic conditions as the Gobi region of Mongolia. The literature survey will cover professional books, projects reports and journal articles. Technical and Economical Analysis. RETScreen and System Advisor Model, evaluation software for renewable energy technologies, will be used to carry out the performance and economic analyses for determining the most suitable CSP technology options. Page 5
14 Critical thinking and analysis. Critical discussion and analysis on the results of the technical and economic analysis on CSP technologies is used to reach an answer to the research question posed earlier. Page 6

15 2. THE MONGOLIAN ENERGY SECTOR AND THE NECESSITY FOR NEW POWER PLANTS 2.1. Country profile Location Mongolia is located in Northern Asia and is a landlocked country with the Russian Federation on the north, and the People s Republic of China on the south. The latitude and longitude of the Mongolian territory is shown below: Latitude: 41 о 35 N 52 о 09 N Longitude: 87 о 44 E 119 о 56 E The geographical location of Mongolia is shown in Figure 2.1. Source: Figure 2.1. The geographical location of Mongolia Page 7

16 The Mongolian territory covers about 1,565,000 square kilometres and Mongolia is ranked the 19 th largest country in the world by its land area. The territory of Mongolia is divided into four regions such as Khangai and Khentii, Altai mountains, Dornod plains and Gobi regions in regarding with natural and geographical characteristics (MSRM 1998). Altai, Khangai mountain ranges are located in the north and west part of the territory, while Gobi and desert regions are located in the south and east of the country. The average elevation of territory of Mongolia is 1580m above sea level. In addition, the Mongolian territory consists of six ecological zones which are high mountain, taiga (forest), forest steppe, steppe, desert steppe and desert. All these ecological zones have their own features and each is different in terms of climate, terrain, flora and fauna (MSRM 1998, 3). A map of these ecological zones of Mongolia is shown in Figure 2.2. Source: MSRM, 2010 Figure The ecological zones of Mongolia Page 8
17 Population According to the National Statistical Office of Mongolia (2013), the total population of Mongolia was estimated to be 2.8 million at the end of The average population density of Mongolia is 1.8 people/km 2 and Mongolia is considered as one of the most sparsely populated countries in the world. The highest population density is 261.9people/km 2 in the capital city, while the smallest is 0.4 people/km 2 in Umnugobi and Gobi-Sumber aimags. Approximately 42.9% of the total population live in Ulaanbaatar, the capital city of Mongolia. Also, the percentages of the total population living in other urban areas and in rural areas are 25.0% and 32.1% respectively (NSO 2013). People between years old make up about 65% of total population. The average life expectancy was years in 2009, being 64.3 years for males, and years for females (NSO 2009) Governance and Administrative structure Mongolia is a democratic country which transferred from being a socialist country in According to the new Constitution enacted by State Great Khural 2, Mongolia is an independent, parliamentary republic. The Mongolian parliament consists of 76 members and parliamentary elections taken place once in every four years (NSO 2009). 2 State Great Khural Mongolian Parliament Page 9

18 In terms of administrative units, Mongolia is divided into 21 aimags and the capital city. Each aimag is divided into soums, and each soum into baghs. Similarly, the Capital city is divided into districts, and the districts into khoroos. Bagh and khoroo are the smallest administrative units in Mongolia. In total, Mongolia has 21 aimags, 329 soums, 1568 baghs, one capital city, 9 districts and 132 khoroos (NSO 2009). The Aimags and the capital city are shown in Figure 2.3. Source: Figure 2.3. Administrative units of Mongolia In addition, the governance of aimags and capital city are by Citizen s Representatives Khural, and the local elections also take place once in every four years (NSO 2013) Climate Mongolia has a sharply continental climate and has four distinct seasons: winter, spring, summer and autumn. The winter season is long and cold, while summer is quite short. The air temperatures range from -20 C to -35 C in winter, to ranges of C in summer. In particular, the maximum temperature in the Gobi desert Page 10
19 reaches as high as 40 C. The average temperatures between November and March are below freezing point, and the average temperatures of April and October are close to the freezing point. Annual precipitation distribution is related to the geographical characteristics and seasons. For example, annual precipitation in the Khentii, Altai and Khuvsgul mountains ranges from 200mm to 350 mm. By contrast, it is less than 100 mm in the Gobi regions. There may be no precipitation for several years in some parts of the Gobi. Most of the annual precipitation occurs in summer Economy Mongolia has transformed from a centrally planned economy into a free market economy since As a result of measures for stabilizing the economic performance and restructuring the economy, about 75% of the Mongolian economy is now in private hands. This is a significant change frojm the earlier centrally planned economy where there were no private companies. Moreover, the Mongolian economy has been improved since 2007 due to increased prices growth for mineral resources, increasing mining activities, and other factors (ADB 2012). Some macroeconomic indicators of Mongolia between 2010 and 2012 are shown in Table 2.1. Page 11
20 Table Macroeconomic indicators of Mongolia between 2010 and 2012 No. Indicator GDP at current prices, billion togrog GDP at 2005 constant prices, billion togrog GDP per capita, thousand togrog GDP growth, % Share of budget revenue in GDP, % Share of budget expenditure in GDP, % Budget balance in GDP, % National consumer price index, % Exports, million USD Imports, million USD External trade balance, million USD GDP by divisions, at 2005 constant prices, billion togrog - Agriculture, forestry, hunting and fishing Mining & Quarrying Manufacturing Electricity, gas and steam and air conditioning - Water supply Construction Wholesale and retail trade Accommodations and food services Transport, and storage IT and communications Financial and insurance activities Real estate activities Professional, scientific and technical activities - Administrative and support services Public administration and defence Education Health and social work activities Arts, entertainment and recreation Other service activities Net taxes on products Source: NSO, 2013 From Table 2.1, the economic growth rate of Mongolia was 12.3%, GDP was MNT 13.9 trillions and GPD per capita was MNT 4.8 millions in Mining and quarrying, and agriculture are the main components of the GDP and these sectors comprise 15.7%, and 14.6% of GDP respectively. Transport and storage, and wholesale and retail trading sectors are ranked in third and fourth place in terms of their shares in GDP (NSO 2013). 3 Togrog - MMongolian National Currency (MNT), 1 USD = MNT, 1AUD= MNT in 31/12/2012 (Mongol Bank, 2012) Page 12
, Eastern Regional Energy System (ERES), Western Regional Energy System (WRES) and the Altai-Uliastai Energy System")
21 2.2. Central Energy System General The energy sector of Mongolia consists of the Central Energy System (CES), Eastern Regional Energy System (ERES), Western Regional Energy System (WRES) and the Altai-Uliastai Energy System (AUES). The energy demand of those aimags, soums and urban areas which have not been connected to the centralized energy system is supplied by independent thermal and diesel power plants and small solar and wind sources (ERC 2013). The general scheme of the energy sector is shown in the Figure 2.4. Figure 2.4. Mongolian Energy System Source: ERC 2013 The WRES provides the aimag centres and soums of Uvs, Khovd, Bayan-Ulgii aimags with imported electricity from Krasnoyarsk, Russia and electricity Page 13
22 generated by the Durgun hydro-power plant 4. The average annual consumption of this region is about 71.8 million kwh. The peak load in the winter season is about 17.0 MW and the lowest load in the summer season is about 2.4 MW respectively. The AUES provides Gobi-Altai, and Zavkhan aimags centres and soums. The generation source for AUES is the Taishir hydropower plant with a capacity of 11MW. AUES is connected to the CES by 110 kv transmission lines. Choibalsan thermal power plant is the main power generator of ERES and it provides the Dornod and Sukhbaatar aimag centres and 12 soums. The power plant was commissioned in 1970 and its installed capacity is 36 MW. In 2012, the peak load and minimum load of the ERES were 27.8 MW, and 8.6 MW respectively. The Choibalsan CHP generated million kwh of electricity energy and distributed 77.0 million kwh electricity to the consumers in The CES consists of 5 power plants, one transmission network and 4 distribution networks and it supplies Ulaanbaatar city, 11 aimag centres and over 270 soums with electricity. The total generation capacity of the CES is MW. In addition the CES is connected to the Russian electricity grid by 220 kv transmission lines. As the CES is the largest energy system, demand and supply of CES has been studied in this thesis. 4 Durgun hydropower plant commissioned in 2009 and its installed capacity is 12MW. Page 14
23 CES and Energy markets Overall 91% of the electricity production is produced by the CES and 96% of the electricity demand of the country is met by the CES. This system consists of five combined heat and power plants; the Ulaanbaatar power plants No. 2, No.3 and No.4, Darkhan city power plant and Erdenet city power plant, the central region power transmission network as well as the power distribution networks of Ulaanbaatar, Darkhan, Erdenet and Baganuur. This system provides electricity to Ulaanbaatar, Darkhan, Erdenet, Baganuur cities and over 270 soums in Tuv, Dundgobi, Dornogobi, Arkhangai, Khentii, Selenge, Bulgan, Uvurkhangai, Khuvsgul, Bayankhongor and Gobi-Sumber aimags (ERC 2012). The power plants of the CES used to be under centralized control and management until The system was then restructured into 18 companies with different operations such as generation, transmission, distribution and supply (ERC 2012). The holders of special licenses for generation, transmission, distribution and supply operate within the framework of single buyer model approved by the Energy Regulatory Committee (ERC). In other words, a single customer called the National Electricity Transmission Network (NETN), a state owned shareholding company, has been purchasing electricity from the 5 power plants and importing additional electricity from Russia, and reselling it to 9 electricity distribution companies since September 2002 (ERC 2012). The revenue collected from the customers of the central region has been allocated by the bank automatically everyday to the zero balance revenue accounts and to Page 15

24 the accounts of the generation companies, transmission companies and distributors according to the pre-established percentage through a consolidated account. This percentage is pre-established by the meeting of the holders of special licenses, which has representations of all the 10 special license holders involved in the regulation of the electricity payment cash flow (ERC 2012). The single buyer model is shown in the Figure 2.5. Source: ERC 2012 Figure 2.5. Single Buyer Model In addition, spot market and auction markets are run in the CES alongside the single buyer model. The spot market is based on the differences between the amounts of planned electricity generation and the amount of real-time electricity supply. Due to Page 16
25 contingency faults in operation, a generation company may be unable to produce its planned generation and an electricity shortage will be created in the energy market. In that case, the generation company should purchase this shortage from other generation companies. The price of this trade should be determined by the highest tariff of the generation companies participating in the spot market. In other words, the main of aim of the spot market is that power plants will try not to breach the planned generation. In case of breaching it, a power plant will carry some responsibility regarding the spot market rule (ERC 2012). In 2012, about 2.9 million kwh of electricity or MNT million was traded in the spot market (ERC 2013). In the auction market, generation companies compete with each other by their electricity price proposal in order to get the right to supply extra generation offers. According to the best practices of European countries, the main principle of the auction market is the proposed lowest electricity price. However, it is difficult to follow this principle in the CES of Mongolia because all five power plants are different from each other in their installed capacity and electricity cost. Therefore, generators compete in the auction market with their tariff reduction offer. In other words, the generator who offered to reduce its tariff by the higher percentage will be ranked first. This principle creates equality for power plants with significantly different tariffs for participating in the auction market (ERC 2012). In 2012, a total of 9.8 million kwh of electricity was traded in the auction market. Generators participated in the auction market by decreasing their energy tariff by 0.15 to 0.4% (ERC 2013) CES s power plants and electricity generation The present total installed capacity of the CES is MW (ERC 2013). The basic technical parameters of the power plants are shown in the Table 2.2. Page 17
26 Power plants Year of establishment Table 2.2. Power plants of CES Installed capacity, MW Potential capacity, MW Internal usage, % Thermal capacity, GCal/h CHP % 31.0 CHP % CHP % Darkhan CHP 1966, % Erdenet CHP % Total Source: MMRE 2010 Since all the existing thermal power plants of the CES are coal fired, and designed to operate in base load mode or regime, they have less capability to regulate load and frequency at peak load. Therefore, electricity is imported from the Russian Federation by two 220 kv transmission lines in order to meet and regulate the electricity demand and frequency of the system. The total capacity of the two 220 kv transmission lines used to import electricity from Russia is 255 MW. According to the agreement between the CES and the Russian Federation it is possible to import MW electricity at any time (ERC 2012). The electricity generation and distribution of CES is shown in Figure 2.6. From Figure 2.6, it is clear that the average annual growth of CES electricity production between 2000 and 2012 is about 4.7% (ERC 2013). Page 18


27 Source: ERC 2013 Figure 2.6. Electricity generation and distribution of CES The peak load of the CES is increasing from year to year due to increasing electricity demand and the peak load was 782 MW in 2011 and 863 MW in The peak load of 2012 increased by 10.4% or 81MW compared with The peak load survey between 2000 and 2012 of CES is shown in the Figure 2.7. Figure 2.7. Peak Load of CES Source: ERC 2013 Page 19
. Source: NDC 2013 Figure 2.8. The participants of power plants in peak load From Figure 2.")
28 In order to cover the peak load and regulate the system frequency electricity is imported from Russia. The participation of power plants and imported electricity for suppling peak load in 2012 are shown in Figure 2.8 in percentage form (NDC 2013). Source: NDC 2013 Figure 2.8. The participants of power plants in peak load From Figure 2.8, it is clear that all power plants of the CES combined generated about 80.5% of peak load of 2012, and 19.5% of the peak load was supplied from Russian electricity imports. Due to there not having been any construction of new large scale power plants in the CES even though the electricity demand has been increased, the amount of electricity imported from Russia has been increasing since 2006 (ERC 2013). The changes of import and export of electricity to and from the CES are shown in Figure 2.9. Page 20
29 Source: ERC 2013 Figure 2.9. Import and Export of CES From Figure 2.9, the amount of electricity imported from Russia in 2011 was million kwh, while this figure increased dramatically by 53.3% and reached million kwh in 2012 (ERC 2013) Transmission grid of CES The CES basic transmission grid consists of 220 kv and 110 kv overhead transmission lines and substations constructed mostly to the designs of the Russian Federation. As of today the CES uses 1,044 km of 220 kv transmission line and 38,196 km of 110 kv OHTL as well as six 220 kv and fifty four 110 kv substations. The basic 220 kv and 110 kv electricity transmission grid of the CES is shown in Figure Page 21
 for each phase and the aluminium wires with 240 mm 2, 300 mm 2 and 400 mm 2 cross sections are used as transmission wire.")
30 Figure The 220 kv and 110 KV OHTL All existing 220 kv transmission lines were constructed during the period between 1976 and They have single aluminium wire (AC type) for each phase and the aluminium wires with 240 mm 2, 300 mm 2 and 400 mm 2 cross sections are used as transmission wire. All the 220 kv transmission lines were built with iron supports. However, the Darkhan Ulaanbaatar, Baganuur-Choir and Choir- Mandalgobi transmission lines have combined reinforced concrete and iron supports (ERC 2013) Future perspective of energy demand and supply Expected mining activities and their energy demand As Mongolia has huge mineral resources, a number of mining activities are planning to operate in Mongolia. In particular, there are significant copper and coking coal deposits such as Oyu Tolgoi, Tsagaan Suvarga, and Tavan Tolgoi found in Southern Mongolia (WB, 2009). The main large scale mining activities in Southern Mongolia are shown in Figure Page 22

31 Source: WB 2009 Figure Main mines in Southern Mongolia From Figure 2.11, the majority of the proposed mining activities of Southern Mongolia are located in Umnugobi aimag where, as yet, there is no well-developed infrastructure and power supply. The preliminary estimations of annual production of these mining activities and possible start dates are shown in Table 2.3. Table 2.3. Potential large scale mines in Southern Mongolia Lifetime, Production, Expected Start Mine Mineral years thousand tons/year date Nariin Sukhait Coal Ukhaahudag Coal Ovoot Tolgoi Coal Oyu Tolgoi Copper Tavan Tolgoi Coal Shivee Ovoo Coal Tsagaan Suvarga Copper Source: WB Oyu Tolgoi and Tsagaan Suvarga s mining productions are estimated by copper concentrate (30% copper). Page 23
32 The Ukhaahudag mining is supplied electricity from its own 18 MW CHP plant and Nariin Sukhait and Ovoot Tolgoi mines are supplied by imported electricity from China (ERC 2013). According to the estimation of the World Bank (2009), the expected demand of these mining activities will reach 294MW in 2013 and 650 MW by These estimations are based on the following assumptions: Oyu Tolgoi copper mining will produce its first production in 2013 and the expected electricity demand will be 200 MW. In addition, the second phase of Oyu Tolgoi will start in early 2017 and its electricity demand is projected to reach 300 MW. The mining activities of Tavan Tolgoi and Baruun Naran deposits will start in 2013 and its production will increase gradually to 20 million tons per year by The expected electricity demand of these mining activities will reach around 200MW by 2020 in relation to its production growth. Tsagaan Suvarga copper mine will commence in 2015 and its projected electricity demand will be 70 MW. There will be new towns constructed with a population between 80,000 and 120,000 people related to these mining activities in Southern Mongolia. The expected demand of these towns will be 20MW. Although it is difficult to estimate demand of the other non-mining activities which will be developed in relation with major mining activities and new towns, experts from the World Bank (2009) estimate that it will be reached 30MW by World Bank s (2009) peak demand forecast of CES and Southern Mongolia are shown in Figure Page 24

33 Source: WB 2009 Figure Peak demand forecast of CES and South Gobi From Figure 2.12, total peak demand of CES and South Gobi will increase from 1100 MW in 2013 to 1600 MW in Current possibility of CES, necessity of new power plants As mentioned in section 2.2, the current installed capacity of CES is 814.3MW and the maximum continuous generating rate is MW. This capacity can only provide 666MW without any spinning reserve. Therefore, as mentioned before, the CES imported 165 MW power for supplying peak demand in In international practice, the spinning reserve of capacity should be at least 20% (WB 2009). In addition, CHP 2, CHP 3, and Darkhan CHP will be reaching the end of their operating lifetimes. For example, the retirement schedule of the above-mentioned power plants in the Mongolian Energy Master Plan (EE 2002) was: Page 25
34 CHP 2 would be retired in 2005 Medium pressure power plant of CHP 3 in 2008 High pressure power plant of CHP 3 in 2011 Darkhan CHP would be retired in However, these power plants are still in operation because of no new large scale power plants have not been constructed in CES since So, there is a strong likelihood that the generating capacity in the CES will decrease in the near future (WB 2009). The transmission capacity of the two 220 kv transmission lines interconnected with Russia is 255 MW. Thus, it is possible to increase the capacity imported from Russia up to 255 MW. However, the total generating capacity of the CES with the maximum 255MW of Russian imported electricity is still not sufficient to supply the demand growth of CES in the short term (WB 2009). In other words, there will be power supply shortages in the CES and Southern Mongolia without any additional capacity provided through construction of new power plant or increasing Russian electricity imports. Due to the national security policy, and the risks related to dependence on another country, increasing imports from Russia is deemed an unsuitable option for supplying the expected demand shortfall (WB 2009). Therefore, it is necessary to construct new power plants in the CES for supplying the growth of existing peak demand and the expected demand of mining activities (WB 2009). In addition, the Mongolian Government has carried out a lot of research for constructing large scale power plants at Tavan Tolgoi and Oyu Tolgoi. Since the Gobi region (southern part of Mongolia) has a quite good solar resource, it is possible to Page 26
35 construct renewable energy sources in Gobi region for supplying a certain part of the expected power demand of the major mining activities in Southern Mongolia. Page 27
36 3. DEVELOPMENT OF RENEWABLE ENERGY IN MONGOLIA 3.1. General The main objective of this dissertation is to investigate the possibility of constructing a solar concentrating power plant in the Gobi region of Mongolia. Therefore, it is necessary to study the legal environment of renewable energy, renewable energy resources and their utilizations for identifying the renewable resource assessment, drivers and barriers for constructing renewable energy sources in Gobi region of Mongolia. Thus, Chapter 3 will discuss the legal environment of renewable energy in Mongolia and the current situation with respect to renewable energy utilization Legal environment of the renewable energy The Renewable energy law enacted by Parliament on January 11, 2007 is to ensure the increase of renewable energy utilization in Mongolia and to regulate generation and supply of energy utilizing renewable energy sources (Batbayar 2010). By enacting the law, the rights and responsibilities of the Parliament, the Government of Mongolia, the State Administrative Authority and the Governors of Aimags, and the Capital city are determined. In addition, the procedure of granting licenses for renewable energy developments is identified clearly. The Law sets up tariff range of energy generated and supplied by renewable energy power sources depending on sources and capacity of generation. The provision of the Law indicates, that the Energy Regulatory Commission (ERC) shall set tariffs and Page 28
37 prices of energy generated and supplied by renewable energy power sources and connected to transmission network within the following tariff range: $/kWh for wind power source; $/kWh for hydropower station with capacity up to kw; /kWh for solar power source. The provision of the law (2007) indicates, that the Energy Regulatory Boards of Aimags and the Capital City shall set prices and tariffs of energy generated and supplied by independent renewable energy power source within the following tariff range: $/kWh for wind power source; $/kWh for hydropower station with capacity up to 5 00 kw; $/kWh for hydropower station with capacity of kw; $/kWh for hydropower station with capacity of kw; $/kWh for solar power source. These prices and tariffs for renewable energy shall be implemented within 10 years of the Renewable energy law being approved in The Parliament of Mongolia has approved the National Renewable Energy Program in order to increase renewable energy penetration in the energy system of Mongolia, to improve the structure of power supply, and to increase the utilisation of renewable energy in off-grid soum and settlements to ensure ecological balance and improve the economic efficiency. The scope of goals to be reached by the Program (2005) are as follows: Page 29
38 Improve the energy efficiency, and providing sustainable growth of the energy sector by increasing the utilization of renewable energy sources; Increasing the utilizations of renewable energy sources for meet the mandatory renewable energy target. The mandatory renewable energy target of Mongolia is that renewable energy sources will supply percent of the total electricity consumption by 2020; provide power to consumers who are living in remote settled areas which are not connected to the central electricity grid by constructing renewable energy power systems. The National Renewable Energy Program (2005) shall be implemented in two stages in relation with short term ( ) and long term ( ). During the first stage of the program, the following activities were implemented (Batbayar 2010): Durgun, Taishir hydropower plants constructed and commissioned. Now these two HPP are in operation. National Program titled Solar Gers was implemented. The main objective of this program was to supply approximately solar panels (capacity of each solar panel is 50W) for herder households in rural area. The feasibility studies for 15 wind-solar or wind-solar diesel hybrid systems for supplying electricity for remote area were carried out and implemented. However, some of these renewable energy systems were damaged and out of operation due to poor technical choices and management. Page 30
39 Feasibility studies of small hydropower plant for supplying electricity in local remote areas were developed and 8 small hydropower plants with capacity kw were constructed I Bayan-Ulgii, Khovd, Uvs and Zavkhan aimags. The detailed research work on identifying the potential areas for constructing wind parks are carried out at a number of sites such as Salkhit hills, Khuitnii Ongorkhoi, and other places located in eastern and southern regions of Mongolia. The following activities should be implemented in the second stage (Mongolian Parliament 2005): Complete construction and commissioning of the 100MW Orkhon hydropower plant for increasing the stability of Central energy system Implement rural electrification program for supplying electricity. As a result of this program, all remote located settled areas will be supplied by renewable energy sources Increase the utilization of renewable energy technologies such as solar, wind, hydro, biomass and geothermal power in the capital city and other large towns for reducing air pollutions and greenhouse gas emissions Construct wind parks in potential sites identified by the detailed research done within the first phase. Carry out the feasibility studies for constructing large scale solar PV power plants in the Gobi region of Mongolia and implement the project in cooperation with international experienced companies. Page 31
.")
40 3.3. Renewable energy resources and its utilization Solar energy resource and its utilization Since 1960 solar radiation has been measured by the Meteorological Organization of Mongolia. The total annual solar radiation energy in the whole territory of Mongolia was evaluated as 2.2*10 12 MW based on data collected by Meteorological Organization (NREC 1985). The solar energy distribution in Mongolia which was developed by the National Renewable Energy Centre of Mongolia in 1985, is shown in Figure 3.1. Source: NREC 1985 Figure 3.1. Solar energy resource distribution map of Mongolia From Figure 3.1, solar radiation resources decrease from South to North as the latitude increases. NREC (1985) determined that the solar resource per square metre for 17 percent of the area of Mongolia is more than 1600 kwh/m 2 per year, 25 percent is kwh/m 2, 51 percent is kwh/m 2, and seven percent is less than 1200 kwh/m 2. Page 32

41 One of the parameters for determining the solar energy resource is the sunshine duration. Sunshine duration zone of Mongolia is shown in Figure 3.2. Source: NREC 1985 Figure 3.2. Sunshine duration zones of Mongolia From Figure 3.2, the mountainous areas of Khuvsgul and Khangai as well as the Tagna and Khan-Khuhii ranges have sunshine duration less than 2600 hours and have the possibility to generate 4.5kWh/m 2 per day. By contrast, the Post-Altai Gobi region, the desert steppe and the desert have annual sunshine duration of hours, and the solar radiation is kWh/m 2 per day (NREC 1984). Although Mongolia has quite good solar energy resources, the utilisation of the solar resource is very low. The details of solar energy systems at present in operation are shown in Table 3.1. Page 33
42 Table 3.1. Solar energy sources of Mongolia No Name Location Capacity, kw Month of commissioning 1 Noyon Solar PV Noyon soum, Umnugobi aimag 200 September, Tsetseg Solar PV Tsetseg soum, Khovd aimag 100 December, Bugat Solar PV Bugat soum of Gobi-Altai province , December 4 Durvuljin Solar PV Durviljin soum, Zavkhan aimag 150 June, Urgamal Solar PV Urgamal soum, Zavkhan aimag 150 June, Altai Solar PV Altai soum, Gobi-Altai aimag 200 June, Tsogt Solar PV Tsogt soum, Gobi-Altai aimag 100 June, Bayantsagaan Solar PV Bayantsagaan soum, Bayankhongor aimag 60 January, Altai Solar PV Altai soum, Bayan-Ulgii aimag 10 November, Tsengel Solar PV Tsengel soum, Bayan-Ulgii aimag 10 November, Buyant Solar PV Buyant soum, Bayan-Ulgii aimag 10 November, 2010 Source: ERC Wind energy resource, and its utilization The research work for assessing the wind resource of Mongolia was done by the National Renewable Energy Laboratory of USA in Based on the findings of this research work, a wind energy atlas for Mongolia was developed and this atlas is shown in Figure 3.3. Page 34

43 Source: D. Elliott et al Figure 3.3. Wind resource atlas of Mongolia According to Elliott (2001), the territory of Mongolia has large wind resource potential for industrial and household purposes. The land with good wind resources comprises 10% of the total land area of the country. This amount of windy land could support over 1,100,000 MW of installed capacity when using conservative consumptions that 7MW of capacity per km 2, and potentially deliver over 2.5 trillion kwh per year (see Table 3.2). Page 35
44 Wind Class Table Wind resources at 30m (good to excellent sites) Wind Power, W/m 2 Wind Speed, m/s Area, km 2 Percent of windy area, % Estimated Installed Capacity, MW Estimated Power Generation, GWh/year Total Source: Elliott et al., 2001 If moderate wind resource potential areas are considered, the total windy area can be increased to 620,000 km 2. This area is equal to 40% of the total land area of Mongolia. Based on the wind energy potential in this area, it is possible to construct wind farms with 4,300,000 MW capacity and generate 8 trillion kwh electricity per year (Elliott et al. 2001). See Table 3.3 for more details of this potential. Table 3.3. Wind resources at 30m (moderate to excellent sites) Wind Class Wind Power, W/m 2 Wind Speed, m/s Area, km 2 Percent of windy area, % Estimated Installed Capacity, MW Estimated Power Generation, GWh/year Total Source: Elliott et al Page 36
45 In regard of utilization of wind energy, the following three large scale wind farms are expected to be constructed in the Mongolian energy system: Newcom company has implemented the 50 MW Salkhit wind farm project in Salkhit Mountain in Sergelen soum of Tuv aimag. As a result of wind resource measurement and analysis lasting 6 years, this location was identified as an excellent place for wind farms. Therefore, Newcom have planned to install 31 wind turbines, with each having a capacity of 1.6MW. Currently, the construction and installation of this project is underway and the wind farm will be commissioned in 2013 (Newcom 2012). Sainshand wind farm project will be implemented within Sainshand Industrial Park program of Mongolia in Ulaan Tolgoin Hundii, which is located in the north east, 15 kms from Sainshand town in Dornogobi aimag. The expected installed capacity of this wind farm is 52 MW. Vestas 80-2MW and Nordex S77-1.5MW wind turbines are planned to be installed in this wind farm. The project team concluded a power purchase agreement with NETN and they are working on raising investment with international banks and financing organizations. Qleantech LLC has studied the possibility of implementing a 250 MW wind farm at Tsagaan Khad in Khanbogd soum of Umnugobi aimag. This wind farm is aimed to export electricity to China (Qleantech 2013). In terms of the utilisation of wind energy resources, 80 kw wind turbines were installed in Mandakh soum of Dornogobi aimag, Sevrei soum of Umnugobi aimag and in Bogd soum of Uvurkhangai aimag in 2007 within the rural electrification Page 37
46 activities for connecting off-grid soum centres to renewable energy sources (ERC 2013). The electricity consumption of off-grid soums are carried out by solar and wind hybrid power stations, and 150 kw solar and wind hybrid power stations were commissioned in Tseel soum of Gobi-Altai aimag and in Manlai soum of Umnugobi aimag in December Solar and wind hybrid power stations in operation are shown in Table 3.4. Table 3.4. Solar and wind hybrid power stations No Name Location Tseel Hybrid power stations Bayanundur Hybrid power stations Shine Jinst Hybrid power stations Mandakh Hybrid power stations Capacity, kw Year of commissioning Tseel soum, Gobi-Altai aimag 150 December, 2007 Bayanundur soum, Bayankhongor aimag Shine Jinst soum, Bayankhongor aimag Mandakh soum, Dornogobi aimag 150 June, June, , Upgraded in 2010 Source: ERC Hydropower resource, and its utilization It is estimated that there are about 3800 rivers and streams in the country with a total energy resource of MW and the annual electricity generation of 56.2 billion kwh (Batbayar 2010). About 70 % of all hydro energy resources are concentrated in the Mongolian Altai ranges, in the Tagna and Khan Khentii ranges, in the mountainous areas of Khuvsgul, Khangai, Khentii and Khalkh Gol River. In order to use the hydropower potential, a number of studies have been carried out on possible future construction of hydropower plants such as the 220 MW HPP in Egiin gol, 118MW in Artsat, the 205MW Shirenge HPP, the 100MW Orkhon HPP Page 38
47 in Selenge river (Batbayar 2010). Details of the hydro power plants operating at present are shown in Table 3.5. Table 3.5. Hydropower plants of Mongolia No Hydropower plant Location Capacity, kw Years of commissioning 1 Munkhhairhan HPP Munkhhairhan soum, Khovd aimag 150 July, Bogd river HPP Uliastai soum, Zavkhan aimag 2000 August, Mankhan HPP Mankhan soum, Khovd aimag 150 September, Guulin HPP Delger soum, Gobi-Altai aimag 400 August, Ider HPP Tosontsengel soum, Zavkhan aimag 375 July, Erdenebulgan HPP Erdenebulgan HPP, Khuvsgul aimag 200 October, Uench HPP Uench soum, Khovd aimag 960 November, Durgun HPP Durgun soum, Khovd aimag June, Taishir HPP Taishir soum, Gobi-Altai aimag Hyngyi river HPP Zavkhanmandal soum, Zavkhan aimag 115 May, Galuutai HPP Tsetsen-Uul soum, Zavkhan aimag 150 June, 2010 Source: ERC Geothermal energy resource, and its utilization Mongolia has considerable potential for geothermal energy in the central and western parts such as in Khangai, Khentii, Khuvsgul, Mongolian Altai mountains, Dornot-Darigangiin Steppe and Orkhon-Selenge region. In the area of large electricity demand there are about 42 hot springs. The temperature of these springs (the hot water temperature should be higher than 50 0 C and have flow of m 3 ) is high. However the possibility of obtaining investment and finance for its development is very limited (Batbayar 2010). Geothermal energy resources of Mongolia are shown in Figure 3.4. Page 39

48 Source: Batbayar 2010 Figure 3.4. Geothermal energy resources of Mongolia Currently, the Shargaljuut hot spring in Bayankhongor province and the Khujirt hot spring in Uvurkhangai province are used for heating purposes. Page 40
49 4. DEVELOPMENT OF CONCENTRATING SOLAR THERMAL POWER PLANT 4.1. Brief history of CSP technology One of the technologies used for converting solar energy into electricity energy is concentrating solar thermal (CSP) technology. This technology produces thermal and electrical energy by concentrating solar beam radiation using parabolic mirrors or heliostats. Lovegrove and Stein (2012) mention that the concept of concentrating solar energy has been considered as an interesting technology for a long time period. For example, the idea of mirrored panels to concentrate the sunlight is found in documents written by Archimedes in around 200 BC (Lovegrove and Stein 2012). According to Greenpeace (2005), efforts to invent devices for converting solar energy started around 1800s. Auguste Mouchout invented a solar powered motor producing steam in the 1860s. Dr. Maier and Mr. Remshalden obtained a patent in 1907 by their invention of a parabolic trough-shaped collector (Lovegrove and Stein 2012, Greenpeace 2005). Frank Schuman s 45 kw parabolic troughs driven pumping system was constructed in Egypt in 1913 and this invention was considered the first successful device for converting solar energy into usable energy (Lovegrove and Stein 2012). A number of industrialised countries such as the United States, Russia, Japan, Spain and Italy carried out more detailed research and development work in this sector. As a result of these activities, the basic design of the CSP technology was developed in the late 1970s and the beginning of the 1980s. The research and development work has been focused on Page 41
50 technology improvements and cost reductions since the basic designs of CSP technology were developed (Greenpeace 2005). LUZ International company constructed a series of parabolic trough power stations in the Californian Mojave Desert between 1984 and 1991 based on the technological improvement achieved through their R&D work. The CSP power stations consist of nine separate parabolic trough based Solar Electric Generating Stations (SEGS) with 14 MW 80 MW capacity, with a total installed capacity of 354MW (Greenpeace 2005). As CSP technologies are relatively new technologies, the future challenge of R&D on CSP technology is to decrease the required initial investment costs and electricity generating costs through technology improvements and widespread implementation (Lovegrove and Stein 2012). In addition, the utilization of renewable energy has grown quickly due to climate change issues related to the conventional power plants. Therefore, Lovegrove and Stein (2012) noted that utilization of CSP technologies has grown dramatically since 2005 because CSP technologies can not only cut quickly large amounts of greenhouse gas emissions, but also have significant advantages for generating electricity during times without sunlight through the use of thermal energy storage systems CSP technology Today, there are four main types of solar concentrating power technologies; parabolic trough, linear Fresnel reflectors, central receiver or tower, and parabolic dish. These technologies are different from each other in terms of the focus and the receiver types (IEA 2010). The main classification of CSP technology is shown in Figure 4.1 Page 42

51 Source: IEA 2010 Figure 4.1. The classification of CSP technology Each type of CSP technology has its own benefits and drawbacks related to technical characteristics and working principle. Thus, these four types of CSP technology are discussed in more detail below Parabolic trough Parabolic trough technology consists of arrays of parabolic trough shaped mirror reflectors and receiver tubes placed in the trough s focal line. The general views of the parabolic trough and the parabolic trough CSP system are shown in Figure 4.2. Page 43

52 Source: IEA 2010, and Mendelsohn et al Figure 4.2. The general view of parabolic trough and CSP system Since mirror reflectors are curved, the reflected solar radiation from the mirror reflectors is concentrated on the receiver tubes. Consequently, the heat transfer fluid which flows inside the tube absorbs the heat produced by concentrated solar radiation and the temperature of the heat transfer fluid is heated up to C. The heat of the hot fluid is used to produce steam through a heat exchanger and cold fluid is pumped back to the receiver tubes. Steam is converted to electrical energy in a conventional steam turbine generator (Greenpeace 2005, IEA 2010). The working temperature of a parabolic trough system is dependent on the heat transfer fluid s physical characteristics. In practice, synthetic thermal oil and molten salt are used commonly as a heat transfer fluid. The main advantages of molten salt compared to synthetic thermal oils are lower specific costs, higher heat capacity and potentially higher working temperature (Lovegrove and Stein 2012). Page 44

53 Central Receiver or Solar Tower Central receiver technology consists of a number of mirrors called heliostats with a dual axis tracking system and a central receiver positioned on top of a tower. General views of the Cental receiver technology and CSP systems are shown in the Figure 4.3. Source: IEA 2010, and Mendelsohn et al Figure 4.3. The general view of Central Receiver and CSP system The reflected solar radiation from a circular array of heliostats is concentrated onto the central receiver. The heat transfer fluid in the central receiver is warmed by absorbing the concentrated solar radiation. The working temperature of a central receiver system ranges up to 1000 o C or over and it is dependent on the selection of the heat transfer medium. Today, water/steam, molten salt, liquid sodium and air are used as heat transfer fluids and are heated up to 1000 o C or over. This heat transfer fluid can be used to produce steam or, if it is air, to replace natural gas in a gas turbine cycle (Greenpeace 2005). Since the working temperature of central Page 45

54 receiver technology is very high, the efficiency of this technology is relatively high in comparison with other CSP technologies Linear Fresnel Reflector Linear Fresnel reflector systems consist of flat or slightly curved thin mirrors and receiver tubes. General views of the linear Fresnel reflectors and systems are shown in Figure 4.4. Source: IEA 2010, and Mendelsohn et al Figure 4.4. The general view of Linear Fresnel reflector and system The reflected solar radiation from the flat mirror is concentrated on the fixed receiver tubes. Although this technology is quite similar to the parabolic trough and relatively simple in design, the efficiency of this system is relatively low. Development of this technology is still in the R&D stages (IEA 2010) Parabolic Dish A Parabolic dish is a dish-shaped concentrator that reflects solar beam radiation on to a receiver positioned at the focal point of the dish. The heated fluid in the Page 46
. The basic scheme of parabolic dish is shown in Figure 4.")
55 receiver is used to generate electricity. A Parabolic dish system generates electricity energy by a small piston or Stirling engine. The main components of the parabolic dish system are the parabolic reflector, receiver and a Stirling motor or small piston (Greenpeace 2005). The basic scheme of parabolic dish is shown in Figure 4.5. Source: Mendelsohn et al Figure 4.5. The basic scheme of parabolic dish 4.3. Thermal energy storage One of the main advantages of CSP technology is that CSP can store thermal energy for short periods of time by using thermal energy storage systems. By storing thermal energy, not only the availability and capacity factor of the system are increased, but also the flexibility of the system is improved. Solid salt, two-tank molten salt, thermocline, solid material, and pressured saturated water are used as a heat transfer medium in thermal energy storage Page 47

56 systems. Today, the two-tank molten salt scheme is considered the most proven technology for thermal energy storage systems. For example, the parabolic trough based Andasol 1 CSP has a two-tank thermal energy storage system consisting of an oil-salt heat exchanger, cold and hot storage tanks and two circulation pumps. A process flow diagram of Andasol 1 CSP project is shown in Figure 4.6. Source: Greenpeace 2005 Figure 4.6. Process flow diagram of Andasol 1 CSP During the sunny days, the heat energy absorbed by the heat transfer oil is transferred to molten salt pumped from a cold tank through the oil-heat exchanger. Then, this heated molten salt is stored in a hot tank. In the evening or cloudy days, the molten salt stored in the hot tank is pumped to the heat exchanger, and transfers its heat to the oil. Hot oil is then used to produce steam for power conversion system and the cooled molten salt is stored in the cold tank (Greenpeace 2005). Page 48
57 4.4. Comparison of CSP technologies Each of these four types of CSP technologies has its own characteristics, advantages and disadvantages. The comparison of these four types of technologies is shown in Table 4.1. Table Comparison of CSP technologies Parameter Parabolic Trough Central Linear Fresnel Parabolic Receiver Refelctor Dish Capacity, MW Technology development Commercially Pilot Pilot projects Demonstration stage proven commercial project projects Technology development Low Medium Medium Medium risk Operating temperature, O C Maximum efficiency, % Annual efficiency for solar to electricity,% Capacity factor,% (with TES) (with 10h TES) Collector concentration suns > 1000 suns >60 suns > 1300 suns Receiver/absorber Absorber attached to collector, moves with collector Fixed absorber Thermal energy storage systems (TES) Indirect two-tank molten salt at 380 O C or direct two-tank molten salt at 550 O C External surface or cavity receiver, fixed direct two-tank molten salt at 550 O C Short-term pressured steam storage (<10min) Absorber attached to collector, moves with collector No storage Hybridisation Yes and direct Yes Yes, direct Not planned Grid Stability Medium to high (with TES or hybridisation) High (with large TES) Medium (with back-up firing) Low Power Conversion Cycle Superheated Rankine steam cycle Superheated Rankine steam cycle Saturated Rankine steam cycle Steam Temperature O C Steam Pressure, bar Water Consumption, 3 (wet cooling) 2-3 (wet m 3 /MWh 0.3 (dry cooling) cooling) 0.25 (dry cooling) 3 (wet cooling) 0.2 (dry cooling) Stirling engine (mirror washing) Application type On-grid On-grid On-grid On-grid/Off grid Source: IRENA 2012 Page 49
58 From Table 4.1, it is clear that CSP technologies are different from each other not only in terms of technical and economic aspects, but also in terms of reliability, the stage of development, and other operational parameters (IRENA 2012). Based on this comparison of CSP technologies, the parabolic trough and central receiver technologies are quite mature and commercially proven technology compared to the other CSP technologies Current situation and future prospects of CSP technologies As mentioned in section 4.1, LUZ International company constructed the SEGS in the Mohave Desert of California between 1984 and Although no other CSP plants were constructed from 1991 to 2006, the following CSP plants have been built between 2006 and 2007 (IRENA 2012): 1 MW CSP plant in Arizone in MW solar tower plant PS 10 in Spain in MW CSP plant in Nevada in The utilization of CSP technology has grown dramatically since For example, MW of CSP plants were installed in 2012 and the total installed capacity of CSP plant in the world has reached 2553MW at the end of 2012 (CSP World 2013). See Figure 4.7 for more details on the growth of installed capacity in CSP.. Page 50

59 Source: CSP World 2013 Figure 4.7. The cumulative installed capacity of CSP Currently, a number of CSP plants are under construction in USA, Spain, Algeria, Egypt, Morocco, Australia, China, India, Iran, Israel, Italy, Jordan, Mexico and South Africa (IRENA 2012). USA and Spain are the leading countries in utilization of CSP plants. These two countries have approximately 90% of the total installed capacity of CSP plants. According to IRENA (2012), the main driving force for CSP development in USA are tax incentives and renewable portfolio standards, while an attractive feed-in tariff is the main driver in Spain. A.T.Kearney and ESTELA (2010) projected that the installed CSP capacity will reach 12GW in 2015 and 60GW by 2025 (see Figure 4.8). Page 51

60 Source: A.T. Kearney and ESTELA 2010 Figure 4.8. CSP capacity forecast According to the estimation of A.T.Kearney and ESTELA (2010), parabolic trough technology will remain the dominant CSP technology. They projected that parabolic trough technology will comprise more than 50% of the total installed capacity by In addition, central receiver technology is expected to share more than 30%, while total shares of both Linear Fresnel reflectors and parabolic dish will be between 10 and 20% (IRENA 2012). In addition, one of the main factors affecting the utilization of CSP technology is the cost of the electricity generated. Currently, the electricity generation costs of CSP technologies are significantly higher than conventional power plant costs. According to one IEA study (2010), for example, the current electricity costs of CSP technology range from 0.19$/kWh to 0.25$/kWh. The levelised costs of Page 52
61 electricity energy (LCOE) for existing and proposed CSP plants are shown in Figure 4.9. Source: IRENA 2012 Figure The LCOE of existing and proposed CSP projects From Figure 4.9, the LCOE decreased almost 50% between 1980 and Moreover, A.T.Kearney and ESTELA (2010) noted that there are huge possibilities for reducing costs of CSP technology. According to their estimation, the tariff will be decreased by 40-55% by 2025 due to deployment of new technologies, economies of scale, efficiency improvements and cost reductions (see Figure 4.10). Page 53

62 Source: A.T.Kearney and ESTELA 2010 Figure The expected tariff development The main potential technological and efficiency improvement measures and potential cost reduction percentages are shown in Figure 4.11, 4.12 respectively. Page 54


63 Source: A.T.Kearney and ESTELA 2010 Figure Overview on main technological/efficiency improvement measures Source: A.T.Kearney and ESTELA 2010 Figure Cost reduction forecast Page 55
.")
64 As a result of technological and efficiency improvement measures and cost reduction on capital cost, the LCOE will be decreased and CSP technologies will be competitive with conventional power plants in terms of LCOE by 2015 (Kearney and ESTELA 2010). The forecast of cost comparison between dispatchable CSP (ie CSP systems with significant thermal storage) and conventional power plants is shown in Figure 4.13 (Kearney and ESTELA 2010). Source: A.T.Kearney and ESTELA 2010 Figure Cost comparison of dispatchable CSP vs conventional plants Page 56

65 5. FEASIBILITY TO CONSTRUCT CSP PLANT IN MONGOLIA 5.1. General There is a necessity to built new power plants in the Gobi region of Mongolia based on the findings of the study on demand and supply of the CES presented earlier. Thus, the Mongolian Government has carried out a lot of research for constructing large scale coal fired power plants at Tavan Tolgoi and Oyu Tolgoi for supplying the expected demand due to mining activities. On the other hand, the utilizations of renewable energy sources have been increased due to climate change, greenhouse gas effects and other negative impacts caused by conventional power plants. According to Solar Millennium AG (2008), the Gobi region of Mongolia is considered as a good area for constructing CSP plants. Figure 5.1 shows the most promising areas for constructing CSP plants. Source: Solar Millennium AG, Erlangen Figure Most potential areas for constructing CSPs Page 57
66 Since the Gobi region of Mongolia has a quite good solar resource and it is considered a good place for constructing CSP plants, it is possible to construct CSP plant in the Gobi region for supplying a certain part of the expected power demand of the major mining activities in Southern Mongolia Solar Resource Assessment of the proposed site Site selection In order to select a suitable site for CSP plants, it is necessary to consider a number of factors such as technical, environmental and economical perspectives. According to Cohen and others (2005), the following factors should be considered for selecting a site for CSP technology: Solar resource: Direct Incidence radiation > 1800kWh/m 2 per annual; Land requirement factors: o Area: m 2 per MW of electricity generation o Site topography: flat, slope should be less than 3% o Land cover: limited agriculture value Infrastructure: Proximity to transmission lines, auto and rail transportation Water supply: o Adequate water supply: wet cooling system o Not adequate water supply: dry cooling system The site selection for this study is done by considering the above mentioned factors and proximity to the mining activities in the Southern part of Mongolia. The location of the proposed site is shown in Figure 5.2. Page 58

67 Figure The proposed site for constructing CSP in Mongolia Solar Resource The solar resource is the most important factor for constructing CSP plants and solar beam radiation should be more than 1800 kw/m 2 per annual. The solar resource atlas of Mongolia is shown in Figure 5.3. Page 59

68 Source: Batdelger 2010 Figure 5.3. Solar resource atlas of Mongolia From Figure 5.3, the proposed site is located in an area with solar radiation between 1970 kwh/m 2 and 2100 kwh/m 2. However, this information is not enough information for assessing the solar resource of the site. In addition, this site is located 144 km from the nearest meteorological centre and there are no exact meteorological data for the site. Therefore, NASA data and Meteonorm 7 software are used for assessing the solar resources of the selected site. Direct normal radiation data obtained from NASA website is shown in Table 5.1 (please see the detailed data from the Appendix 1). Page 60


69 Table Direct Normal Radiation at the proposed site and its variability, NASA data Source: NASA website From Table 5.1, monthly averaged direct normal radiation of the site was 6.47 kwh/m 2 per day or 2361 kwh/m 2 per year. The clearness index ranges from 0.54 to Figure 5.4 shows the seasonal changes of the direct normal radiation and clearness index of the selected site. Figure 5.4. The seasonal changes of the DNI and clearness index The data obtained from the Meteonorm 7 software is shown in Figure 5.5. Page 61
, it is possible to evaluate that the selected site has quite good solar resources and this site is suitable for constructing a CSP plant. 5.3.")
70 Figure 5.5. The solar radiation data, Meteonorm 7 As annual average direct normal radiation is 6.47 kwh/m 2 per day or 2300kWh/m 2 per year and average clearness index is 0.66 (it ranges from 0.54 to 0.66), it is possible to evaluate that the selected site has quite good solar resources and this site is suitable for constructing a CSP plant Technical and Economic model for evaluating CSP According to the findings of this study on CSP technologies, parabolic trough and central receiver technologies are quite mature and commercially proven technologies compared to the other CSP technologies. Therefore, economic analysis is done on both of these two technologies in order to determine the best technology for the Gobi desert of Mongolia. RETScreen and Solar Adviser Module (SAM), pre-feasibility economic analysis software packages, are used to carry out technical and economic analyses. In order to evaluate the outcomes of the Page 62
71 analysis of both parabolic trough and solar tower technology, technical and economic analysis is based on 50MW CSP plants RETScreen software The RETScreen International Clean Energy Project Analysis Software developed by Natural Resource Canada is used to evaluate the energy production, life-cycle costs, greenhouse gas emissions reductions and sensitivity analysis for various types of renewable energy technologies. This software consists of the following five stages of analysis; energy model, cost analysis, greenhouse gas analysis, financial summary, and sensitivity and risk analysis (NRCAN 2005). RETScreen software can be used for evaluating solar thermal power technologies such as parabolic troughs, central receivers and parabolic dish. However, as commercial CSP technology has only been started since 2006, RETScreen analysis on CSP technology has not been well developed. CSP technology analysis in the RETScreen software is very simple. The Energy model in RETScreen for evaluating the CSP technology is shown Figure 5.6. Page 63

72 Figure 5.6. RETScreen energy model for CSP From Figure 5.6, it is clear that power capacity, capacity factor and electricity export price are the main inputs of this analysis apart from climate data. These inputs are very simple and there are no options tor including other technical inputs for determining the heat transfer fluid, thermal energy storage options and other significant factors in RETScreen. Therefore, it is difficult to evaluate the CSP technologies by their technical and economical characteristics based on outcomes of RETScreen software System Advisor Model One of the software packages for performing preliminary analysis of CSP plant is the System Advisor Model (SAM). SAM, developed by NREL, is a technical and economic evaluation model for renewable energy systems and projects. It is used to determine the expected performance, levelised costs of electricity energy and financial parameters of the renewable energy technologies such as PV, CSP, solar water heating, wind power, geothermal and biomass. In terms of CSP technology, SAM can be used to evaluate the parabolic trough (physical and empirical model), Page 64
73 solar tower (molten salt or direct steam), linear Fresnel, and Dish Stirling technologies (NREL, 2013). In addition, SAM includes several databases of climate data, performance data and coefficients for system components of CSP technologies. Also, the user can create their own climate data file or download this from NREL websites (NREL 2013) Technical and Economic analysis of CSP technologies Parabolic trough CSP Main assumptions: The main assumptions for evaluating parabolic trough CSP in SAM software are the capacity of proposed plant, technical characteristics of system components such as solar multiple, thermal energy storage s full load hour, and financial parameters such as capital costs, financing structure, loan and loan interest. The SAM software package and the supporting material provide a lot of databases for analysing CSP systems. In this analysis some typical component and system variables are used for the proposed 50 MW CSP system. The main assumptions and selection of components used in the SAM analysis are discussed below: Solar multiple: It is a ratio of the actual size of a CSP plant s solar field compared to the field size required to feed the turbine. The multiple can be varied from 1 to 5. For example, it ranges from 1.1 to 1.5 in CSP plants without thermal energy storage, while it varies from 2 to 5 in CSP plants with thermal energy storage in order to having capability to generate sufficient energy for the thermal energy storage system. In this calculation, the solar multiple is assumed equal to 2. Collector type: Solargenix SGX-1 Page 65
74 Receiver: Schott PTR Power Cycle: o Capacity 55 MWe, net conversion factor 0.9, net output 50MWe o Rated cycle conversion efficiency: Thermal energy storage capacity: This parameter refers to the total amount of energy that can be stored. Today, full load hours of thermal energy storage systems range from 1 to 6 hours in parabolic trough CSP. In order to determine the optimal capacity of thermal energy storage system, a sensitivity analysis is done within SAM with the full load hours of storage ranging from 0 to 6 hours. System costs: The total installed cost of 50 MW parabolic troughs CSP with 2 hour thermal energy storage is US$235.3m and unit capital cost is US$4701/kW in the base case. The breakdown of the capital cost is shown in Figure 5.7. Financial assumptions: o Analysis period 25 years o Solution mode: Specify IRR target o Financing: Equity 50%, Loan 50% o Inflation rate 2.5% o Discount rate 8.2% Page 66
 Economic Analysis and Results: Based on the findings of the sensitivity analysis")
75 Figure 5.7. The breakdown of the capital costs assumption (Parabolic Troughs) Economic Analysis and Results: Based on the findings of the sensitivity analysis with respect to storage capacity, the plot of real LCOE versus full load hours of thermal energy storage is shown in Figure 5.8. Page 67

76 Figure 5.8. Plot Real LCOE vs Full load hours of TES From Figure 5.8, 50 MW parabolic trough CSPs with a 2h thermal energy storage system has the minimum LCOE in comparison with other cases. Therefore, a 50MW parabolic trough CSP with a 2h thermal energy storage system is considered an optimal design for a parabolic trough CSP in this situation. The main results from the economic analysis of this 50MW parabolic trough CSP with 2h thermal energy storage system are shown in Table 5.3. Table 5.2. The main results of the economic analysis (Parabolic Troughs) No. Parameter Unit Amount 1. Annual Energy GWH Capital cost million $ Unit Capital cost $/kw PPA price /kwh LCOE Nominal /kwh LCOE Real /kwh Internal rate of return % NPV million $ Capacity factor % Gross to Net Conversion factor Annual water usage m Total Land Area acres Please see the detailed calculations and results in Appendix 2. Page 68
77 Solar Tower CSP Main assumptions: The main assumptions for evaluating a 50 MW molten salt solar tower CSP in the SAM software are the capacity of proposed plant, technical characteristics of the system components such as solar multiple, thermal energy storage s full load hour capacity, and financial parameters such as capital costs, financing structure, loan and loan interest. The main assumptions and selection of components used in SAM are discussed in below: Solar multiple: It is the ratio of the actual size of a CSP plant s solar field compared to the field size required to feed the turbine. The multiple can be varied from 1 to 5. For example, it ranges from 1.1 to 1.5 in CSP plants without thermal energy storage, while it varies from 2 to 5 in CSP plants with thermal energy storage in order to have the capability to generate sufficient energy for the thermal energy storage system. In this calculation, the solar multiple is assumed equal to 2. Heliostats: width 20m, height 20m Receiver: External Receiver, Tower Height 190 m Power Cycle: o Capacity 55 MWe, net conversion factor 0.91, net output 50MWe o Rated cycle conversion efficiency: Thermal energy storage capacity: This parameter refers the total amount of energy that can be stored in storage systems. Today, full load hours of thermal energy storage system ranges from 1 to 10 hours in solar tower CSP. In order to determine the optimal capacity of the thermal energy Page 69
78 storage system, a sensitivity analysis is done within SAM with the full load hours ranging from 0 to 10 hours. The 0 means that there is no thermal energy storage system. System costs: The total installed cost of 50 MW parabolic troughs CSP with 3 hour thermal energy storage is US$446.8m and unit capital cost is US$8937/kW in the base case. The breakdown of the capital cost is shown in Figure 5.9. Financial assumptions: o Analysis period 25 years o Solution mode: Specify IRR target o Financing: Equity 50%, Loan 50% o Inflation rate 2.5% o Discount rate 8.2% Figure 5.9. The breakdown of the capital costs assumption (Solar Tower) Page 70

79 Economic Analysis and Results: Based on the findings of the parametric analysis, the plot of real LCOE versus full load hours of thermal energy storage is shown in Figure Figure Plot Real LCOE vs Full load hours of TES From Figure 5.10, the 50 MW solar tower CSP with 6h thermal energy storage has the minimum LCOE in comparison with other cases. Therefore, a 50MW solar tower CSP with a 6h thermal energy storage system is considered an optimal design for a central receiver CSP at the proposed site. The main results of the economic analysis of the 50MW solar tower CSP system with 6h thermal energy storage is shown in Table 5.3. Page 71
80 Table 5.3. The main results of the economic analysis (Solar Tower) No. Parameter Unit Amount 1. Annual Energy GWH Capital cost million $ Unit Capital cost $/kw PPA price /kwh LCOE Nominal /kwh LCOE Real /kwh Internal rate of return % NPV million $ Capacity factor % Gross to Net Conversion factor Annual water usage m Total Land Area Acres Please see the detailed calculations and results in Appendix Selection of the best technology for Mongolia By using the SAM software, technical and economic analyses were conducted on parabolic troughs and solar tower CSP technologies. According to the results of the economic analysis the following design of CSP technologies are considered as suitable options for the Gobi region of Mongolia: 50 MW parabolic trough CSP with 2h thermal energy storage 50 MW solar tower (molten salt) CSP with 6h thermal energy storage The most suitable technology is chosen from these two CSP technologies based on a comparison of technical and economic characteristics of these two technologies. The comparisons of the technical and economic parameters of these two technologies are shown in Table 5.4 and 5.5 respectively. Page 72
81 Table 5.4. Technical characteristics of CSP technologies Parameter Parabolic Troughs CSP Parameter Solar Tower CSP Rated Output 50MW Rated Output 50MW Heat Transfer Fluid Terminal VP -1 Heat Transfer Fluid Molten salt (60%NaNO 3 40% KNO 3 ) Max. Operating 400 O Max. Operating C temperature temperature 574 O C Number of loops 114 Heliostats 2151 Aperture area m 2 Heliostats area m 2 Collectors Solargenix SGX-1 Tower height 190 m Receiver Schott PTR TES capacity 6 hours TES capacity 2 hours Table 5.5. Comparison of CSP technologies by economic parameters Parameters Unit Parabolic Solar Tower Difference Troughs CSP CSP PT-ST Percent Annual Energy GWh % Capital cost million $ % Unit Capital cost $/kw % PPA price /kwh % LCOE Nominal /kwh % LCOE Real /kwh % Internal rate of return % % NPV million $ % Capacity factor % % Gross to Net Conversion factor % Annual water usage m % Total Land Area acres % From Table 5.5, it is clear that: The initial capital cost of the parabolic trough system is lower than that of the solar tower system by US$211.5m; The unit capital cost of the parabolic trough system is 4701 $/kw which is almost half that of the solar tower option; According to the Renewable Energy Law of Mongolia, the electricity price generated by solar power sources should be /kwh for grid connected power plants, /kwh for off-grid power plants. The expected PPA price of parabolic troughs CSP is /kwh, while it is /kwh in solar tower CSP. Page 73
82 The Levelised cost of electricity of the parabolic trough CSP is /kwh, while it is /kwh for the solar tower CSP system. In terms of water consumption, water consumption of the parabolic trough system is 32,016m 3 per year which is lower than the water consumption of the solar tower system by 15,805 m 3. As a result of this analysis, a 50MW parabolic trough CSP with 2 hours thermal energy storage is considered the best option for the Gobi desert of Mongolia. Page 74
83 6. DRIVERS AND BARRIERS FOR CONSTRUCTING CSP IN MONGOLIA 6.1. Drivers Based on the findings of literature reviews and case studies of countries which are utilizing solar thermal power plants, the following factors are considered as key drivers for implementing CSP projects in Gobi region of Mongolia. Renewable Energy Resource: Mongolia has a good solar resource, particularly in the Gobi region. For example, about 266,900 km 2 land or 17 % percent of the land area of Mongolia has abundant solar resource and the average annual solar radiation of these areas is more than 1600 kwh/m 2 per year (NREC 1985). Renewable Energy Legality and Policy: The Mongolian National Renewable Energy program and Law on Renewable Energy enacted by the Mongolian Parliament in 2005 and 2007 respectively are positive drivers. The main objectives of these legal documents are to ensure the increase of renewable energy utilization in Mongolia and regulate generation and supply of energy utilizing renewable energy sources. In addition, the main principles of the government incentive policies for encouraging the utilisations of renewable energy are determined clearly. Moreover, the Mongolian Government set a renewable energy target that 20-25% of total electricity consumption should be supplied from renewable energy sources by 2020 (Batbayar 2010). Having a clear policy on renewable energy is a key driver for encouraging domestic and foreign investors (Cutt 2010). Page 75
84 Expected New Demand and Necessity of power sources. Mongolia has huge mineral resources and a number of large scale coking coal and copper mining sites are located in the Gobi region of Mongolia. The expected power demand of these mining activities is projected to be about 650 MW. Due to infrastructure development, the Gobi region of Mongolia has no large scale power plants and transmission lines for supplying this expected demand. Therefore, there is the necessity to build power plants and transmission lines in the Gobi region of Mongolia, particularly in Umnugobi aimag. Cost reduction of CSP technology in near future: According to the estimations of A.T.Kearney and ESTALA (2010), the capital costs and electricity generation costs of CSP technologies are expected to reduce about 20% in 2015, and about 40% by If this occurs, CSP technologies will be competitive with conventional power plants in terms of levelised cost of electricity. Environmental friendly technology: Since CSP technologies are environmental friendly technology, the utilization of CSP technology has huge benefits in reducing greenhouse gas emissions Barriers and its mitigation measures The main barriers for constructing CSP technology in the Gobi region of Mongolia are identified as the following, based on the findings of literature reviews and case studies of countries which utilize solar thermal power plants: High Initial cost. Constructing parabolic trough CSP plant in Mongolia requires large amounts of up-front capital cost. However, there are future Page 76
85 potential cost reductions in CSP technologies, which is still a young technology (Hang et al. 2008). Qu Hang and others (2007) suggest that governments can encourage the utilization of CSP plants by their incentive policies such as tax incentives and price regulation on renewable energy sources. By implementing these incentives, CSP plants are becoming more profitable in the near future (Hang et al. 2008). In addition, there is a good opportunity for developing countries to get financial support from industrialised countries for implementing renewable energy sources through the Clean Development Mechanism formulated in the Kyoto Protocol (Hang et al. 2008). Lack of experienced workers in renewable energy sector: Although the utilisation of renewable energy sources has been occurring in Mongolia since the 1980s, there is still a lack of experienced workers in the renewable energy sector. Therefore, it is necessary to prepare professional workers for operating not only CSP technologies, but also other renewable energy technologies. There are possibilities to prepare such professional workers by vocational training offered by TAFE colleges and universities. Page 77
86 7. CONCLUSIONS AND RECOMMENDATIONS In summary, the possibility of constructing CSP plants in the Gobi region of Mongolia has been studied in this dissertation. In addition, the drivers and barriers for implementing CSP technologies were identified within this thesis. According to the findings of the studies done in this dissertation, a 50 MW parabolic trough CSP with 2hours thermal energy storage is considered the most suitable option in the Gobi region of Mongolia in terms of its technical maturity and economic characteristics when compared with other CSP technologies. As a result of the economic analysis, the net present value of the 50 MW parabolic trough CSP was US$21.0 million, the internal return was 15%, and the expected power purchasing price was 20.30ȼ/kWh. These parameters confirm that the 50MW parabolic trough CSP option is a feasible option for successful implementation in the Gobi region of Mongolia. Implementation of CSP technology in Mongolia has big benefits for not only supplying the expected demand of mining activities in the Gobi region, but also mitigating against climate change. In addition, it is possible to recommend that the identified drivers, barriers, and mitigation measures for dealing with barriers should be considered in future research and implementation of CSP plants in Gobi region of Mongolia. Future research could focus on identifying the possible improvements and regulations in Mongolian renewable energy policy and government incentives for encouraging the utilization of CSP technologies. In addition, development of the manufacturing sector of renewable energy equipment in Mongolia will be an Page 78
87 important factor for utilizing renewable energy power sources in Mongolia. Thus, this issue will be considered within the future research. Page 79
88 REFERENCES Andy, Cutt "Is China Winning the Renewable Energy race?" Mas. diss., Murdoch University. Asian Development Bank Mongolia: Country Report. UB: ADB. Atmospheric Science Data Center of NASA Atmospheric Science Data Center. Batbayar Ch Current Situation of Renewable Energy and its Future principles. In Proceedings of the Energy Efficiency UB: Ministry of Mineral Resource and Energy. Batdelger D., Solar Resource Atlas of Mongolia. Phd. Diss., Mongolian University of Science and Technology. Cohen G., Skowronski M., and Cable R Solar thermal parabolic trough electric power plants for electric utilities in California; Los Angeles: Solargenix Energy CSP World CSP 2012, a review. Electrowatt-Ekono Mongolian Energy Master Plan. UB:MCS International Elliott D., Schwartz M., Scott G., Haymes S., Heimiller D., and George R Wind Energy Resources Atlas of Mongolia. Page 80
89 Energy Regulatory Commission Annual Report Energy Regulatory Commission Energy Statistics UB:Munkhiin Useg printing Greenpeace Concentrated Solar Thermal Power Now. Amsterdam: Greenpeace. Hang, Q., Zhao Jun, Yu Xiao and Cui Junkui Prospect of Concentrating Solar Power in China- The Sustainable Future. Renewable and Sustaibnable Energy Reviews 12: International Energy Agency Technology Roadmap: Concentrating Solar Power. IRENA Renewable Energy Technologies: Cost Analysis Series. Concentrating Solar Power. ost_analysis-csp.pdf Kearney A.T, ESTELA Solar Thermal Electricity 2025: Clean Electricity on Demand: Attractive STE Cost Energy Production. Belgium: ESTELA. Keith Lovegrove and Wes Stein. eds Concentrating Solar Power Technology: Principles, Developments and Applications. Oxford: Woodhead Publishing Limited. Page 81
90 Michael Mendelsohn, Travis Lowder, and Brendan Canavan (NREL) Technical Report. Utility-Scale Concentrating Solar Power and Photovoltaics Projects: A Technology and Market Overview. Ministry of Mineral Resources and Energy of Mongolia Current Situation of Mongolian Energy Systems. UB: MMRE. Mongolbank Mongolbank. Mongolia. Ministry of Mineral Resources and Energy National Renewable Energy Program. UB: MMRE Mongolian Society for Range Management Livelihood Study of Herders in Mongloia.UB: Selengepress. National Dispatching Centre CES Energy Balance 2012: Demand and Supply. UB: NDC. National Statistic Office Mongolian Statistical Yearbook UB: NSO. National Statistic Office Monthly Bulletin of Statistics: December UB: NSO. National Renewable Energy Centre of Mongolia Solar Resource of Mongolia. UB:NREC. National Renewable Energy Laboratory System Advisor Model. Page 82
91 Nature Resources Canada Clean Energy Project Analysis: RETScreen Engineering and Cases Textbook.3 rd eds. Newcom Group Newcom Group. Qleantech LLC.2013.Qleantech LLC. Solar Millennium AG The Parabolic Trough Power Plants Andasol 1 to 3. innogy/sites/solar-power/andasol-3/facts-figures/further-information-about- Andasol.pdf World Bank Southern Mongolia Infrastructure Strategy. Page 83
92 APPENDIX Appendix 1. Solar Radiation Data for the selected site obtained from NASA website. Appendix 2. Technical and Economical Analysis of 50 MW parabolic trough CSP Appendix 3. Technical and Economical Analysis of 50 MW molten salt solar tower CSP Page 84
93 APPENDIX 1. Solar Radiation Data for the selected site obtained from NASA website. NASA Surface meteorology and Solar Energy - Available Tables Latitude 43 / Longitude 106 was chosen. Geometry Information Western boundary 106 Northern boundary 44 Center Latitude 43.5 Longitude Southern boundary 43 Elevation: 1236 meters taken from the NASA GEOS-4 model elevation Eastern boundary 107 Parameters for Sizing and Pointing of Solar Panels and for Solar Thermal Applications: Monthly Averaged Insolation Incident On A Horizontal Surface (kwh/m 2 /day) Lat 43 Lon 106 Jan Feb Mar Apr May Jun Jul Aug Sep Oct Nov Dec Annual Average 22-year Average Minimum And Maximum Difference From Monthly Averaged Insolation (%) Lat 43 Jan Feb Mar Apr May Jun Jul Aug Sep Oct Nov Dec Lon 106 Minimum Maximum Page 85
94 Monthly Averaged Diffuse Radiation Incident On A Horizontal Surface (kwh/m 2 /day) Lat 43 Lon 106 Jan Feb Mar Apr May Jun Jul Aug Sep Oct Nov Dec Annual Average 22-year Average Minimum Maximum year Average K Minimum K Maximum K Lat 43 Lon year Average Monthly Averaged Direct Normal Radiation (kwh/m 2 /day) Jan Feb Mar Apr May Jun Jul Aug Sep Oct Nov Dec Annual Average Minimum And Maximum Difference From Monthly Averaged Direct Normal Radiation (%) Lat 43 Jan Feb Mar Apr May Jun Jul Aug Sep Oct Nov Dec Lon 106 Minimum Maximum Monthly Averaged Insolation Incident On A Horizontal Surface At Indicated GMT Times (kw/m 2 ) Lat 43 Lon 106 Jan Feb Mar Apr May Jun Jul Aug Sep Oct Nov Dec Average@ Average@ Average@ Average@ Average@12 n/a n/a n/a Average@15 n/a n/a n/a n/a n/a n/a n/a n/a n/a n/a n/a n/a Average@18 n/a n/a n/a n/a n/a n/a n/a n/a n/a n/a n/a n/a Average@21 n/a n/a n/a n/a n/a n/a Lat 43 Lon year Average K Minimum K Maximum K Monthly Averaged Insolation Clearness Index (0 to 1.0) Jan Feb Mar Apr May Jun Jul Aug Sep Oct Nov Dec Annual Average Page 86
95 Lat 43 Lon year Average Monthly Averaged Insolation Normalized Clearness Index (0 to 1.0) Jan Feb Mar Apr May Jun Jul Aug Sep Oct Nov Dec Monthly Averaged Clear Sky Insolation Incident On A Horizontal Surface (kwh/m 2 /day) Lat 43 Lon 106 Jan Feb Mar Apr May Jun Jul Aug Sep Oct Nov Dec Annual Average 22-year Average Lat 43 Lon year Average Monthly Averaged Clear Sky Insolation Clearness Index (0 to 1.0) Jan Feb Mar Apr May Jun Jul Aug Sep Oct Nov Dec Monthly Averaged Clear Sky Insolation Normalized Clearness Index (0 to 1.0) Lat 43 Lon 106 Jan Feb Mar Apr May Jun Jul Aug Sep Oct Nov Dec 22-year Average Lat 43 Lon year Averag e Monthly Averaged Downward Longwave Radiative Flux (kwh/m 2 /day) Jan Feb Mar Apr Ma Jun Jul Au Sep Oct No Dec y g v Annual Averag e 6.48 Solar Geometry: Monthly Averaged Solar Noon (GMT time) Lat 43 Lon 106 Jan Feb Mar Apr May Jun Jul Aug Sep Oct Nov Dec Average Monthly Averaged Daylight Hours (hours) Lat 43 Jan Feb Mar Apr May Jun Jul Aug Sep Oct Nov Dec Lon 106 Average Monthly Averaged Daylight Average Of Hourly Cosine Solar Zenith Angles (dimensionless) Lat 43 Jan Feb Mar Apr May Jun Jul Aug Sep Oct Nov Dec Lon 106 Average Page 87
96 Monthly Averaged Cosine Solar Zenith Angle At Mid-Time Between Sunrise And Solar Noon (dimensionless) Lat 43 Jan Feb Mar Apr May Jun Jul Aug Sep Oct Nov Dec Lon 106 Average Monthly Averaged Declination (degrees) Lat 43 Lon 106 Jan Feb Mar Apr May Jun Jul Aug Sep Oct Nov Dec Average Monthly Averaged Sunset Hour Angle (degrees) Lat 43 Jan Feb Mar Apr May Jun Jul Aug Sep Oct Nov Dec Lon 106 Average Monthly Averaged Maximum Solar Angle Relative To The Horizon (degrees) Lat 43 Jan Feb Mar Apr May Jun Jul Aug Sep Oct Nov Dec Lon 106 Average Monthly Averaged Hourly Solar Angles Relative To The Horizon (degrees) Lat 43 Jan Feb Mar Apr May Jun Jul Aug Sep Oct Nov Dec Lon GMT n/a n/a 0100 GMT GMT GMT GMT GMT GMT GMT GMT GMT GMT n/a n/a n/a 1100 GMT n/a n/a n/a n/a n/a n/a 1200 GMT n/a n/a n/a n/a n/a n/a n/a n/a n/a 1300 GMT n/a n/a n/a n/a n/a n/a n/a n/a n/a n/a n/a n/a 1400 GMT n/a n/a n/a n/a n/a n/a n/a n/a n/a n/a n/a n/a 1500 GMT n/a n/a n/a n/a n/a n/a n/a n/a n/a n/a n/a n/a 1600 GMT n/a n/a n/a n/a n/a n/a n/a n/a n/a n/a n/a n/a 1700 GMT n/a n/a n/a n/a n/a n/a n/a n/a n/a n/a n/a n/a 1800 GMT n/a n/a n/a n/a n/a n/a n/a n/a n/a n/a n/a n/a 1900 GMT n/a n/a n/a n/a n/a n/a n/a n/a n/a n/a n/a n/a 2000 GMT n/a n/a n/a n/a n/a n/a n/a n/a n/a n/a n/a n/a 2100 GMT n/a n/a n/a n/a n/a n/a n/a n/a n/a n/a n/a n/a 2200 GMT n/a n/a n/a n/a n/a n/a n/a n/a n/a 2300 GMT n/a n/a n/a n/a n/a n/a Page 88
97 Monthly Averaged Hourly Solar Azimuth Angles (degrees) Lat 43 Jan Feb Mar Apr May Jun Jul Aug Sep Oct Nov Dec Lon GMT n/a n/a 0100 GMT GMT GMT GMT GMT GMT GMT GMT GMT GMT n/a n/a n/a 1100 GMT n/a n/a n/a n/a n/a n/a 1200 GMT n/a n/a n/a n/a n/a n/a n/a n/a n/a 1300 GMT n/a n/a n/a n/a n/a n/a n/a n/a n/a n/a n/a n/a 1400 GMT n/a n/a n/a n/a n/a n/a n/a n/a n/a n/a n/a n/a 1500 GMT n/a n/a n/a n/a n/a n/a n/a n/a n/a n/a n/a n/a 1600 GMT n/a n/a n/a n/a n/a n/a n/a n/a n/a n/a n/a n/a 1700 GMT n/a n/a n/a n/a n/a n/a n/a n/a n/a n/a n/a n/a 1800 GMT n/a n/a n/a n/a n/a n/a n/a n/a n/a n/a n/a n/a 1900 GMT n/a n/a n/a n/a n/a n/a n/a n/a n/a n/a n/a n/a 2000 GMT n/a n/a n/a n/a n/a n/a n/a n/a n/a n/a n/a n/a 2100 GMT n/a n/a n/a n/a n/a n/a n/a n/a n/a n/a n/a n/a 2200 GMT n/a n/a n/a n/a n/a n/a n/a n/a n/a 2300 GMT n/a n/a n/a n/a n/a n/a Page 89

98 APPENDIX 2. Technical and Economical Analysis of 50 MW parabolic troughs CSP A. Main Report Page 90
99 Page 91

100 B. Detailed Data for calculation: 1. Solar Field Parameters Page 92
101 2. Collectors: 3. Receivers Page 93

102 4. Power Cycle Page 94

103 5. Thermal Storage 6. System Costs Page 95

104 7. Financing 8. Main Results Page 96


105 Page 97


106 Page 98

107 APPENDIX 3. Technical and Economical Analysis of 50 MW molten salt Solar Tower CSP A. Main Report Page 99

108 Page 100

109 B. Detailed Data for calculation: 1. Heliostat Field Parameters Page 101
110 2. Tower and Receiver: 3. Power Cycle Page 102
111 4. Thermal Storage Page 103
112 5. System Costs 6. Financing Page 104

113 7. Main Results Page 105


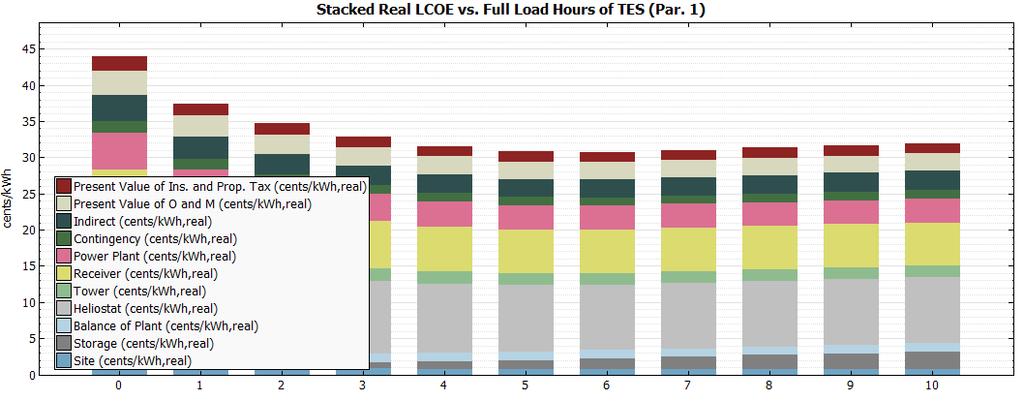
114 Page 106

115 Page 107