Riverside South Block 3/4, Richcraft Group of Companies Inc., City of Ottawa SERVICING REPORT
|
|
|
- Julian Carr
- 5 years ago
- Views:
Transcription
1 Riverside South Block 3/4, Richcraft Group of Companies Inc., City of Ottawa SERVICING REPORT Prepared by: Stantec Consulting Ltd Laperriere Avenue Ottawa, ON K1Z 7T1 File: /83 January 17, 2013
2 RIVERSIDE SOUTH BLOCK 3/4, RICHCRAFT GROUP OF COMPANIES INC., CITY OF OTTAWA Table of Contents 1.0 INTRODUCTION OBJECTIVE BACKGROUND EXISTING CONDITIONS POTABLE WATER ANALYSIS BACKGROUND ALLOWABLE PRESSURES GROUND ELEVATIONS EXISTING & PROPOSED WATERMAIN NETWORK BOUNDARY CONDITIONS WATER DEMAND HYDRAULIC MODEL RESULTS Average Day, Future Pressure Zone Configuration Peak Hour, Existing Pressure Zone Configuration Maximum Day + Fire Flow Results SUMMARY OF FINDINGS STORM DRAINAGE BACKGROUND Purpose CRITERIA AND CONSTRAINTS STORMWATER MANAGEMENT DESIGN Proposed Conditions Proposed Condition Hydrology Proposed Condition Hydraulic Grade Line Analysis SANITARY DRAINAGE SANITARY SEWER PROPOSED SANITARY SEWERS DESIGN CRITERIA GEOTECHNICAL CONSIDERATION GRADING AND DRAINAGE UTILITIES HYDRO ENBRIDGE GAS TELECOMMUNICATIONS EROSION AND SEDIMENT CONTROL DURING CONSTRUCTION CONCLUSION dt w:\active\ _riverside south_block 84\design\report\servicing\rpt_ _servicing_subm1_dct.docx ii
3 RIVERSIDE SOUTH BLOCK 3/4, RICHCRAFT GROUP OF COMPANIES INC., CITY OF OTTAWA Table of Contents 11.1 STORMWATER SERVICING SANITARY SERVICING WATER SERVICING GRADING UTILITIES APPENDIX A APPENDIX B APPENDIX C APPENDIX D APPENDIX E APPENDIX F Stormwater Management Calculations A1) Parameter Summary and Calculations A2) Input/ Output Files 5 Year, 3 hour Chicago Storm A3) Input/ Output Files 100 Year, 3 hour Chicago Storm A4) Input/ Output Files July 1 st, 1979 Historical Storm A5) Input/ Output Files 100 Year, 3 hour Chicago Storm Increased by 20% A6) 100 Year, 3hr Chicago XP-SWMM Modeling Parameters and Results A7) Storm Sewer Design Sheet A8) Catchbasin Capture Curves and V x d Calculations A9) DDSWMM Model Schematic & Methodology (JL Richards) Sanitary Sewer Design Sheet Potable Water Hydraulic Analysis Geotechnical Report Excerpts Background Report Excerpts Figures & Drawings SS-1 Site Servicing Plan GP-1 Grading Plan SD-1 Storm Drainage Plan SA-1 Sanitary Drainage Plan EC-1 Erosion Control Plan Other A CD containing SWM modeling files is inserted at the back of the report in Appendix F. dt w:\active\ _riverside south_block 84\design\report\servicing\rpt_ _servicing_subm1_dct.docx iii
4 RIVERSIDE SOUTH BLOCK 3/4, RICHCRAFT GROUP OF COMPANIES INC., CITY OF OTTAWA Table of Contents LIST OF TABLES AND FIGURES Figure 1-1: Key Plan Figure 4.1: Location of Proposed Development Figure 4.2: Location of Boundary Conditions Figure 4.3: Proposed Servicing Plan Figure 4.4: Ground Elevations (m) of Nodes Table 4.1: City of Ottawa Water Distribution Guidelines for Hazen-Willams "C" Coefficient Table 4.2: Existing Pressure Zone Configuration Boundary Conditions Table 4.3: Future Pressure Zone Configuration Boundary Conditions Table 4.4: Population and Demand Projections for Proposed Development Figure 4.5: Junction IDs Figure 4.6: Pipe IDs Table 4.5: Average Day Model Node Output Results, Future Zone Configuration Table 4.6: Average Day Model Pipe Output Results, Future Zone Configuration Table 4.7: Peak Hour Model Node Output Results, Existing Zone Configuration Table 4.8: Peak Hour Model Pipe Output Results, Existing Zone Configuration Table 4.13: Maximum Day Fire Flow Results, Existing Zone Configuration Table 5-1: RSC Block 3/4 Major and Minor System 5 Year Storm Results Table 5-2: RSC Block 3/4 Major and Minor System 100 Year Storm Results Table 5-3: Full Street and Half Street Rating Curve Comparison Table 5-4: 100 Year Flow Depth on Half Street Segments Table 5-5: Block 3/4 ICD Schedule Table 5-6: 100 Yr, 3hr Chicago Hydraulic Grade Line Results dt w:\active\ _riverside south_block 84\design\report\servicing\rpt_ _servicing_subm1_dct.docx iv

5 RIVERSIDE SOUTH BLOCK 3/4, RICHCRAFT GROUP OF COMPANIES INC., CITY OF OTTAWA Introduction January 17, Introduction This servicing brief is prepared in support of development of Riverside South Block 3/4 by the Richcraft Group of Companies Inc. The proposed development is located south of Earl Armstrong Road and immediately west of Spratt Road within the Riverside South community in the City of Ottawa (see Figure 1.1: Key Plan). The proposed development comprises approximately 1.62 ha of land and consists of residential development. An illustration of the site location is shown below: Figure 1-1: Key Plan dt w:\active\ _riverside south_block 84\design\report\servicing\rpt_ _servicing_subm1_dct.docx 1.1
6 RIVERSIDE SOUTH BLOCK 3/4, RICHCRAFT GROUP OF COMPANIES INC., CITY OF OTTAWA Introduction January 17, OBJECTIVE This Servicing Brief has been prepared to present a servicing scheme that is free of conflicts within the site boundary, as well as in the overall community where offsite works are necessary, and utilizes the existing infrastructure to be constructed as a result of the Riverside South Community Phase 9 Design Report as prepared by J.L. Richards & Associates. The following have been addressed as a result of this brief: Addressed the infrastructure needs in sufficient detail to assist in the preparation of detailed design drawings Prepared detailed Grade Control Plan Storm Sewer Servicing o Defined major and minor conveyance systems in conjunction with the grade control plan o Determined the stormwater management (SWM) storage requirements based on the criteria provided for the development Wastewater Servicing o Defined and sized the sanitary collection system Water Servicing o Defined and sized the internal water system with connection to the existing 300 mm dia. watermain on Spratt Road and the existing 200mm dia. watermain within existing Poplin Street. o o o Watermain servicing for the development is to be able to provide average day and maximum day (incl. peak hour) demands (i.e. non-emergency conditions) at pressures within the acceptable range of 40 to 100 psi (275 to 690 kpa) Under fire flow (emergency) conditions, the water distribution system is to maintain a minimum pressure greater than 20 psi (140 kpa) Grading, drainage and services for the area will be designed in accordance with the City of Ottawa guidelines. The accompanying drawings included in Appendix F illustrate the internal servicing scheme for the site. dt w:\active\ _riverside south_block 84\design\report\servicing\rpt_ _servicing_subm1_dct.docx 1.2
7 RIVERSIDE SOUTH BLOCK 3/4, RICHCRAFT GROUP OF COMPANIES INC., CITY OF OTTAWA Background January 17, Background In addition to the aforementioned Phase 9 Design Report, the following studies and guidelines were also referenced in the preparation of this servicing brief: Correspondence Methodology used for DDSWMM modeling of Stacked Units - Riverside South Phase 9, J. L. Richards and Associates Limited, August 17, 2012 Technical Bulletin ISDTB , Revisions to Ottawa Design Guidelines Sewer dated 2004, City of Ottawa, June 20, 2012 Geotechnical Investigation Proposed Residential Development, Block 252 Riverside South Spratt Road, Ottawa, ON, Paterson Group Inc., June 15, 2012 Design Report Riverside South Development Corporation, Riverside South Community Phase 9, J. L. Richards and Associates Limited, December 2011 Letter-type Report regarding Riverside South Community Storm Sewer Realignment at Park and Ride, Stantec Consulting Ltd., May 4, 2010 Letter-type Report regarding Riverside South Community Storm and Sanitary Sewer Realignment at Transit Corridor, Stantec Consulting Ltd., June 12, 2009 Riverside South Community Infrastructure Servicing Study Update Final Report, Stantec Consulting Ltd., 2008 Riverside South Community Master Drainage Plan Update Final Report, Stantec Consulting Ltd., September 2008 City of Ottawa Sewer Design Guidelines, City of Ottawa, November 2004 dt w:\active\ _riverside south_block 84\design\report\servicing\rpt_ _servicing_subm1_dct.docx 2.1
8 RIVERSIDE SOUTH BLOCK 3/4, RICHCRAFT GROUP OF COMPANIES INC., CITY OF OTTAWA Existing Conditions January 17, Existing Conditions The site has been previously designated for development and is part of the Riverside South Community, which has been approved by Ottawa City Council. The site is relatively flat, and has been stripped of surficial topsoil in anticipation of development. Currently, the land generally slopes from the northeast to the southwest corner of the subject property. The proposed grading and servicing for the development will take into consideration the existing drainage and grading requirements around the property, and will provide for necessary transition slopes to meet existing grades around the perimeter of the property. A Permit to Take Water (reference no AZKWD) for the overall phase 9 of the Riverside South Community was obtained from the Ministry of the Environment (MOE). dt w:\active\ _riverside south_block 84\design\report\servicing\rpt_ _servicing_subm1_dct.docx 3.1


 includes")
9 RIVERSIDE SOUTH BLOCK 3/4, RICHCRAFT GROUP OF COMPANIES INC., CITY OF OTTAWAA Potable Water Analysis January 17, Potable Water Analysis 4.1 BACKGRO OUND Stantec Consulting Ltd. (Stantec) has undertaken a hydraulic analysis of the potable water servicing for the proposed development. This residential development will include 9 townhome complexes (up to three stories). The proposed development is located along the south western corner of the intersection of Spratt Road and the future Poplin Street, as shown on Figure 4.1: Location of Proposed Development. It is part of the existing Zone 2W/3C of the City of Ottawa water distribution system. Currently, this zone is fed by the Britannia and Carlington Heights Pumping Station. This submission includes the servicing analysis and recommendations based on estimated boundary conditions corresponding to both the existing and future pressure zone configurations. The future pressuree zone configuration and upgradess will increase the pressures within the system. The boundary conditions were obtained from thee City of Ottawa. Figure 4.1: Location of Proposedd Development The proposed servicing plan (See Figure 4.3: Proposed Servicing Plan) includes tying into the future 203mm diameter watermain that will run along the future Poplin Street and into the existing 305mm diameter watermain that runs along Spratt Road. dt w:\active\ _riverside south_block 84\design\report\servicing\rpt_ _servicing_subm1_dct.docx 4.1

10 RIVERSIDE SOUTH BLOCK 3/4, RICHCRAFT GROUP OF COMPANIES INC., CITY OF OTTAWA Potable Water Analysis January 17, 2013 These two connections will create sufficient looping within the proposed development. The boundary conditions were applied to nodes along the large diameter watermain along Earl Armstrong (tank 1004) and at the corner of Poplin Street and Spratt Road (tank 1003). See Figure 4.2: Location of Boundary Conditions. Figure 4.2: Location of Boundary Conditions dt w:\active\ _riverside south_block 84\design\report\servicing\rpt_ _servicing_subm1_dct.docx 4.2

11 RIVERSIDE SOUTH BLOCK 3/4, RICHCRAFT GROUP OF COMPANIES INC., CITY OF OTTAWA Potable Water Analysis January 17, 2013 Figure 4.3: Proposed Servicing Plan Note that the 3 complexes to the west of Block 3/4 are also being serviced by the proposed watermain network. Only the east sides of the three complexes are to be serviced by the proposed network (13 additional units). dt w:\active\ _riverside south_block 84\design\report\servicing\rpt_ _servicing_subm1_dct.docx 4.3
12 RIVERSIDE SOUTH BLOCK 3/4, RICHCRAFT GROUP OF COMPANIES INC., CITY OF OTTAWA Potable Water Analysis January 17, ALLOWABLE PRESSURES The City of Ottawa Water Distribution Design Guidelines state that the design objective for system pressures under normal demand conditions (i.e. average day, maximum day and peak hour) shall remain between the range of 275 to 690 kpa (40 to 100 psi) at the ground elevation in the streets (i.e. at hydrant level) for typical one and two-story buildings. Under emergency fire flow conditions, the minimum pressure in the distribution system is allowed to drop to 140 kpa (20 psi). 4.3 GROUND ELEVATIONS The existing ground elevations of the proposed development range from approximately 90.95m to 91.48m. The elevations shown on Figure 4.4: Ground Elevations (m) of Nodes were taken from the proposed grading plan and assigned to the nodes in the hydraulic model. dt w:\active\ _riverside south_block 84\design\report\servicing\rpt_ _servicing_subm1_dct.docx 4.4

13 RIVERSIDE SOUTH BLOCK 3/4, RICHCRAFT GROUP OF COMPANIES INC., CITY OF OTTAWA Potable Water Analysis January 17, 2013 Figure 4.4: Ground Elevations (m) of Nodes 4.4 EXISTING & PROPOSED WATERMAIN NETWORK Following the completion of this project, potable water supply will be provided by the existing 305mm diameter watermain on Spratt Road and the future 203mm diameter watermain along Poplin Street. New watermains were added to the hydraulic model within the proposed development area in order to simulate the proposed distribution system. Hazen-Williams coefficients ( C-Factors ) were applied to the new watermains in accordance with the City of Ottawa s Water Distribution Design Guidelines (See Table 4.1). dt w:\active\ _riverside south_block 84\design\report\servicing\rpt_ _servicing_subm1_dct.docx 4.5
14 RIVERSIDE SOUTH BLOCK 3/4, RICHCRAFT GROUP OF COMPANIES INC., CITY OF OTTAWA Potable Water Analysis January 17, 2013 Table 4.1: City of Ottawa Water Distribution Guidelines for Hazen-Willams "C" Coefficient Pipe Diameter (mm) C-Factor 50 to to to Over BOUNDARY CONDITIONS The hydraulic model used for this analysis was created by Stantec. The boundary conditions for the model based on the existing and future pressure zone configurations were provided by the City of Ottawa. Fixed head reservoirs simulating these boundary conditions were placed on Earl Armstrong (node 1004) and the corner of Poplin and Spratt (node 1003) near the proposed servicing watermains as shown in Figure 4.2: Location of Boundary Conditions. Table 4.2: Existing Pressure Zone Configuration Boundary Conditions Reservoir 1002 Reservoir 1003 Average Day (AVDY): 131.0m 131.0m Peak Hour (PKHR): 127.5m 127.5m Max Day + Fire Flow (MXDY+FF): 129.0m 129.0m Average day boundary conditions are based on the future pressure zone configuration since this is when the highest HGL will be achieved (HGL is to increase with the future pressure zone). Peak hour and max day with fire flow boundary conditions are based on the present day pressure zone configuration since these two conditions are when the HGL is the lowest. Table 4.3: Future Pressure Zone Configuration Boundary Conditions Reservoir 1002 Reservoir 1003 Average Day (AVDY): 145.0m 145.0m Peak Hour (PKHR): 137.8m 137.8m Max Day + Fire Flow (MXDY+FF): 139.0m 139.0m dt w:\active\ _riverside south_block 84\design\report\servicing\rpt_ _servicing_subm1_dct.docx 4.6
15 RIVERSIDE SOUTH BLOCK 3/4, RICHCRAFT GROUP OF COMPANIES INC., CITY OF OTTAWA Potable Water Analysis January 17, WATER DEMAND Water demands for the development were estimated using the City of Ottawa s Water Distribution Design Guidelines. The estimated household size of an average townhome is 2.7 persons. Therefore, the total projected population for the proposed residential development will be approximately 222 upon completion of the development. For residential developments, the average day per capita water demand is 350 L/(cap*d). Based on these design guidelines, it is estimated that this development will generate an average day residential demand of 0.9 L/s. The distribution of demands was based on the proximity of the buildings to the relevant model node. For maximum daily demand and peak hour demand, residential demands were multiplied by a factor of 2.5 times average day demand, and 2.2 times the maximum daily demand, respectively. Table 4.4: Population and Demand Projections for Proposed Development provides a summary of the demand allocation for various scenarios. Model Node Table 4.4: Population and Demand Projections for Proposed Development Housing Counts Demand Total Demand TH Persons (TH) Residential (L/s) AVDY (L/s) MXDY (L/s) PKHR (L/s) dt w:\active\ _riverside south_block 84\design\report\servicing\rpt_ _servicing_subm1_dct.docx 4.7
16 RIVERSIDE SOUTH BLOCK 3/4, RICHCRAFT GROUP OF COMPANIES INC., CITY OF OTTAWA Potable Water Analysis January 17, Totals HYDRAULIC MODEL RESULTS The software package used to carry out the analysis was H 2 OMAP Water by Innovyze. The model was tested under three different domestic demand conditions: average day (AVDY), peak hour (PKHR) and one emergency condition: maximum day plus fire flow (MXDY + FF) for both the existing and future pressure zone configurations. Figure 4.5: Junction IDs and Figure 4.6: Pipe IDs provide the IDs of each of the proposed junctions and pipes inputted into the hydraulic model. These IDs are used to present the results in tabular format in the following sections. dt w:\active\ _riverside south_block 84\design\report\servicing\rpt_ _servicing_subm1_dct.docx 4.8

17 RIVERSIDE SOUTH BLOCK 3/4, RICHCRAFT GROUP OF COMPANIES INC., CITY OF OTTAWA Potable Water Analysis January 17, 2013 Figure 4.5: Junction IDs dt w:\active\ _riverside south_block 84\design\report\servicing\rpt_ _servicing_subm1_dct.docx 4.9

18 RIVERSIDE SOUTH BLOCK 3/4, RICHCRAFT GROUP OF COMPANIES INC., CITY OF OTTAWA Potable Water Analysis January 17, 2013 Figure 4.6: Pipe IDs dt w:\active\ _riverside south_block 84\design\report\servicing\rpt_ _servicing_subm1_dct.docx 4.10
19 RIVERSIDE SOUTH BLOCK 3/4, RICHCRAFT GROUP OF COMPANIES INC., CITY OF OTTAWA Potable Water Analysis January 17, Average Day, Future Pressure Zone Configuration Table 4.5 and Table 4.6 present the model output results for the average day demand analysis based on the future pressure zone configuration. As shown, the typical operating pressures are anticipated to range between 505 kpa (73 psi) and 511 kpa (74 psi) based on the local ground elevations and pipe hydraulic conditions. These operating pressures are thus within the allowable pressure range of 275 kpa to 690 kpa (40 to 100 psi), as recommended by the City of Ottawa s Water Distribution Design Guidelines. Furthermore, the townhome units are reported to be three story buildings, taking into account an additional 35 kpa (5 psi) of headloss to account for the elevation difference and minor loss for an additional floor above the typical twostory building, our equivalent resulting pressure is still within allowable pressure range for the average day demand conditions. Table 4.5: Average Day Model Node Output Results, Future Zone Configuration ID Demand (L/s) Elevation (m) Head (m) Pressure (psi) Pressure (kpa) dt w:\active\ _riverside south_block 84\design\report\servicing\rpt_ _servicing_subm1_dct.docx 4.11
20 RIVERSIDE SOUTH BLOCK 3/4, RICHCRAFT GROUP OF COMPANIES INC., CITY OF OTTAWA Potable Water Analysis January 17, Table 4.6: Average Day Model Pipe Output Results, Future Zone Configuration ID From Node To Node Length (m) Diameter (mm) Roughness Flow (L/s) Velocity (m/s) Headloss (m) HL/1000 (m/km) dt w:\active\ _riverside south_block 84\design\report\servicing\rpt_ _servicing_subm1_dct.docx 4.12
21 RIVERSIDE SOUTH BLOCK 3/4, RICHCRAFT GROUP OF COMPANIES INC., CITY OF OTTAWA Potable Water Analysis January 17, Peak Hour, Existing Pressure Zone Configuration Table 4.7 and Table 4.8 present the model output results for peak hour demand analysis for the existing pressure zone configuration. As shown in the results, typical operating pressures are anticipated within the range of 324 kpa (47 psi) to 330 kpa (48 psi) based on the local ground elevations and pipe hydraulic conditions. The resultant pressures are thus within the allowable pressure range of 275 kpa to 690 kpa (40 to 100 psi), as recommended by the City of Ottawa s Water Distribution Design Guidelines. Furthermore, the townhome units are reported to be three story buildings, taking into account an additional 35 kpa (5 psi) of headloss to account for the elevation difference and minor loss for an additional floor above the typical two-story building, our equivalent resulting pressure is still within allowable pressure range for the peak demand conditions. Table 4.7: Peak Hour Model Node Output Results, Existing Zone Configuration ID Demand (L/s) Elevation (m) Head (m) Pressure (psi) Pressure (kpa) dt w:\active\ _riverside south_block 84\design\report\servicing\rpt_ _servicing_subm1_dct.docx 4.13
22 RIVERSIDE SOUTH BLOCK 3/4, RICHCRAFT GROUP OF COMPANIES INC., CITY OF OTTAWA Potable Water Analysis January 17, Table 4.8: Peak Hour Model Pipe Output Results, Existing Zone Configuration ID From Node To Node Length (m) Diameter (mm) Roughness Flow (L/s) Velocity (m/s) Headloss (m) HL/1000 (m/km) dt w:\active\ _riverside south_block 84\design\report\servicing\rpt_ _servicing_subm1_dct.docx 4.14
23 RIVERSIDE SOUTH BLOCK 3/4, RICHCRAFT GROUP OF COMPANIES INC., CITY OF OTTAWA Potable Water Analysis January 17, Maximum Day + Fire Flow Results The City of Ottawa s design guidelines for water distribution systems require a minimum pressure of 140 kpa (20 psi) to be maintained at all points in the distribution system under a condition of maximum day and fire flow demand. For planning purposes, a fire flow of 283 L/s was used, as obtained from the Fire Underwriters Survey fire flow calculation. This value was calculated based on a 3-story, wooden frame townhome. Please refer to Appendix C for the Fire Underwriters Survey fire flow calculations. A fire flow calculation was performed for every building, with the highest demand governing the fire flow demand for the entire development. A fire flow analysis was carried out using the hydraulic model to determine the anticipated amount of flow that could be provided at each of the nodes (except nodes 5 and 24) in the proposed development under maximum day demands while still maintaining a residual pressure of 140 kpa (20 psi). This was accomplished using a steady-state maximum day demand scenario along with the automated fire flow simulation feature of the software. Node 24 was removed from analysis since it is a 50mm diameter pipe without a hydrant Existing Pressure Zone Configuration (Primary Analysis) The fire flow results presented in Table 4.9 show that fire flows greater than 283 L/s (17000 L/min) can be achieved at all locations in the proposed development with the existing pressure zone configuration. Table 4.9: Maximum Day Fire Flow Results, Existing Zone Configuration ID Static Demand (L/s) Static Pressure (psi) Static Head (m) Fire Flow Demand (L/s) Residual Pressure (psi) Available Flow at Hydrant (L/s) Available Flow Pressure (psi) dt w:\active\ _riverside south_block 84\design\report\servicing\rpt_ _servicing_subm1_dct.docx 4.15
24 RIVERSIDE SOUTH BLOCK 3/4, RICHCRAFT GROUP OF COMPANIES INC., CITY OF OTTAWA Potable Water Analysis January 17, SUMMARY OF FINDINGS The proposed servicing in this development will provide sufficient capacity to sustain both the required domestic demands and emergency fire flow demands before and after the reconfiguration of pressure zones. Based on computer modeling results, fire flows greater than 283 L/s (17000 L/min) are available for this development based on the watermain alignment and sizing shown in Figure 4.3. With the existing pressure zone configuration, the minimum pressure found within the model output results, 324 kpa (47 psi), is within the recommended design guidelines for minimum pressure for one, two and three story units. With the future pressure zone configuration, the maximum pressure modeled, 511 kpa (74 psi), does not exceed the maximum allowable pressure of 552kPa (80psi) and therefore, pressure reducing devices are not required as per the Ontario Building/Plumbing Code. This distribution system in both conditions contains adequate looping and satisfies the reliability requirement for looping from the City of Ottawa. dt w:\active\ _riverside south_block 84\design\report\servicing\rpt_ _servicing_subm1_dct.docx 4.16
25 RIVERSIDE SOUTH BLOCK 3/4, RICHCRAFT GROUP OF COMPANIES INC., CITY OF OTTAWA Storm Drainage January 17, Storm Drainage 5.1 BACKGROUND A preferred stormwater management (SWM) plan and approved design criteria for the Riverside South Community were established in the Riverside South Community Infrastructure Servicing Study Update (RSCISSU) (Stantec, 2008 and subsequent letter report updates in June 2009 and May 2010) and Master Drainage Plan Update (RSCMDPU) (Stantec, September 2008). The RSC SWM Pond 1 was built in the early 1990 s and it was sized to provide erosion, quality and quantity control for its tributary drainage area, which was later modified in the RSCISSU and RSCMDPU. The RSCISSU showed the proposed development within area 1-6 with 77 L/s/ha allowable release rate to the minor system and 50 m 3 /ha of surface storage requirements. The SWM criteria for Block 3/4 was subsequently revised in the Design Report Riverside South Development Corporation, Riverside South Community Phase 9 prepared by J. L. Richards and Associates (latest revision December 2011) to store the 100 year peak flows from the areas in Phase 9 that have major system flows directed to Earl Armstrong Road given that there is no present outlet for major flows at this location. As a result, J. L. Richards report revised the SWM criteria for area 1-6 to provide 85 m 3 /ha and to restrict peak flows to the minor system to 77 L/s/ha as per the RSCISSU, even though it was identified that this minor system release rate is less than the 5 year post development runoff and as such there will be 5 year ponding on the streets within the Phase 9 areas of the RSC tributary to the existing SWM Pond 1. SWM design calculations for Phase 9 of the RSC have since been revised to include higher imperviousness values to reflect current site plans in the area tributary to the RSC SWM Pond 1, which resulted in total 100 year flow depths higher than 30 cm at some locations in the development downstream of the proposed Block 3/4 along Brian Good Avenue. In addition, it was identified that due to the increased imperviousness of the tributary area, the 100 year storm could not be stored on site prior to reaching Earl Armstrong Road at Brian Good Avenue. It has also been demonstrated that increasing and/or reducing surface storage in the upstream areas has little to no impact in the volume of runoff spilling off site at Earl Armstrong Road during the 100 year storm. However, as mentioned in the previous section, City of Ottawa staff has required that 50 m 3 /ha of storage plus the difference between the 5 year storage required with the proposed C value and a C value of 0.5 be provided on site. Minor system flow rates will be restricted to 77 L/s/ha (see correspondence from J. L. Richards attached in Appendix A9). dt w:\active\ _riverside south_block 84\design\report\servicing\rpt_ _servicing_subm1_dct.docx 5.1
26 RIVERSIDE SOUTH BLOCK 3/4, RICHCRAFT GROUP OF COMPANIES INC., CITY OF OTTAWA Storm Drainage January 17, PURPOSE The purpose of this stormwater management (SWM) report is to assess the adequacy of the proposed major system, to estimate the 100 year HGL across the proposed site and to demonstrate adherence to previously established criteria. 5.3 CRITERIA AND CONSTRAINTS Criteria were established through review of the background documentation and correspondence with J. L. Richards staff, supplemented with current design practices outlined by the City of Ottawa Sewer Design Guidelines (City of Ottawa, November 2004) and the City of Ottawa s Technical Memo (City of Ottawa, January 2012). Use of the dual drainage principle Maximum 100 year flow depth of 0.30 m in road sags Standing water depths at road sags not to cause surface flooding on any building or structure Use of standard self-cleansing inlet-control devices where possible Major system overflows to be directed to Poplin Street Maximum peak release rate to the minor system to be restricted to 77 L/s/ha L/s (see J. L. Richards latest storm sewer design sheet in Appendix A9) Site storage equal or higher than 138 m 3 which is equal to the sum of 50 m 3 /ha plus the difference between the 5 year storage requirements with a C of 0.7 and a C of 0.5 be provided on site (see detailed calculations in Appendix A1) 100 year hydraulic grade line (HGL) to be a minimum of 0.30 m below proposed building foundation footings (3hr Chicago Storm) Size storm sewers to convey the 5 year storm event under free-flow conditions using 2004 City of Ottawa I-D-F parameters Stress-test the proposed major system during the July 1 st, 1979 storm and the 100 year, 3 hr Chicago storm with intensities increased by 20% Subdrains required in swales where longitudinal gradient is less than 1.5% Provide adequate emergency overflow conveyance off-site Quality control is provided in the downstream Riverside South SWM Pond 1 dt w:\active\ _riverside south_block 84\design\report\servicing\rpt_ _servicing_subm1_dct.docx 5.2
27 RIVERSIDE SOUTH BLOCK 3/4, RICHCRAFT GROUP OF COMPANIES INC., CITY OF OTTAWA Storm Drainage January 17, STORMWATER MANAGEMENT DESIGN The following sections describe the stormwater management (SWM) design for the proposed Block 3/4 of the RSC in the context of the background documents and governing criteria Proposed Conditions The proposed Block 3/4 development (the site) will comprise a series of stacked units, landscape and parking areas, with associated transportation and servicing infrastructure. The average imperviousness of the site is 71% (C = 0.70). The proposed site is designed using the dual drainage principle, whereby the minor (pipe) system is designed to convey 77 L/s/ha to avoid surcharging downstream storm sewers as specified in the RSCISSU and runoff from larger events is conveyed by both minor (pipe) and major (overland) channels such as roadways and walkways safely off site. Due to the restrictive minor system criteria for the site, a combination of IPEX inlet control devices (ICD) Type A and Tempest Low to Medium Flow (LMF) ICDs will be specified for street catchbasins to limit the inflow to the minor system and thus control the hydraulic grade line from surcharging storm sewers into basements during major storms and to meet the target release rate from the site. The combination of leads from catchbasins on opposite sides of the street to a single ICD will be utilized where necessary to limit the inflow to the system. Solid covers will be installed on all manholes located in ponding areas to limit inflows to the minor system to that of the ICD. Drawing SD-1 outlines the proposed drainage areas and ICD schedule. Major system runoff from the proposed site will be directed northerly towards Poplin Street and conveyed through the adjacent subdivision to the west towards Brian Good Avenue Proposed Condition Hydrology A comprehensive hydrologic modeling exercise was completed with DDSWMM, accounting for the estimated major and minor flows to evaluate the response of the storm sewer infrastructure and the site s major system. Drawing SD-1 presents the detailed drainage catchments in the proposed site as well as overland flow direction, and ICD schedule Hydrologic Parameters and Assumptions The following assumptions were applied to the DDSWMM model for the Block 3/4 development: Surface storage estimates for the proposed subcatchments were based on the grading plan design (see Drawing SD-1) Horton infiltration parameters used (see Appendix A1) 3hr Chicago Storm distribution as outlined in the RSISSU (Stantec, 2008) dt w:\active\ _riverside south_block 84\design\report\servicing\rpt_ _servicing_subm1_dct.docx 5.3
28 RIVERSIDE SOUTH BLOCK 3/4, RICHCRAFT GROUP OF COMPANIES INC., CITY OF OTTAWA Storm Drainage January 17, 2013 Major system to be assessed during the July 1 st, 1979 historical storm and during the 100 year design storm increased by 20% Impervious areas were calculated in PCSWMM by bringing in the drainage areas and the delineated pervious surfaces. Imperviousness values were converted to runoff coefficients for storm sewer sizing purposes using the relationship C = (Imp. x 0.7) Subcatchment areas and segment lengths defined from high-point to high-point where sags occur Subcatchment width equal to two times the average segment length for two-sided catchments, equal to one time the segment length for one-sided catchments, and equal to 225 times the area of the catchment for any other catchments Number of catchbasins based on servicing plan (Drawing SD-1) Catchbasin inflow restricted with inlet-control devices (ICD) as necessary to meet the target peak outflow from the site Different segment cross-section types were defined to represent 7.0 m wide roads at different longitudinal slopes, half road, and a sheet flow surface for area EX Proposed Condition Hydrologic Analysis Results Table 5.1 and Table 5.2 summarize the minor system inflow and major system sag storage and overflow results for the proposed Block 3/4 development during the 5 and 100 year, 3hr Chicago storms respectively. Appendices A2, A3, A4, and A5 summarize the DDSWMM modeling results for the various storm events included in this analysis. The total flow depth shown in the tables below is equal to the depth on the segment obtained from DDSWMM plus the maximum ponding depth on street sags, when the storage used obtained from DDSWMM equals the maximum storage available on the street sag. Otherwise, the actual ponding depth on street sags was interpolated using the maximum storage used obtained from DDSWMM. Segment ID Table 5-1: RSC Block 3/4 Major and Minor System 5 Year Storm Results Peak Flow (m 3 /s) 1 Segment Flow Depth (cm) 2 Max. Capture (L/s) Tributary Manhole Storage Used (m 3 ) Major System Spill Flow (m 3 /s) Available Ponding Depth (cm) Total Flow Depth (cm) 3 EX NONE ST103A ST104A ST106A ST107A ST108A ST109A ST111A dt w:\active\ _riverside south_block 84\design\report\servicing\rpt_ _servicing_subm1_dct.docx 5.4
29 RIVERSIDE SOUTH BLOCK 3/4, RICHCRAFT GROUP OF COMPANIES INC., CITY OF OTTAWA Storm Drainage January 17, 2013 Segment ID Peak Flow (m 3 /s) 1 Segment Flow Depth (cm) 2 Max. Capture (L/s) Tributary Manhole Storage Used (m 3 ) Major System Spill Flow (m 3 /s) Available Ponding Depth (cm) Total Flow Depth (cm) 3 ST111B ST112A The Catchment Peak is obtained from DDSWMM output files and includes the peak flow generated by the catchment plus the spillover peak flows from upstream catchments 2. The Depth of Segment is obtained from DDSWMM output files and represents the depth of flow over the segment (i.e., swales, parking lots, roads). An assumed street segment at a longitudinal slope measured from high point to high point is assigned to catchments with sag storage in order to estimate the spill over flow depth and thus estimate the total dynamic flow depth 3. The total flow depth shown for segments with sag storage represents the sag ponding depth plus the flow depth on an imaginary road segment at a longitudinal slope from high point to high point over the sag Segment ID Table 5-2: RSC Block 3/4 Major and Minor System 100 Year Storm Results Peak Flow (m 3 /s) 1 Spillover Flow Depth (cm) 2 Max. Capture (L/s) Tributary Manhole Storage Used (m 3 ) Major System Spill Flow (m 3 /s) Available Ponding Depth (cm) Total Flow Depth (cm) 3 EX NONE ST103A ST104A ST106A ST107A ST108A ST109A ST111A ST111B ST112A The Catchment Peak is obtained from DDSWMM output files and includes the peak flow generated by the catchment plus the spillover peak flows from upstream catchments 2. The Depth of Segment is obtained from DDSWMM output files and represents the depth of flow over the segment (i.e., swales, parking lots, roads). An assumed street segment at a longitudinal slope measured from high point to high point is assigned to catchments with sag storage in order to estimate the spill over flow depth and thus estimate the total dynamic flow depth 3. The total flow depth shown for segments with sag storage represents the sag ponding depth plus the flow depth on an imaginary road segment at a longitudinal slope from high point to high point over the sag A total of 146 m 3 of storage has been provided on site, which meets the 138 m 3 target. The 100 year, 3 hr Chicago major system overflow to Poplin Street is m 3 /s (spill flow at ST103A plus ST107A), while there are no major system overflows during the 5 year storm. The above table shows that the overall 100 year (3 hr Chicago storm) resulting inflow from the proposed development to the minor system is L/s. dt w:\active\ _riverside south_block 84\design\report\servicing\rpt_ _servicing_subm1_dct.docx 5.5
30 RIVERSIDE SOUTH BLOCK 3/4, RICHCRAFT GROUP OF COMPANIES INC., CITY OF OTTAWA Storm Drainage January 17, 2013 Hydrographs from half road areas ST108A, ST111A and ST112A were routed through 3.5 m wide roads to simulate half the street. However, additional calculations have been done to more closely estimate the 100 year flow depth on areas that include half street segments. Table 5.3 shows a major system rating curve as obtained from the DDSWMM output files for a 7.0 m wide road at 0.1% longitudinal slope (assumed road segment from high point to high point). The peak flow values provided in DDSWMM represent the total peak flow that can be conveyed by the road segment (two sides of the street). In order to provide a rating curve for only half the road, the peak flow column obtained from DDSWMM has been divided by two (Half Street Flow column). Table 5-3: Full Street and Half Street Rating Curve Comparison Flow Depth (cm) Full Street Flow (m 3 /s) Spread (m) Half Street Flow (m 3 /s) Table 5.4 shows the total peak flow to the segment from DDSWMM (100 yr, 3hr Chicago storm), the segment flow depth obtained by interpolating the peak flow in the major system rating curve for half a street, the 100 year ponding depth based on the storage used, and the total flow depth which is equal to the segment flow depth plus the ponding depth. A final column has been provided with the total flow depth provided in Table 5.2 for comparison. dt w:\active\ _riverside south_block 84\design\report\servicing\rpt_ _servicing_subm1_dct.docx 5.6
31 RIVERSIDE SOUTH BLOCK 3/4, RICHCRAFT GROUP OF COMPANIES INC., CITY OF OTTAWA Storm Drainage January 17, 2013 Peak Flow (m 3 /s) Table 5-4: 100 Year Flow Depth on Half Street Segments Revised Total Dynamic Flow Depth (cm) Previous Total Dynamic Flow Depth (cm) Segment ID Segment Flow Depth (cm) Ponding Depth (cm) ST103A ST107A ST108A ST111A ST111B ST112A ST106A The July 1 st, 1979 historical storm and the 100 year design storm increased by 20% were also used to evaluate the major system across the proposed site and results are summarized in Appendix A4 and A5 respectively. The results of the hydrologic analyses (DDSWMM input and output files) for the different storm events are summarized in Appendices A2 to A5. The 100 year calculations of flow depth x velocity at different road segments with the highest peak flows and flow depths have been included in Appendix A8 in order to ensure that the V x d < 0.6 m 2 /s criteria has been satisfied across the proposed site. The following table summarizes the ICD schedule across the proposed site. Table 5-5: Block 3/4 ICD Schedule Catchment ID ICD Type / Size (mm) Max. Release Rate (L/s) # of CBs and Interconnection 'ST103A' 2 X IPEX A CBS - THREE INTERCONNECTED 'ST104A' 2 X LMF CBS - TWO INTERCONNECTED 'ST106A' 1 X LMF CBS - INTERCONNECTED 'ST107A' 1 X IPEX A CBS - INTERCONNECTED 'ST108A' 1 X LMF CB 'ST109A' 1 X LMF CBS - INTERCONNECTED 'ST111A' 1 X LMF CB 'ST111B' 1 X LMF CBS - INTERCONNECTED 'ST112A' 1 X LMF CB 1. Contractor to provide IPEX and Tempest LMF ICDs or approved equivalent with a maximum release rate as shown in the ICD Schedule dt w:\active\ _riverside south_block 84\design\report\servicing\rpt_ _servicing_subm1_dct.docx 5.7
32 RIVERSIDE SOUTH BLOCK 3/4, RICHCRAFT GROUP OF COMPANIES INC., CITY OF OTTAWA Storm Drainage January 17, Proposed Condition Hydraulic Grade Line Analysis In order to assess the hydraulic grade line (HGL) elevation across the proposed site, the storm sewers and detailed DDSWMM hydrology for the 100 year, 3 hr Chicago storm were incorporated into an XP-SWMM model. The results of this analysis have been included in Appendix A6 while Appendix A7 presents the proposed storm sewer design sheet. The 100 year, 3hr Chicago HGL boundary condition (fixed water level) at MH101 was obtained from J. L. Richards as m (see 100 year HGL Analysis for Phase 9 of the RSC in Appendix A9). Table 5.6 summarizes the 100 year, 3 hr Chicago HGL modeling results across the proposed site and shows the lowest USF elevations and proposed road grades. Table 5-6: 100 Yr, 3hr Chicago Hydraulic Grade Line Results Node (CB/MH) Prop. Road Elevation (m) Lowest Underside of Footing (m) 100 Yr HGL (m) 100 Yr Difference (USF HGL) (m) N/A N/A E As demonstrated in Table 5.6, the 100 year storm (3 hr Chicago) results in HGL elevations that remain at least 0.36 m below the proposed underside of footings (USFs) across the proposed site at all locations. dt w:\active\ _riverside south_block 84\design\report\servicing\rpt_ _servicing_subm1_dct.docx 5.8
33 RIVERSIDE SOUTH BLOCK 3/4, RICHCRAFT GROUP OF COMPANIES INC., CITY OF OTTAWA Sanitary Drainage January 17, Sanitary Drainage The Riverside South Community Phase 9 Design Report concluded that the existing 525mm diameter sanitary sewer stub located south of the Earl Armstrong Road Park and Ride, has capacity to service the proposed levels of development in the area. The proposed site will be serviced by a network of gravity sanitary sewers and will outlet to the Poplin Street sanitary sewer tributary to the 525mm stub as shown on Appendix F - Drawing SA SANITARY SEWER The 525 mm dia. sewer at Spratt Road has already been installed, as well as the connecting sewer on Poplin Street. As several drainage areas as noted on J.L.Richards Drawing D2-SAN (included as part of Appendix E) as part of the Phase 9 Design Report have been modified, the attached sanitary drainage calculation sheet (Appendix B) and accompanying Drawing SA-1 have been created to ensure that projected wastewater flows have not been increased beyond that identified in the report. The total flow generated within the site via the outlet at Poplin Street was estimated to be approximately 3.22 L/s. The total flow generated via the connection from Poplin Street at Spratt Road (noted as MH2 by the Phase 9 Design Report) was estimated to be approximately L/s which includes all external lands in the immediate vicinity of the subject site. This value is below the previous estimate of 20.28L/s as reported in the J.L.Richards study. The decrease in estimated flows is due to a reduced population estimate for the subject site, which was previously identified as being stacked townhomes v. the current unit configuration as shown in the attached drawings. 6.2 PROPOSED SANITARY SEWERS DESIGN CRITERIA The proposed development will consist solely of residential townhomes. The following population densities were assigned to each designation; Townhouses (medium density) 2.7ppu (persons per unit) Residential Peak factor, based on Harmon Equation was used to determine the peak design flows. For commercial flows a Peak factor of 1.5 was used. An allowance of 0.28 L/s/effective gross ha (for all areas) was used to generate peak extraneous flows. For external areas, stacked units and townhomes were assigned a population density of 2.4ppu to maintain consistency with the RSC Phase 9 Design Report. dt w:\active\ _riverside south_block 84\design\report\servicing\rpt_ _servicing_subm1_dct.docx 6.1
34 RIVERSIDE SOUTH BLOCK 3/4, RICHCRAFT GROUP OF COMPANIES INC., CITY OF OTTAWA Geotechnical Consideration January 17, Geotechnical Consideration A Geotechnical Investigation Report has been prepared by Paterson Group for the proposed site (see excerpts as Appendix D). As stated in the Geotechnical Investigation Report, the subsurface profile across the site consists of stiff to very stiff silty clay over a firm to stiff silty clay deposit. Geological maps of the area have indicated bedrock consisting of dolomite and sandstone at an approximate depth of m below ground surface. Groundwater levels were recorded on April 16, 2012 and range from 0.3 to 6.0 m below existing ground surface and are subject to seasonal fluctuations. Due to the relatively high water table observed, high groundwater inflow rates could be encountered within deep excavations for services. The Geotechnical Investigation Proposed Residential Development, Riverside South Community Development Phase 9, Ottawa Ontario report as prepared by Golder Associates (June 2011) for the overall community recommends a grade raise restriction of 1.6m for the subject site to be respected by the proposed grading plan for the development. Due to the presence of clay, protective granular pads, mud mats and geotextiles may be required during construction to protect subgrades from disturbances. Temporary excavations should be carried out at side slopes no steeper than 1H:1V from the base of the excavation. dt w:\active\ _riverside south_block 84\design\report\servicing\rpt_ _servicing_subm1_dct.docx 7.1
35 RIVERSIDE SOUTH BLOCK 3/4, RICHCRAFT GROUP OF COMPANIES INC., CITY OF OTTAWA Grading and Drainage January 17, Grading and Drainage A detailed grading plan (GP-1) has been prepared for this report submission to satisfy the stormwater management requirements and grade raise restrictions for the site. Road profiles have been established to provide an overland flow route required for stormwater management directed in its majority towards Poplin Street, as well as to provide minimum cover requirements for storm sewers directed towards the site outlet. Centerline road grades for Poplin Street and Spratt Road have previously been established based on the Riverside South Community Phase 9 Design Report. Unit finished floor and underside of footing elevations have been set based on adjacent overland spill elevations, and proposed underside of footing elevations maintain a minimum 0.30m separation from anticipated HGL elevations in the region. dt w:\active\ _riverside south_block 84\design\report\servicing\rpt_ _servicing_subm1_dct.docx 8.1
36 RIVERSIDE SOUTH BLOCK 3/4, RICHCRAFT GROUP OF COMPANIES INC., CITY OF OTTAWA Utilities January 17, Utilities 9.1 HYDRO It is anticipated that Hydro Ottawa will require access off Nutting Crescent to accommodate utility plant for the proposed development. If distribution network looping is required, this point of supply will likely be via exiting overhead lines within Spratt Road. Easements on the new development may be required in order to accommodate Hydro plant. Exact size and location of the utility easements is to be available at the detailed Composite Utility Plan (CUP) design stage. 9.2 ENBRIDGE GAS Similarly to Hydro, it is anticipated that the development may be serviced by existing infrastructure at Nutting Crescent. If necessary, looping may be proposed by means of plant at Spratt Road via Earl Armstrong Drive. 9.3 TELECOMMUNICATIONS It is anticipated that Bell and Rogers will be able to service the subject site via plant at Nutting Crescent. Both Bell and Rogers will require easements for their respective utility cabinets and vaults, the exact size and location of which is to be available at the detailed CUP design phase. dt w:\active\ _riverside south_block 84\design\report\servicing\rpt_ _servicing_subm1_dct.docx 9.1
37 RIVERSIDE SOUTH BLOCK 3/4, RICHCRAFT GROUP OF COMPANIES INC., CITY OF OTTAWA Erosion and Sediment Control During Construction January 17, Erosion and Sediment Control During Construction The erosion and sediment control strategy has been developed and is to be implemented during the construction process, in order to minimize the potential for offsite discharge of sediment and the resultant negative environmental impacts. Prior to any grading or servicing works commencing on site, erosion and sedimentation control measures shall be implemented as detailed on Drawing EC-1, the Erosion and Sedimentation Control plan. The proposed erosion and sedimentation controls include but are not limited to the following items: Light and/or heavy duty silt fencing will be erected on all site boundaries where there is potential for runoff to be discharged offsite, to protect adjacent downstream lands from migration of sediment in overland flow. The location of this fencing will be adjacent to the limit of grading During construction, all catchbasins are to be sealed with geotextile until roads are paved to prevent sediment deposition in the catchbasin s sumps and conveyance of silt to the SWMF The following recommendations to the contractor will be included in contract documents: 1. Limit extent of exposed soils at any given time. 2. Re-vegetate exposed areas as soon as possible. 3. Minimize the area to be cleared and grubbed. 4. Protect exposed slopes with plastic or synthetic mulches. 5. Install silt fence to prevent sediment from entering existing ditches. 6. Provide sediment traps and basins during dewatering. 7. Install filter cloth between catchbasins and frames. 8. Plan construction at proper time to avoid flooding. 9. Establish material stockpiles away from watercourses, so that barriers and filters may be installed. The contractor will, at every rainfall event, complete inspections and guarantee proper performance. The inspection is to include verification that water is not flowing under silt barriers and cleaning and changing of filter cloth at catchbasins. dt w:\active\ _riverside south_block 84\design\report\servicing\rpt_ _servicing_subm1_dct.docx 10.1
38 RIVERSIDE SOUTH BLOCK 3/4, RICHCRAFT GROUP OF COMPANIES INC., CITY OF OTTAWA Conclusion January 17, Conclusion 11.1 STORMWATER SERVICING Based on the preceding report, the following conclusions can be drawn: Inlet control devices are proposed across the proposed Block 3/4 in the RSC to limit the overall 100 year inflow into the minor system outlet towards the RS SWM Pond 1 to L/s The proposed site has been graded to provide 146 m 3 of storage which meets the 138 m 3 target The storm sewer hydraulic grade line across the proposed site is maintained at least 0.36 m below the proposed underside of footings (USFs) at all locations 100 year total flow depths (ponding depth plus spill flow depth) across the proposed site have been minimized as much as possible to a maximum total flow depth of 0.31 m Water quality control will be provided in the downstream RS SWM Pond SANITARY SERVICING The proposed site will be serviced by a network of gravity sanitary sewers and will outlet to the Poplin Street sanitary sewer. The total flow generated within the site via the outlet at Poplin Street was estimated to be approximately 3.22 L/s. The total flow generated via the connection from Poplin Street at Spratt Road (noted as MH2 by the Phase 9 Design Report) was estimated to be approximately L/s which includes all external lands in the immediate vicinity of the subject site WATER SERVICING The proposed servicing in this development will provide sufficient capacity to sustain both the required domestic demands and emergency fire flow demands before and after the reconfiguration of pressure zones. Based on computer modeling results, fire flows greater than 283 L/s (17000 L/min) are available for this development based on the watermain alignment and sizing shown GRADING Grading for the site has been designed to provide an overland flow route as per City standards and reflects the grade raise restrictions recommended in the Geotechnical Investigation Proposed Residential Development, Riverside South Community Development Phase 9, Ottawa dt w:\active\ _riverside south_block 84\design\report\servicing\rpt_ _servicing_subm1_dct.docx 11.2


39
40 Appendix A1 Parameter Summary and Calculations
41 :RIVERSIDE SOUTH BLOCK 3/4 Model Input Minor System Target Release Rate 77 L/s/ha Block Area 1.3 ha PCSWMM Input Parameter Summary L/s Target Inflow Inflow at CB T/G ICD Storage Ponding Runoff Mannings n Mannings n Ia Imp. Ia Perv. Infiltration Segment Area (ha) A x C Imp. (%) Slope (m/m) Width (m) fo (mm) fc (mm) k (s -1 ) Coeff. (Imp.) (Perv.) (mm) (mm) 77L/s/ha (L/s) (L/s) (m 3 ) NW NSD ASW PIMP CNIMP CNP S WLAT DETIMP DETP MAX MIN DECAY Actual (Available) Model Catchment ID Inflow at Maximum Ponding 'EX-1' 'EX-1' Hortons N/A 'ST103A' 'ST103A' Hortons x IPEX A 'ST104A' 'ST104A' Hortons x Model 'ST106A' 'ST106A' Hortons x Model 'ST107A' 'ST107A' Hortons x IPEX A 'ST108A' 'ST108A' Hortons x Model 'ST109A' 'ST109A' Hortons x Model 'ST111A' 'ST111A' Hortons x Model 'ST111B' 'ST111B' Hortons x Model 'ST112A' 'ST112A' Hortons x Model Overall, Block 84 = ) Standard City of Ottawa Data for Initial Abstraction Parameters and Infiltration values 91.4 m 3 /ha 2) Width based on two times the length of the segment for two sided catchments, the length of the segment for one sided catchment, and 225 m/ha if no road information is available 3) Areas and ponding volumes based on grading plan Major System Segment Name Post Development Major System (Segment & Inlet Capacity) Parameters U/S Node Receiving Flow Sag Inlet Storage D/S Segment Segment # of Storm Inlet Type Max Inlet Name Length (m) Type Inlets (I.D.) Capture (L/s) (m 3 ) NS NSD XS IDSS NUMCB IDCB QLIM NPD QAPP 'EX-1' 'POPLIN1' 'NONE' - 'ST103A' 'POPLIN2' '103' 34.3 'ST104A' 'ST103A' '104' 6.9 'ST106A' 'ST104A' '106' 31.7 'ST107A' 'POPLIN3' '107' 22.2 'ST108A' 'ST107A' '108' 2.2 'ST109A' 'ST107A' '109' 5.9 'ST111A' 'ST107A' '111' 10.6 'ST111B' 'ST107A' '111' 26.4 'ST112A' 'ST103A' '112' 6.1 Date: 1/11/2013 Stantec Consulting Ltd. parameters_summary.xlsm, Subcatchments
42 Stormwater Management Calculations Project # :RIVERSIDE SOUTH BLOCK 3/4 Modified Rational Method Calculations - USED TO DETERMINE SITE STORAGE REQURIEMENTS 5 yr Intensity I = a/(t + b) c a = t (min) I (mm/hr) City of Ottawa b = c = YEAR Volume Estimate from Site with C = YEAR Volume Estimate from Site with C = 0.70 Subdrainage Area: Site Area Subdrainage Area: Site Area Area (ha): Area (ha): C: 0.50 C: 0.70 tc I (5 yr) Qactual Qrelease Qstored Vstored Vavailable tc I (5 yr) Qactual Qrelease Qstored Vstored Vavailable (min) (mm/hr) (L/s) (77 L/s/ha) (L/s) (m 3 ) (m 3 ) (min) (mm/hr) (L/s) (77 L/s/ha) (L/s) (m 3 ) (m 3 ) Site Volume Required : As per correspondence between JL Richards and City of Ottawa Staff, a volume of 50 cu.m/ha plus the required volume difference during the 5 year storm for a C of 0.50 and the proposed C value (0.70) will be provided on site 50 m 3 /ha of storage required as per Riverside South MSS (2008) for a medium density residential development with a C=0.50 Additional site storage required based on increased C value: 58.2 m 3 Total site storage required : m 3 Date: January 2013 Stantec Consulting Ltd. Page 1 of 1 parameters_summary.xlsm, Modified RM
43 Appendix A2 Input/Output Files: 5 Year, 3hr Chicago Storm
44 a11-13_005.out *************************************************** * D D S W M M (release 2.1) * * The Dual Drainage Storm Water Management Model * * Copyright * * * * AMK Associates International Ltd. * *************************************************** August, 2004 Stantec Consulting Ltd. Ottawa, Ontario (S/N DM ) This release of DDSWMM will run with a maximum of 500 minor system segments (pipes), including outlets 500 major system (street) segments, including outlets 500 subcatchments 30 storage units for the minor system 30 storage units for the major system 300 computational time steps 300 increments for rainfall hyetograph 50 storm inlet types 20 points describing the inlet capture curve 50 major system segment types 5 street segments discharging into a street junction 5 pipes discharging into a pipe junction 5 subcatchments discharging into a major system segment 5 inlet groups discharging into a pipe 30 unit area hydrographs For other program constraints, please refer to the users manual Dual Drainage Storm Water Management Model (DDSWMM 2.1) Stantec Consulting Ltd., Ottawa, Ontario Riverside South, Block 84 - January 14, 2013 Second Submission RUN CONTROL PARAMETERS Measuring units Metric Time increment for calculation minutes Number of computational steps 288 Default limiting capacity of inlets Total simulation time l/s 47:50 (hrs:mins) Interval between printout 1 Calculation for the minor system is not included in this simulation Dual Drainage Storm Water Management Model (DDSWMM 2.1) Stantec Consulting Ltd., Ottawa, Ontario Page 1
45 a11-13_005.out Riverside South, Block 84 - January 14, 2013 Second Submission hours RAINFALL DATA Initial Julian Date Initial Time Time Rainfall Rainfall intensity (mm/hr) (hr:min) (mm/hr) 0.30E E E E E E+03 I I I I I I 0: I** I 0: I*** I 0: I**** I 0: I***** I 0: I************ I 0: I**************************************************I 1: I**************** I 1: I********* I 1: I****** I 1: I***** I 1: I**** I 1: I*** I 2: I*** I 2: I*** I 2: I** I 2: I** I 2: I** I 2: I** I I I I I I I 0.30E E E E E E+03 Rainfall duration 3: 0 (hrs:mins.) Dual Drainage Storm Water Management Model (DDSWMM 2.1) Page 2
46 a11-13_005.out Stantec Consulting Ltd., Ottawa, Ontario Riverside South, Block 84 - January 14, 2013 Second Submission MAJOR SYSTEM RATING CURVE Type Pavement Pavement Height Manning Long. Shoulder Shoulder Maximum Width Cross of (n) Slope Cross Roughness Flow (m) Slope Curb (m/m) Slope (n) Depth (m/m) (cm) (m/m) (cm) RATING CURVE Depth Flow Spread (cm) (cms) (m) Dual Drainage Storm Water Management Model (DDSWMM 2.1) Stantec Consulting Ltd., Ottawa, Ontario Riverside South, Block 84 - January 14, 2013 Second Submission Page 3
47 a11-13_005.out MAJOR SYSTEM RATING CURVE Type Pavement Pavement Height Manning Long. Shoulder Shoulder Maximum Width Cross of (n) Slope Cross Roughness Flow (m) Slope Curb (m/m) Slope (n) Depth (m/m) (cm) (m/m) (cm) RATING CURVE Depth Flow Spread (cm) (cms) (m) Dual Drainage Storm Water Management Model (DDSWMM 2.1) Stantec Consulting Ltd., Ottawa, Ontario Riverside South, Block 84 - January 14, 2013 Second Submission MAJOR SYSTEM RATING CURVE Type Pavement Pavement Height Manning Long. Shoulder Shoulder Maximum Width Cross of (n) Slope Cross Roughness Flow Page 4
48 Depth (cm) a11-13_005.out (m) Slope Curb (m/m) Slope (n) (m/m) (cm) (m/m) RATING CURVE Depth Flow Spread (cm) (cms) (m) Dual Drainage Storm Water Management Model (DDSWMM 2.1) Stantec Consulting Ltd., Ottawa, Ontario Riverside South, Block 84 - January 14, 2013 Second Submission MAJOR SYSTEM RATING CURVE Type Pavement Pavement Height Manning Long. Shoulder Shoulder Maximum Width Cross of (n) Slope Cross Roughness Flow (m) Slope Curb (m/m) Slope (n) Depth (m/m) (cm) (m/m) (cm) Page 5
49 a11-13_005.out RATING CURVE Depth Flow Spread (cm) (cms) (m) Dual Drainage Storm Water Management Model (DDSWMM 2.1) Stantec Consulting Ltd., Ottawa, Ontario Riverside South, Block 84 - January 14, 2013 Second Submission 1 Normal Inlet STORM INLET DATA Inlet Identification No. 1 No. of Points on Capture Curve 2 Inlet Capture Relationship Approach Flow (l/s) Inlet Flow (l/s) Storage Inlet Page 6
50 a11-13_005.out Inlet Identification No. 2 Maximum Storage cu.m. No. of Points on Storage-Capture Curve 3 Storage-Inlet Capture Relationship Storage Volume (cu.m) Inlet Flow (l/s) Storage Inlet Inlet Identification No. 3 Maximum Storage 6.90 cu.m. No. of Points on Storage-Capture Curve 3 Storage-Inlet Capture Relationship Storage Volume (cu.m) Inlet Flow (l/s) Storage Inlet Inlet Identification No. 4 Maximum Storage cu.m. No. of Points on Storage-Capture Curve 3 Storage-Inlet Capture Relationship Storage Volume (cu.m) Inlet Flow (l/s) Storage Inlet Page 7
51 a11-13_005.out Inlet Identification No. 5 Maximum Storage cu.m. No. of Points on Storage-Capture Curve 3 Storage-Inlet Capture Relationship Storage Volume (cu.m) Inlet Flow (l/s) Storage Inlet Inlet Identification No. 6 Maximum Storage 2.20 cu.m. No. of Points on Storage-Capture Curve 3 Storage-Inlet Capture Relationship Storage Volume (cu.m) Inlet Flow (l/s) Storage Inlet Inlet Identification No. 7 Maximum Storage 5.90 cu.m. No. of Points on Storage-Capture Curve 3 Storage-Inlet Capture Relationship Storage Volume (cu.m) Inlet Flow (l/s) Storage Inlet Page 8
52 a11-13_005.out Inlet Identification No. 8 Maximum Storage cu.m. No. of Points on Storage-Capture Curve 3 Storage-Inlet Capture Relationship Storage Volume (cu.m) Inlet Flow (l/s) Storage Inlet Inlet Identification No. 9 Maximum Storage cu.m. No. of Points on Storage-Capture Curve 3 Storage-Inlet Capture Relationship Storage Volume (cu.m) Inlet Flow (l/s) Storage Inlet Inlet Identification No. 10 Maximum Storage 6.10 cu.m. No. of Points on Storage-Capture Curve 3 Storage-Inlet Capture Relationship Storage Volume (cu.m) Inlet Flow (l/s) Dual Drainage Storm Water Management Model (DDSWMM 2.1) Stantec Consulting Ltd., Ottawa, Ontario Page 9
53 a11-13_005.out Riverside South, Block 84 - January 14, 2013 Second Submission MAJOR SYSTEM DATA Flow History (?) Limiting Street D/S Length Type No. of Inlet Inlet Connecting Segment Segment (m) C.B. Type Capture Pipe/EXTRAN (l/s) Inlet 1 EX-1 POPLIN * 0.00 NONE YES 2 ST103A POPLIN *** YES 3 ST104A ST103A *** YES 4 ST106A ST104A *** YES 5 ST107A POPLIN *** YES 6 ST108A ST107A *** YES 7 ST109A ST107A *** YES 8 ST111A ST107A *** YES 9 ST111B ST107A *** YES 10 ST112A ST103A *** YES * Normal Inlet. ** Storage Inlet with linear relationship between Storage and Inlet Capture. *** Storage Inlet with user-specified relationship between Storage and Inlet Capture. Total Number of Street segments 10 Total Length of Major System m Total Number of Inlet C.B. 9 Average Distance Between Inlets m Outlets From Major System Outlet I.D. POPLIN1 POPLIN2 POPLIN3 Page 10
54 a11-13_005.out Total Number of Outlets from Major System = 3 No. of Detention Structures 0 Dual Drainage Storm Water Management Model (DDSWMM 2.1) Stantec Consulting Ltd., Ottawa, Ontario Riverside South, Block 84 - January 14, 2013 Second Submission Infiltration Parameters SUB-CATCHMENT/SURFACE RUNOFF DATA Max. Infiltration Rate Min. Infiltration Rate Decay Rate mm/hr mm/hr /sec. Unit Area Hydrograph (UAH) Data No Unit Area Hydrograph Data SUB-CATCHMENT DATA No. Subarea Street Area Imp. Manning Manning Slope Width Dep. Storage Flow Segment (Ha.) (%) (N) (N) (m/m) (m) Imp. Perv. History (mm) (mm) (?) (Imp.) (Perv.) 1 EX-1 EX NO 2 ST103A ST103A NO 3 ST104A ST104A NO 4 ST106A ST106A NO 5 ST107A ST107A NO 6 ST108A ST108A NO 7 ST109A ST109A NO 8 ST111A ST111A NO 9 ST111B ST111B NO 10 ST112A ST112A NO Page 11
55 a11-13_005.out * Inflow Hydrograph Input Directly ** Inflow hydrograph Input in terms of flow per unit area Total Drainage Area 1.60 Hectares Number of Subcatchments 10 Dual Drainage Storm Water Management Model (DDSWMM 2.1) Stantec Consulting Ltd., Ottawa, Ontario Riverside South, Block 84 - January 14, 2013 Second Submission Simulation Details - Surface Runoff - 10 Subareas count Subarea 1 EX-1 2 ST103A 3 ST104A 4 ST106A 5 ST107A 6 ST108A 7 ST109A 8 ST111A 9 ST111B 10 ST112A Dual Drainage Storm Water Management Model (DDSWMM 2.1) Stantec Consulting Ltd., Ottawa, Ontario Riverside South, Block 84 - January 14, 2013 Second Submission Simulation Details - Major System - 13 Segments/Outlets count order segment time step No. of Max. flow Max. depth (min.) time steps (cms) (cm) 1 4 ST106A ST111B ST111A ST109A ST108A ST112A ST104A Page 12
56 a11-13_005.out 8 5 ST107A ST103A EX POPLIN POPLIN POPLIN Dual Drainage Storm Water Management Model (DDSWMM 2.1) Stantec Consulting Ltd., Ottawa, Ontario Riverside South, Block 84 - January 14, 2013 Second Submission EXTRAN Interface File Information ================================= Inlet flows are stored at the following 9 inlets (EXTRAN nodes): NONE DDSWMM-EXTRAN Connectivity EXTRAN Inlet DDSWMM Inlets (Major System Segments) NONE EX ST103A 104 ST104A 106 ST106A 107 ST107A 108 ST108A 109 ST109A 111 ST111A ST111B 112 ST112A Dual Drainage Storm Water Management Model (DDSWMM 2.1) Stantec Consulting Ltd., Ottawa, Ontario Riverside South, Block 84 - January 14, 2013 Second Submission MAJOR SYSTEM SUMMARY OF SIMULATION RESULTS No. Segment Peak Peak Max. Max. Inlet D/S Max. Flow Time Depth Capture Restriction Pipe Storage (cms) (hr:min.) (cm) (l/s) (?) Page 13
57 (cu.m.) a11-13_005.out 1 EX : NONE ST103A : N/A ST104A : N/A ST106A : N/A ST107A : N/A ST108A : N/A ST109A : N/A ST111A : N/A ST111B : N/A ST112A : N/A *** SIMULATION ENDED NORMALLY *** *********************************************************** * * * Simulation Starting Date January 11, 13 * * Time 10:13:39.47 * * * * Simulation Ending Date January 11, 13 * * Time 10:13:50.19 * * * * Duration of Simulation 0.18 Minutes * * * *********************************************************** Data Files Input Data File Name Ouput File Name EXTRAN Interface (ASCII) File Name a11-13.dat a11-13_005.out a11-13_005.int Page 14
58 Appendix A3 Input/Output Files: 100 Year, 3hr Chicago Storm
59 a11-13_100.out *************************************************** * D D S W M M (release 2.1) * * The Dual Drainage Storm Water Management Model * * Copyright * * * * AMK Associates International Ltd. * *************************************************** August, 2004 Stantec Consulting Ltd. Ottawa, Ontario (S/N DM ) This release of DDSWMM will run with a maximum of 500 minor system segments (pipes), including outlets 500 major system (street) segments, including outlets 500 subcatchments 30 storage units for the minor system 30 storage units for the major system 300 computational time steps 300 increments for rainfall hyetograph 50 storm inlet types 20 points describing the inlet capture curve 50 major system segment types 5 street segments discharging into a street junction 5 pipes discharging into a pipe junction 5 subcatchments discharging into a major system segment 5 inlet groups discharging into a pipe 30 unit area hydrographs For other program constraints, please refer to the users manual Dual Drainage Storm Water Management Model (DDSWMM 2.1) Stantec Consulting Ltd., Ottawa, Ontario Riverside South, Block 84 - January 14, 2013 Second Submission RUN CONTROL PARAMETERS Measuring units Metric Time increment for calculation minutes Number of computational steps 288 Default limiting capacity of inlets Total simulation time l/s 47:50 (hrs:mins) Interval between printout 1 Calculation for the minor system is not included in this simulation Dual Drainage Storm Water Management Model (DDSWMM 2.1) Stantec Consulting Ltd., Ottawa, Ontario Page 1
60 a11-13_100.out Riverside South, Block 84 - January 14, 2013 Second Submission hours RAINFALL DATA Initial Julian Date Initial Time Time Rainfall Rainfall intensity (mm/hr) (hr:min) (mm/hr) 0.49E E E E E E+03 I I I I I I 0: I** I 0: I*** I 0: I*** I 0: I***** I 0: I************ I 0: I**************************************************I 1: I**************** I 1: I******** I 1: I****** I 1: I**** I 1: I**** I 1: I*** I 2: I*** I 2: I*** I 2: I** I 2: I** I 2: I** I 2: I** I I I I I I I 0.49E E E E E E+03 Rainfall duration 3: 0 (hrs:mins.) Dual Drainage Storm Water Management Model (DDSWMM 2.1) Page 2
61 a11-13_100.out Stantec Consulting Ltd., Ottawa, Ontario Riverside South, Block 84 - January 14, 2013 Second Submission MAJOR SYSTEM RATING CURVE Type Pavement Pavement Height Manning Long. Shoulder Shoulder Maximum Width Cross of (n) Slope Cross Roughness Flow (m) Slope Curb (m/m) Slope (n) Depth (m/m) (cm) (m/m) (cm) RATING CURVE Depth Flow Spread (cm) (cms) (m) Dual Drainage Storm Water Management Model (DDSWMM 2.1) Stantec Consulting Ltd., Ottawa, Ontario Riverside South, Block 84 - January 14, 2013 Second Submission Page 3
62 a11-13_100.out MAJOR SYSTEM RATING CURVE Type Pavement Pavement Height Manning Long. Shoulder Shoulder Maximum Width Cross of (n) Slope Cross Roughness Flow (m) Slope Curb (m/m) Slope (n) Depth (m/m) (cm) (m/m) (cm) RATING CURVE Depth Flow Spread (cm) (cms) (m) Dual Drainage Storm Water Management Model (DDSWMM 2.1) Stantec Consulting Ltd., Ottawa, Ontario Riverside South, Block 84 - January 14, 2013 Second Submission MAJOR SYSTEM RATING CURVE Type Pavement Pavement Height Manning Long. Shoulder Shoulder Maximum Width Cross of (n) Slope Cross Roughness Flow Page 4
63 Depth (cm) a11-13_100.out (m) Slope Curb (m/m) Slope (n) (m/m) (cm) (m/m) RATING CURVE Depth Flow Spread (cm) (cms) (m) Dual Drainage Storm Water Management Model (DDSWMM 2.1) Stantec Consulting Ltd., Ottawa, Ontario Riverside South, Block 84 - January 14, 2013 Second Submission MAJOR SYSTEM RATING CURVE Type Pavement Pavement Height Manning Long. Shoulder Shoulder Maximum Width Cross of (n) Slope Cross Roughness Flow (m) Slope Curb (m/m) Slope (n) Depth (m/m) (cm) (m/m) (cm) Page 5
64 a11-13_100.out RATING CURVE Depth Flow Spread (cm) (cms) (m) Dual Drainage Storm Water Management Model (DDSWMM 2.1) Stantec Consulting Ltd., Ottawa, Ontario Riverside South, Block 84 - January 14, 2013 Second Submission 1 Normal Inlet STORM INLET DATA Inlet Identification No. 1 No. of Points on Capture Curve 2 Inlet Capture Relationship Approach Flow (l/s) Inlet Flow (l/s) Storage Inlet Page 6
65 a11-13_100.out Inlet Identification No. 2 Maximum Storage cu.m. No. of Points on Storage-Capture Curve 3 Storage-Inlet Capture Relationship Storage Volume (cu.m) Inlet Flow (l/s) Storage Inlet Inlet Identification No. 3 Maximum Storage 6.90 cu.m. No. of Points on Storage-Capture Curve 3 Storage-Inlet Capture Relationship Storage Volume (cu.m) Inlet Flow (l/s) Storage Inlet Inlet Identification No. 4 Maximum Storage cu.m. No. of Points on Storage-Capture Curve 3 Storage-Inlet Capture Relationship Storage Volume (cu.m) Inlet Flow (l/s) Storage Inlet Page 7
66 a11-13_100.out Inlet Identification No. 5 Maximum Storage cu.m. No. of Points on Storage-Capture Curve 3 Storage-Inlet Capture Relationship Storage Volume (cu.m) Inlet Flow (l/s) Storage Inlet Inlet Identification No. 6 Maximum Storage 2.20 cu.m. No. of Points on Storage-Capture Curve 3 Storage-Inlet Capture Relationship Storage Volume (cu.m) Inlet Flow (l/s) Storage Inlet Inlet Identification No. 7 Maximum Storage 5.90 cu.m. No. of Points on Storage-Capture Curve 3 Storage-Inlet Capture Relationship Storage Volume (cu.m) Inlet Flow (l/s) Storage Inlet Page 8
67 a11-13_100.out Inlet Identification No. 8 Maximum Storage cu.m. No. of Points on Storage-Capture Curve 3 Storage-Inlet Capture Relationship Storage Volume (cu.m) Inlet Flow (l/s) Storage Inlet Inlet Identification No. 9 Maximum Storage cu.m. No. of Points on Storage-Capture Curve 3 Storage-Inlet Capture Relationship Storage Volume (cu.m) Inlet Flow (l/s) Storage Inlet Inlet Identification No. 10 Maximum Storage 6.10 cu.m. No. of Points on Storage-Capture Curve 3 Storage-Inlet Capture Relationship Storage Volume (cu.m) Inlet Flow (l/s) Dual Drainage Storm Water Management Model (DDSWMM 2.1) Stantec Consulting Ltd., Ottawa, Ontario Page 9
68 a11-13_100.out Riverside South, Block 84 - January 14, 2013 Second Submission MAJOR SYSTEM DATA Flow History (?) Limiting Street D/S Length Type No. of Inlet Inlet Connecting Segment Segment (m) C.B. Type Capture Pipe/EXTRAN (l/s) Inlet 1 EX-1 POPLIN * 0.00 NONE YES 2 ST103A POPLIN *** YES 3 ST104A ST103A *** YES 4 ST106A ST104A *** YES 5 ST107A POPLIN *** YES 6 ST108A ST107A *** YES 7 ST109A ST107A *** YES 8 ST111A ST107A *** YES 9 ST111B ST107A *** YES 10 ST112A ST103A *** YES * Normal Inlet. ** Storage Inlet with linear relationship between Storage and Inlet Capture. *** Storage Inlet with user-specified relationship between Storage and Inlet Capture. Total Number of Street segments 10 Total Length of Major System m Total Number of Inlet C.B. 9 Average Distance Between Inlets m Outlets From Major System Outlet I.D. POPLIN1 POPLIN2 POPLIN3 Page 10
69 a11-13_100.out Total Number of Outlets from Major System = 3 No. of Detention Structures 0 Dual Drainage Storm Water Management Model (DDSWMM 2.1) Stantec Consulting Ltd., Ottawa, Ontario Riverside South, Block 84 - January 14, 2013 Second Submission Infiltration Parameters SUB-CATCHMENT/SURFACE RUNOFF DATA Max. Infiltration Rate Min. Infiltration Rate Decay Rate mm/hr mm/hr /sec. Unit Area Hydrograph (UAH) Data No Unit Area Hydrograph Data SUB-CATCHMENT DATA No. Subarea Street Area Imp. Manning Manning Slope Width Dep. Storage Flow Segment (Ha.) (%) (N) (N) (m/m) (m) Imp. Perv. History (mm) (mm) (?) (Imp.) (Perv.) 1 EX-1 EX NO 2 ST103A ST103A NO 3 ST104A ST104A NO 4 ST106A ST106A NO 5 ST107A ST107A NO 6 ST108A ST108A NO 7 ST109A ST109A NO 8 ST111A ST111A NO 9 ST111B ST111B NO 10 ST112A ST112A NO Page 11
70 a11-13_100.out * Inflow Hydrograph Input Directly ** Inflow hydrograph Input in terms of flow per unit area Total Drainage Area 1.60 Hectares Number of Subcatchments 10 Dual Drainage Storm Water Management Model (DDSWMM 2.1) Stantec Consulting Ltd., Ottawa, Ontario Riverside South, Block 84 - January 14, 2013 Second Submission Simulation Details - Surface Runoff - 10 Subareas count Subarea 1 EX-1 2 ST103A 3 ST104A 4 ST106A 5 ST107A 6 ST108A 7 ST109A 8 ST111A 9 ST111B 10 ST112A Dual Drainage Storm Water Management Model (DDSWMM 2.1) Stantec Consulting Ltd., Ottawa, Ontario Riverside South, Block 84 - January 14, 2013 Second Submission Simulation Details - Major System - 13 Segments/Outlets count order segment time step No. of Max. flow Max. depth (min.) time steps (cms) (cm) 1 4 ST106A ST111B ST111A ST109A ST108A ST112A ST104A Page 12
71 a11-13_100.out 8 5 ST107A ST103A EX POPLIN POPLIN POPLIN Dual Drainage Storm Water Management Model (DDSWMM 2.1) Stantec Consulting Ltd., Ottawa, Ontario Riverside South, Block 84 - January 14, 2013 Second Submission EXTRAN Interface File Information ================================= Inlet flows are stored at the following 9 inlets (EXTRAN nodes): NONE DDSWMM-EXTRAN Connectivity EXTRAN Inlet DDSWMM Inlets (Major System Segments) NONE EX ST103A 104 ST104A 106 ST106A 107 ST107A 108 ST108A 109 ST109A 111 ST111A ST111B 112 ST112A Dual Drainage Storm Water Management Model (DDSWMM 2.1) Stantec Consulting Ltd., Ottawa, Ontario Riverside South, Block 84 - January 14, 2013 Second Submission MAJOR SYSTEM SUMMARY OF SIMULATION RESULTS No. Segment Peak Peak Max. Max. Inlet D/S Max. Flow Time Depth Capture Restriction Pipe Storage (cms) (hr:min.) (cm) (l/s) (?) (cu.m.) Page 13
72 a11-13_100.out 1 EX : NONE ST103A : N/A ST104A : N/A ST106A : N/A ST107A : N/A ST108A : N/A ST109A : N/A ST111A : N/A ST111B : N/A ST112A : N/A *** SIMULATION ENDED NORMALLY *** *********************************************************** * * * Simulation Starting Date January 11, 13 * * Time 10:04:56.64 * * * * Simulation Ending Date January 11, 13 * * Time 10:05:31.65 * * * * Duration of Simulation 0.58 Minutes * * * *********************************************************** Data Files Input Data File Name Ouput File Name EXTRAN Interface (ASCII) File Name a11-13.dat a11-13_100.out a11-13_100.int Page 14
73 Appendix A4 Input/Output Files: July 1 st, 1979 Historical Storm
74 a11-13_1979.out *************************************************** * D D S W M M (release 2.1) * * The Dual Drainage Storm Water Management Model * * Copyright * * * * AMK Associates International Ltd. * *************************************************** August, 2004 Stantec Consulting Ltd. Ottawa, Ontario (S/N DM ) This release of DDSWMM will run with a maximum of 500 minor system segments (pipes), including outlets 500 major system (street) segments, including outlets 500 subcatchments 30 storage units for the minor system 30 storage units for the major system 300 computational time steps 300 increments for rainfall hyetograph 50 storm inlet types 20 points describing the inlet capture curve 50 major system segment types 5 street segments discharging into a street junction 5 pipes discharging into a pipe junction 5 subcatchments discharging into a major system segment 5 inlet groups discharging into a pipe 30 unit area hydrographs For other program constraints, please refer to the users manual Dual Drainage Storm Water Management Model (DDSWMM 2.1) Stantec Consulting Ltd., Ottawa, Ontario Riverside South, Block 84 - January 14, 2013 Second Submission RUN CONTROL PARAMETERS Measuring units Metric Time increment for calculation minutes Number of computational steps 288 Default limiting capacity of inlets Total simulation time l/s 47:50 (hrs:mins) Interval between printout 1 Calculation for the minor system is not included in this simulation Dual Drainage Storm Water Management Model (DDSWMM 2.1) Stantec Consulting Ltd., Ottawa, Ontario Page 1
75 a11-13_1979.out Riverside South, Block 84 - January 14, 2013 Second Submission hours RAINFALL DATA Initial Julian Date Initial Time Time Rainfall Rainfall intensity (mm/hr) (hr:min) (mm/hr) 0.00E E E E E E+03 I I I I I I 0: I* I 0: I** I 0: I***** I 0: I***** I 0: I****************** I 0: I****************** I 1: I****************** I 1: I************************ I 1: I************************************ I 1: I**************************************************I 1: I********************************** I 1: I*************** I 2: I*************** I 2: I** I 2: I** I 2: I** I 2: I** I 2: I** I I I I I I I 0.00E E E E E E+03 Rainfall duration 3: 0 (hrs:mins.) Dual Drainage Storm Water Management Model (DDSWMM 2.1) Page 2
76 a11-13_1979.out Stantec Consulting Ltd., Ottawa, Ontario Riverside South, Block 84 - January 14, 2013 Second Submission MAJOR SYSTEM RATING CURVE Type Pavement Pavement Height Manning Long. Shoulder Shoulder Maximum Width Cross of (n) Slope Cross Roughness Flow (m) Slope Curb (m/m) Slope (n) Depth (m/m) (cm) (m/m) (cm) RATING CURVE Depth Flow Spread (cm) (cms) (m) Dual Drainage Storm Water Management Model (DDSWMM 2.1) Stantec Consulting Ltd., Ottawa, Ontario Riverside South, Block 84 - January 14, 2013 Second Submission Page 3
77 a11-13_1979.out MAJOR SYSTEM RATING CURVE Type Pavement Pavement Height Manning Long. Shoulder Shoulder Maximum Width Cross of (n) Slope Cross Roughness Flow (m) Slope Curb (m/m) Slope (n) Depth (m/m) (cm) (m/m) (cm) RATING CURVE Depth Flow Spread (cm) (cms) (m) Dual Drainage Storm Water Management Model (DDSWMM 2.1) Stantec Consulting Ltd., Ottawa, Ontario Riverside South, Block 84 - January 14, 2013 Second Submission MAJOR SYSTEM RATING CURVE Type Pavement Pavement Height Manning Long. Shoulder Shoulder Maximum Width Cross of (n) Slope Cross Roughness Flow Page 4
78 Depth (cm) a11-13_1979.out (m) Slope Curb (m/m) Slope (n) (m/m) (cm) (m/m) RATING CURVE Depth Flow Spread (cm) (cms) (m) Dual Drainage Storm Water Management Model (DDSWMM 2.1) Stantec Consulting Ltd., Ottawa, Ontario Riverside South, Block 84 - January 14, 2013 Second Submission MAJOR SYSTEM RATING CURVE Type Pavement Pavement Height Manning Long. Shoulder Shoulder Maximum Width Cross of (n) Slope Cross Roughness Flow (m) Slope Curb (m/m) Slope (n) Depth (m/m) (cm) (m/m) (cm) Page 5
79 a11-13_1979.out RATING CURVE Depth Flow Spread (cm) (cms) (m) Dual Drainage Storm Water Management Model (DDSWMM 2.1) Stantec Consulting Ltd., Ottawa, Ontario Riverside South, Block 84 - January 14, 2013 Second Submission 1 Normal Inlet STORM INLET DATA Inlet Identification No. 1 No. of Points on Capture Curve 2 Inlet Capture Relationship Approach Flow (l/s) Inlet Flow (l/s) Storage Inlet Page 6
80 a11-13_1979.out Inlet Identification No. 2 Maximum Storage cu.m. No. of Points on Storage-Capture Curve 3 Storage-Inlet Capture Relationship Storage Volume (cu.m) Inlet Flow (l/s) Storage Inlet Inlet Identification No. 3 Maximum Storage 6.90 cu.m. No. of Points on Storage-Capture Curve 3 Storage-Inlet Capture Relationship Storage Volume (cu.m) Inlet Flow (l/s) Storage Inlet Inlet Identification No. 4 Maximum Storage cu.m. No. of Points on Storage-Capture Curve 3 Storage-Inlet Capture Relationship Storage Volume (cu.m) Inlet Flow (l/s) Storage Inlet Page 7
81 a11-13_1979.out Inlet Identification No. 5 Maximum Storage cu.m. No. of Points on Storage-Capture Curve 3 Storage-Inlet Capture Relationship Storage Volume (cu.m) Inlet Flow (l/s) Storage Inlet Inlet Identification No. 6 Maximum Storage 2.20 cu.m. No. of Points on Storage-Capture Curve 3 Storage-Inlet Capture Relationship Storage Volume (cu.m) Inlet Flow (l/s) Storage Inlet Inlet Identification No. 7 Maximum Storage 5.90 cu.m. No. of Points on Storage-Capture Curve 3 Storage-Inlet Capture Relationship Storage Volume (cu.m) Inlet Flow (l/s) Storage Inlet Page 8
82 a11-13_1979.out Inlet Identification No. 8 Maximum Storage cu.m. No. of Points on Storage-Capture Curve 3 Storage-Inlet Capture Relationship Storage Volume (cu.m) Inlet Flow (l/s) Storage Inlet Inlet Identification No. 9 Maximum Storage cu.m. No. of Points on Storage-Capture Curve 3 Storage-Inlet Capture Relationship Storage Volume (cu.m) Inlet Flow (l/s) Storage Inlet Inlet Identification No. 10 Maximum Storage 6.10 cu.m. No. of Points on Storage-Capture Curve 3 Storage-Inlet Capture Relationship Storage Volume (cu.m) Inlet Flow (l/s) Dual Drainage Storm Water Management Model (DDSWMM 2.1) Stantec Consulting Ltd., Ottawa, Ontario Page 9
83 a11-13_1979.out Riverside South, Block 84 - January 14, 2013 Second Submission MAJOR SYSTEM DATA Flow History (?) Limiting Street D/S Length Type No. of Inlet Inlet Connecting Segment Segment (m) C.B. Type Capture Pipe/EXTRAN (l/s) Inlet 1 EX-1 POPLIN * 0.00 NONE YES 2 ST103A POPLIN *** YES 3 ST104A ST103A *** YES 4 ST106A ST104A *** YES 5 ST107A POPLIN *** YES 6 ST108A ST107A *** YES 7 ST109A ST107A *** YES 8 ST111A ST107A *** YES 9 ST111B ST107A *** YES 10 ST112A ST103A *** YES * Normal Inlet. ** Storage Inlet with linear relationship between Storage and Inlet Capture. *** Storage Inlet with user-specified relationship between Storage and Inlet Capture. Total Number of Street segments 10 Total Length of Major System m Total Number of Inlet C.B. 9 Average Distance Between Inlets m Outlets From Major System Outlet I.D. POPLIN1 POPLIN2 POPLIN3 Page 10
84 a11-13_1979.out Total Number of Outlets from Major System = 3 No. of Detention Structures 0 Dual Drainage Storm Water Management Model (DDSWMM 2.1) Stantec Consulting Ltd., Ottawa, Ontario Riverside South, Block 84 - January 14, 2013 Second Submission Infiltration Parameters SUB-CATCHMENT/SURFACE RUNOFF DATA Max. Infiltration Rate Min. Infiltration Rate Decay Rate mm/hr mm/hr /sec. Unit Area Hydrograph (UAH) Data No Unit Area Hydrograph Data SUB-CATCHMENT DATA No. Subarea Street Area Imp. Manning Manning Slope Width Dep. Storage Flow Segment (Ha.) (%) (N) (N) (m/m) (m) Imp. Perv. History (mm) (mm) (?) (Imp.) (Perv.) 1 EX-1 EX NO 2 ST103A ST103A NO 3 ST104A ST104A NO 4 ST106A ST106A NO 5 ST107A ST107A NO 6 ST108A ST108A NO 7 ST109A ST109A NO 8 ST111A ST111A NO 9 ST111B ST111B NO 10 ST112A ST112A NO Page 11
85 a11-13_1979.out * Inflow Hydrograph Input Directly ** Inflow hydrograph Input in terms of flow per unit area Total Drainage Area 1.60 Hectares Number of Subcatchments 10 Dual Drainage Storm Water Management Model (DDSWMM 2.1) Stantec Consulting Ltd., Ottawa, Ontario Riverside South, Block 84 - January 14, 2013 Second Submission Simulation Details - Surface Runoff - 10 Subareas count Subarea 1 EX-1 2 ST103A 3 ST104A 4 ST106A 5 ST107A 6 ST108A 7 ST109A 8 ST111A 9 ST111B 10 ST112A Dual Drainage Storm Water Management Model (DDSWMM 2.1) Stantec Consulting Ltd., Ottawa, Ontario Riverside South, Block 84 - January 14, 2013 Second Submission Simulation Details - Major System - 13 Segments/Outlets count order segment time step No. of Max. flow Max. depth (min.) time steps (cms) (cm) 1 4 ST106A ST111B ST111A ST109A ST108A ST112A ST104A Page 12
86 a11-13_1979.out 8 5 ST107A ST103A EX POPLIN POPLIN POPLIN Dual Drainage Storm Water Management Model (DDSWMM 2.1) Stantec Consulting Ltd., Ottawa, Ontario Riverside South, Block 84 - January 14, 2013 Second Submission EXTRAN Interface File Information ================================= Inlet flows are stored at the following 9 inlets (EXTRAN nodes): NONE DDSWMM-EXTRAN Connectivity EXTRAN Inlet DDSWMM Inlets (Major System Segments) NONE EX ST103A 104 ST104A 106 ST106A 107 ST107A 108 ST108A 109 ST109A 111 ST111A ST111B 112 ST112A Dual Drainage Storm Water Management Model (DDSWMM 2.1) Stantec Consulting Ltd., Ottawa, Ontario Riverside South, Block 84 - January 14, 2013 Second Submission MAJOR SYSTEM SUMMARY OF SIMULATION RESULTS No. Segment Peak Peak Max. Max. Inlet D/S Max. Flow Time Depth Capture Restriction Pipe Storage (cms) (hr:min.) (cm) (l/s) (?) (cu.m.) Page 13
87 a11-13_1979.out 1 EX : NONE ST103A : N/A ST104A : N/A ST106A : N/A ST107A : N/A ST108A : N/A ST109A : N/A ST111A : N/A ST111B : N/A ST112A : N/A *** SIMULATION ENDED NORMALLY *** *********************************************************** * * * Simulation Starting Date January 11, 13 * * Time 10:25:06.92 * * * * Simulation Ending Date January 11, 13 * * Time 10:25:16.66 * * * * Duration of Simulation 0.16 Minutes * * * *********************************************************** Data Files Input Data File Name Ouput File Name EXTRAN Interface (ASCII) File Name a11-13.dat a11-13_1979.out a11-13_1979.int Page 14
88 Appendix A5 Input/Output Files: 100 Year, 3hr Chicago Storm Increased by 20%
89 a11-13_100+20%.out *************************************************** * D D S W M M (release 2.1) * * The Dual Drainage Storm Water Management Model * * Copyright * * * * AMK Associates International Ltd. * *************************************************** August, 2004 Stantec Consulting Ltd. Ottawa, Ontario (S/N DM ) This release of DDSWMM will run with a maximum of 500 minor system segments (pipes), including outlets 500 major system (street) segments, including outlets 500 subcatchments 30 storage units for the minor system 30 storage units for the major system 300 computational time steps 300 increments for rainfall hyetograph 50 storm inlet types 20 points describing the inlet capture curve 50 major system segment types 5 street segments discharging into a street junction 5 pipes discharging into a pipe junction 5 subcatchments discharging into a major system segment 5 inlet groups discharging into a pipe 30 unit area hydrographs For other program constraints, please refer to the users manual Dual Drainage Storm Water Management Model (DDSWMM 2.1) Stantec Consulting Ltd., Ottawa, Ontario Riverside South, Block 84 - January 14, 2013 Second Submission RUN CONTROL PARAMETERS Measuring units Metric Time increment for calculation minutes Number of computational steps 288 Default limiting capacity of inlets Total simulation time l/s 47:50 (hrs:mins) Interval between printout 1 Calculation for the minor system is not included in this simulation Dual Drainage Storm Water Management Model (DDSWMM 2.1) Stantec Consulting Ltd., Ottawa, Ontario Page 1
90 a11-13_100+20%.out Riverside South, Block 84 - January 14, 2013 Second Submission hours RAINFALL DATA Initial Julian Date Initial Time Time Rainfall Rainfall intensity (mm/hr) (hr:min) (mm/hr) 0.59E E E E E E+03 I I I I I I 0: I** I 0: I*** I 0: I*** I 0: I***** I 0: I************ I 0: I**************************************************I 1: I**************** I 1: I******** I 1: I****** I 1: I**** I 1: I**** I 1: I*** I 2: I*** I 2: I*** I 2: I** I 2: I** I 2: I** I 2: I** I I I I I I I 0.59E E E E E E+03 Rainfall duration 3: 0 (hrs:mins.) Dual Drainage Storm Water Management Model (DDSWMM 2.1) Page 2
91 a11-13_100+20%.out Stantec Consulting Ltd., Ottawa, Ontario Riverside South, Block 84 - January 14, 2013 Second Submission MAJOR SYSTEM RATING CURVE Type Pavement Pavement Height Manning Long. Shoulder Shoulder Maximum Width Cross of (n) Slope Cross Roughness Flow (m) Slope Curb (m/m) Slope (n) Depth (m/m) (cm) (m/m) (cm) RATING CURVE Depth Flow Spread (cm) (cms) (m) Dual Drainage Storm Water Management Model (DDSWMM 2.1) Stantec Consulting Ltd., Ottawa, Ontario Riverside South, Block 84 - January 14, 2013 Second Submission Page 3
92 a11-13_100+20%.out MAJOR SYSTEM RATING CURVE Type Pavement Pavement Height Manning Long. Shoulder Shoulder Maximum Width Cross of (n) Slope Cross Roughness Flow (m) Slope Curb (m/m) Slope (n) Depth (m/m) (cm) (m/m) (cm) RATING CURVE Depth Flow Spread (cm) (cms) (m) Dual Drainage Storm Water Management Model (DDSWMM 2.1) Stantec Consulting Ltd., Ottawa, Ontario Riverside South, Block 84 - January 14, 2013 Second Submission MAJOR SYSTEM RATING CURVE Type Pavement Pavement Height Manning Long. Shoulder Shoulder Maximum Width Cross of (n) Slope Cross Roughness Flow Page 4
93 Depth (cm) a11-13_100+20%.out (m) Slope Curb (m/m) Slope (n) (m/m) (cm) (m/m) RATING CURVE Depth Flow Spread (cm) (cms) (m) Dual Drainage Storm Water Management Model (DDSWMM 2.1) Stantec Consulting Ltd., Ottawa, Ontario Riverside South, Block 84 - January 14, 2013 Second Submission MAJOR SYSTEM RATING CURVE Type Pavement Pavement Height Manning Long. Shoulder Shoulder Maximum Width Cross of (n) Slope Cross Roughness Flow (m) Slope Curb (m/m) Slope (n) Depth (m/m) (cm) (m/m) (cm) Page 5
94 a11-13_100+20%.out RATING CURVE Depth Flow Spread (cm) (cms) (m) Dual Drainage Storm Water Management Model (DDSWMM 2.1) Stantec Consulting Ltd., Ottawa, Ontario Riverside South, Block 84 - January 14, 2013 Second Submission 1 Normal Inlet STORM INLET DATA Inlet Identification No. 1 No. of Points on Capture Curve 2 Inlet Capture Relationship Approach Flow (l/s) Inlet Flow (l/s) Storage Inlet Page 6
95 a11-13_100+20%.out Inlet Identification No. 2 Maximum Storage cu.m. No. of Points on Storage-Capture Curve 3 Storage-Inlet Capture Relationship Storage Volume (cu.m) Inlet Flow (l/s) Storage Inlet Inlet Identification No. 3 Maximum Storage 6.90 cu.m. No. of Points on Storage-Capture Curve 3 Storage-Inlet Capture Relationship Storage Volume (cu.m) Inlet Flow (l/s) Storage Inlet Inlet Identification No. 4 Maximum Storage cu.m. No. of Points on Storage-Capture Curve 3 Storage-Inlet Capture Relationship Storage Volume (cu.m) Inlet Flow (l/s) Storage Inlet Page 7
96 a11-13_100+20%.out Inlet Identification No. 5 Maximum Storage cu.m. No. of Points on Storage-Capture Curve 3 Storage-Inlet Capture Relationship Storage Volume (cu.m) Inlet Flow (l/s) Storage Inlet Inlet Identification No. 6 Maximum Storage 2.20 cu.m. No. of Points on Storage-Capture Curve 3 Storage-Inlet Capture Relationship Storage Volume (cu.m) Inlet Flow (l/s) Storage Inlet Inlet Identification No. 7 Maximum Storage 5.90 cu.m. No. of Points on Storage-Capture Curve 3 Storage-Inlet Capture Relationship Storage Volume (cu.m) Inlet Flow (l/s) Storage Inlet Page 8
97 a11-13_100+20%.out Inlet Identification No. 8 Maximum Storage cu.m. No. of Points on Storage-Capture Curve 3 Storage-Inlet Capture Relationship Storage Volume (cu.m) Inlet Flow (l/s) Storage Inlet Inlet Identification No. 9 Maximum Storage cu.m. No. of Points on Storage-Capture Curve 3 Storage-Inlet Capture Relationship Storage Volume (cu.m) Inlet Flow (l/s) Storage Inlet Inlet Identification No. 10 Maximum Storage 6.10 cu.m. No. of Points on Storage-Capture Curve 3 Storage-Inlet Capture Relationship Storage Volume (cu.m) Inlet Flow (l/s) Dual Drainage Storm Water Management Model (DDSWMM 2.1) Stantec Consulting Ltd., Ottawa, Ontario Page 9
98 a11-13_100+20%.out Riverside South, Block 84 - January 14, 2013 Second Submission MAJOR SYSTEM DATA Flow History (?) Limiting Street D/S Length Type No. of Inlet Inlet Connecting Segment Segment (m) C.B. Type Capture Pipe/EXTRAN (l/s) Inlet 1 EX-1 POPLIN * 0.00 NONE YES 2 ST103A POPLIN *** YES 3 ST104A ST103A *** YES 4 ST106A ST104A *** YES 5 ST107A POPLIN *** YES 6 ST108A ST107A *** YES 7 ST109A ST107A *** YES 8 ST111A ST107A *** YES 9 ST111B ST107A *** YES 10 ST112A ST103A *** YES * Normal Inlet. ** Storage Inlet with linear relationship between Storage and Inlet Capture. *** Storage Inlet with user-specified relationship between Storage and Inlet Capture. Total Number of Street segments 10 Total Length of Major System m Total Number of Inlet C.B. 9 Average Distance Between Inlets m Outlets From Major System Outlet I.D. POPLIN1 POPLIN2 POPLIN3 Page 10
99 a11-13_100+20%.out Total Number of Outlets from Major System = 3 No. of Detention Structures 0 Dual Drainage Storm Water Management Model (DDSWMM 2.1) Stantec Consulting Ltd., Ottawa, Ontario Riverside South, Block 84 - January 14, 2013 Second Submission Infiltration Parameters SUB-CATCHMENT/SURFACE RUNOFF DATA Max. Infiltration Rate Min. Infiltration Rate Decay Rate mm/hr mm/hr /sec. Unit Area Hydrograph (UAH) Data No Unit Area Hydrograph Data SUB-CATCHMENT DATA No. Subarea Street Area Imp. Manning Manning Slope Width Dep. Storage Flow Segment (Ha.) (%) (N) (N) (m/m) (m) Imp. Perv. History (mm) (mm) (?) (Imp.) (Perv.) 1 EX-1 EX NO 2 ST103A ST103A NO 3 ST104A ST104A NO 4 ST106A ST106A NO 5 ST107A ST107A NO 6 ST108A ST108A NO 7 ST109A ST109A NO 8 ST111A ST111A NO 9 ST111B ST111B NO 10 ST112A ST112A NO Page 11
100 a11-13_100+20%.out * Inflow Hydrograph Input Directly ** Inflow hydrograph Input in terms of flow per unit area Total Drainage Area 1.60 Hectares Number of Subcatchments 10 Dual Drainage Storm Water Management Model (DDSWMM 2.1) Stantec Consulting Ltd., Ottawa, Ontario Riverside South, Block 84 - January 14, 2013 Second Submission Simulation Details - Surface Runoff - 10 Subareas count Subarea 1 EX-1 2 ST103A 3 ST104A 4 ST106A 5 ST107A 6 ST108A 7 ST109A 8 ST111A 9 ST111B 10 ST112A Dual Drainage Storm Water Management Model (DDSWMM 2.1) Stantec Consulting Ltd., Ottawa, Ontario Riverside South, Block 84 - January 14, 2013 Second Submission Simulation Details - Major System - 13 Segments/Outlets count order segment time step No. of Max. flow Max. depth (min.) time steps (cms) (cm) 1 4 ST106A ST111B ST111A ST109A ST108A ST112A ST104A Page 12
101 a11-13_100+20%.out 8 5 ST107A ST103A EX POPLIN POPLIN POPLIN Dual Drainage Storm Water Management Model (DDSWMM 2.1) Stantec Consulting Ltd., Ottawa, Ontario Riverside South, Block 84 - January 14, 2013 Second Submission EXTRAN Interface File Information ================================= Inlet flows are stored at the following 9 inlets (EXTRAN nodes): NONE DDSWMM-EXTRAN Connectivity EXTRAN Inlet DDSWMM Inlets (Major System Segments) NONE EX ST103A 104 ST104A 106 ST106A 107 ST107A 108 ST108A 109 ST109A 111 ST111A ST111B 112 ST112A Dual Drainage Storm Water Management Model (DDSWMM 2.1) Stantec Consulting Ltd., Ottawa, Ontario Riverside South, Block 84 - January 14, 2013 Second Submission MAJOR SYSTEM SUMMARY OF SIMULATION RESULTS No. Segment Peak Peak Max. Max. Inlet D/S Max. Flow Time Depth Capture Restriction Pipe Storage (cms) (hr:min.) (cm) (l/s) (?) (cu.m.) Page 13
102 a11-13_100+20%.out 1 EX : NONE ST103A : N/A ST104A : N/A ST106A : N/A ST107A : N/A ST108A : N/A ST109A : N/A ST111A : N/A ST111B : N/A ST112A : N/A *** SIMULATION ENDED NORMALLY *** *********************************************************** * * * Simulation Starting Date January 11, 13 * * Time 10:21:08.70 * * * * Simulation Ending Date January 11, 13 * * Time 10:21:20.96 * * * * Duration of Simulation 0.20 Minutes * * * *********************************************************** Data Files Input Data File Name Ouput File Name EXTRAN Interface (ASCII) File Name a11-13.dat a11-13_100+20%.out a11-13_100+20%.int Page 14
103 Appendix A6 100 Year, 3hr Chicago XP-SWMM Modeling Parameters and Results
104 a11-13_100chi.out Current Directory: C:\XPS\XP-SWM~1.52 Engine Name: C:\XPS\XP-SWM~1.52\swmmengw.exe Read 1 line(s) and found 1 items(s) from your cfg file. Input File : E:\poplin\a11-13_100chi.XP *===============================================* XP-SWMM Storm and Wastewater Management Model Interface Version: 9.52A Engine Version: 9.28 =============================================== Developed by XP Software =============================================== XP Software November, 2004 Data File Version ---> 11.7 Serial Number: Stantec *===============================================* Engine Name: C:\XPS\XP-SWM~1.52\swmmengw.exe *====================================================* Input and Output file names by Layer *====================================================* Input File to Layer # Output File to Layer # 1 JOT.US 1 JOT.US *===========================================================* Special command line arguments in XP-SWMM2000. This now includes program defaults. $Keywords are the program defaults. Other Keywords are from the SWMMCOM.CFG file. or the command line or any cfg file on the command line. Examples include these in the file xpswm.bat under the section :solve or in the windows version XPSWMM32 in the file solve.bat Note: the cfg file should be in the subdirectory swmxp or defined by the set variable in the xpswm.bat file. Some examples of the command lines possible are shown below: swmmd swmmcom.cfg swmmd my.cfg swmmd nokeys nconv5 perv extranwq *===========================================================* $powerstation $perv $oldegg $as $noflat $oldomega Page 1
105 a11-13_100chi.out $oldvol $implicit $oldhot $oldscs $flood $nokeys $pzero $oldvol $storage $oldhot $pumpwt $ecloss $exout $spatial = $djref = $weirlen = $oldbnd $nogrelev $ncmid $new_nl_ $best $newbound $q_tol = $new_storage $old_iteration MINLEN= $review_elevation $use_half_volume $min_ts = $design_restart = on $zero_value=1.e $relax_depth = on *==========================================================* Parameter Values on the Tapes Common Block.These are the values read from the data file and dynamically allocated by the model for this simulation. *==========================================================* Number of Subcatchments in the Runoff Block (NW)... 0 Number of Channel/Pipes in the Runoff Block (NG)... 0 Runoff Water quality constituents (NRQ)... 0 Runoff Land Uses per Subcatchment (NLU)... 0 Number of Elements in the Transport Block (NET)... 0 Number of Storage Junctions in Transport (NTSE)... 0 Number of Input Hydrographs in Transport (NTH)... 0 Number of Elements in the Extran Block (NEE) Number of Groundwater Subcatchments in Runoff (NGW). 0 Number of Interface locations for all Blocks (NIE).. 16 Number of Pumps in Extran (NEP)... 0 Number of Orifices in Extran (NEO)... 0 Number of Tide Gates/Free Outfalls in Extran (NTG).. 1 Number of Extran Weirs (NEW)... 0 Number of scs hydrograph points... 1 Number of Extran printout locations (NPO)... 0 Number of Tide elements in Extran (NTE)... 1 Number of Natural channels (NNC)... 0 Number of Storage junctions in Extran (NVSE)... 0 Number of Time history data points in Extran(NTVAL). 0 Number of Variable storage elements in Extran (NVST) 0 Number of Input Hydrographs in Extran (NEH)... 8 Number of Particle sizes in Transport Block (NPS)... 0 Number of User defined conduits (NHW) Page 2
106 a11-13_100chi.out Number of Connecting conduits in Extran (NECC) Number of Upstream elements in Transport (NTCC) Number of Storage/treatment plants (NSTU)... 0 Number of Values for R1 lines in Transport (NR1)... 0 Number of Nodes to be allowed for (NNOD) Number of Plugs in a Storage Treatment Unit... 1 ####################################################### # Entry made to the HYDRAULIC Layer(Block) of SWMM # # Last Updated October,2000 by XP Software # Riverside South - Block Year Hydraulic Analysis *===========================================================* HYDRAULICS TABLES IN THE OUTPUT FILE These are the more important tables in the output file. You can use your editor to find the table numbers, for example: search for Table E20 to check continuity. This output file can be imported into a Word Processor and printed on US letter or A4 paper using portrait mode, courier font, a size of 8 pt. and margins of 0.75 Table E1 - Basic Conduit Data Table E2 - Conduit Factor Data Table E3a - Junction Data Table E3b - Junction Data Table E4 - Conduit Connectivity Data Table E4a - Dry Weather Flow Data Table E4b - Real Time Control Data Table E5 - Junction Time Step Limitation Summary Table E5a - Conduit Explicit Condition Summary Table E6 - Final Model Condition Table E7 - Iteration Summary Table E8 - Junction Time Step Limitation Summary Table E9 - Junction Summary Statistics Table E10 - Conduit Summary Statistics Table E11 - Area assumptions used in the analysis Table E12 - Mean conduit information Table E13 - Channel losses(h) and culvert info Table E13a - Culvert Analysis Classification Table E14 - Natural Channel Overbank Flow Information Table E14a - Natural Channel Encroachment Information Table E14b - Floodplain Mapping Table E15 - Spreadsheet Info List Table E15a - Spreadsheet Reach List Table E16 - New Conduit Output Section Table E17 - Pump Operation Table E18 - Junction Continuity Error Table E19 - Junction Inflow Sources Table E20 - Junction Flooding and Volume List Table E21 - Continuity balance at simulation end Table E22 - Model Judgement Section *==========================================================* Time Control from Hydraulics Job Control Year Month... 1 Day... 1 Hour... 0 Minute... 0 Second... 0 Page 3
107 a11-13_100chi.out Control information for simulation Integration cycles Length of integration step is seconds Simulation length hours Do not create equiv. pipes(nequal). 0 Use metric units for I/O... 1 Printing starts in cycle... 1 Intermediate printout intervals of. 500 cycles Intermediate printout intervals of minutes Summary printout intervals of cycles Summary printout time interval of minutes Hot start file parameter (REDO)... 0 Initial time hours Iteration variables: Flow Tolerance Head Tolerance Minimum depth (m or ft) Underrelaxation parameter Time weighting parameter Conduit roughness factor Flow adjustment factor Initial Condition Smoothing... 0 Courant Time Step Factor Default Expansion/Contraction K Default Entrance/Exit K Routing Method... Dynamic Wave Default surface area of junctions square meters. Minimum Junction/Conduit Depth meter. Ponding Area Coefficient Ponding Area Exponent Minimum Orifice Length meters. NJSW input hydrograph junctions... 8 or user defined hydrographs... *==================================================* Table E1 - Conduit Data *==================================================* Trapezoid Inp Conduit Length Conduit Area Manning Max Width Depth Side Num Name (m) Class ( m^2) Coef. (m) (m) Slopes C Circular C Circular C Circular C Circular C Circular C Circular C Circular Page 4
108 a11-13_100chi.out C Circular C Circular C Circular C Circular C Circular C Circular C Circular C Circular Total length of all conduits meters *==================================================* Table E2 - Conduit Factor Data *==================================================* Time Low Flow Depth at Conduit Number Entrance Exit Exp/Contc Weighting Roughness Which Flow Name of Barrels Loss Coef Loss Coef Coefficnt Parameter Factor n Changes Routing C Standard - Dynamic Wave C Standard - Dynamic Wave C Standard - Dynamic Wave C Standard - Dynamic Wave C Standard - Dynamic Wave C Standard - Dynamic Wave C Standard - Dynamic Wave C Standard - Dynamic Wave C Standard - Dynamic Wave C Standard - Dynamic Wave C Standard - Dynamic Wave C Standard - Dynamic Wave C Standard - Dynamic Wave C Standard - Dynamic Wave *===================================================* If there are messages about (sqrt(g*d)*dt/dx), or the sqrt(wave celerity)*time step/conduit length Page 5
109 a11-13_100chi.out in the output file all it means is that the program will lower the internal time step to satisfy this condition (explicit condition). You control the actual internal time step by using the minimum courant time step factor in the HYDRAULICS job control. The message put in words states that the smallest conduit with the fastest velocity will control the time step selection. You have further control by using the modify conduit option in the HYDRAULICS Job Control. *===================================================* Conduit Courant Name Ratio C C ===> Warning! (sqrt(wave celerity)*time step/conduit length) C ===> Warning! (sqrt(wave celerity)*time step/conduit length) C ===> Warning! (sqrt(wave celerity)*time step/conduit length) C ===> Warning! (sqrt(wave celerity)*time step/conduit length) C C ===> Warning! (sqrt(wave celerity)*time step/conduit length) C ===> Warning! (sqrt(wave celerity)*time step/conduit length) C ===> Warning! (sqrt(wave celerity)*time step/conduit length) C C ===> Warning! (sqrt(wave celerity)*time step/conduit length) C ===> Warning! (sqrt(wave celerity)*time step/conduit length) C C ===> Warning! (sqrt(wave celerity)*time step/conduit length) C ===> Warning! (sqrt(wave celerity)*time step/conduit length) *==================* Conduit Volume *==================* Full pipe or full open conduit volume Input full depth volume E+01 cubic meters *===================================================* Table E3a - Junction Data *===================================================* Inp Junction Ground Crown Invert Qinst Initial Interface Num Name Elevation Elevation Elevation cms Depth-m Flow (%) Page 6
110 a11-13_100chi.out E *===================================================* Table E3b - Junction Data *===================================================* Inp Junction X Y Type of Type of Maximum Pavement Num Name Coord. Coord. Manhole Inlet Capacity Shape Slope No Ponding Normal No Ponding Normal No Ponding Normal No Ponding Normal No Ponding Normal No Ponding Normal No Ponding Normal No Ponding Normal No Ponding Normal No Ponding Normal No Ponding Normal E No Ponding Normal Page 7
111 a11-13_100chi.out No Ponding Normal No Ponding Normal No Ponding Normal No Ponding Normal *===================================================* Table E4 - Conduit Connectivity *===================================================* Input Conduit Upstream Downstream Upstream Downstream Number Name Node Node Elevation Elevation ====== ================ ============== =============== ========= ========= 1 C No Design 2 C No Design 3 C No Design 4 C No Design 5 C No Design 6 C25 112E No Design 7 C No Design 8 C No Design 9 C No Design 10 C No Design 11 C No Design 12 C No Design 13 C No Design 14 C No Design 15 C No Design *================================================* FREE OUTFALL DATA (DATA GROUP I1) BOUNDARY CONDITION ON DATA GROUP J1 *================================================* Outfall at Junction has boundary condition number... 1 *================================================* INTERNAL CONNECTIVITY INFORMATION *================================================* CONDUIT JUNCTION JUNCTION Page 8
112 a11-13_100chi.out FREE # BOUNDARY *===================================================* Boundary Condition Information Data Groups J1-J4 *===================================================* BC NUMBER.. 1 Control water surface elevation is meters. *=========================================================* Table E7 - Iteration Summary *=========================================================* Total number of time steps simulated Total number of passes in the simulation Total number of time steps during simulation Ratio of actual # of time steps / NTCYC Average number of iterations per time step Average time step size(seconds) Smallest time step size(seconds) Largest time step size(seconds) Average minimum Conduit Courant time step (sec) Average minimum implicit time step (sec) Average minimum junction time step (sec) Average Courant Factor Tf Number of times omega reduced... 0 *=========================================================* Table E8 - Junction Time Step Limitation Summary *=========================================================* Not Convr = Number of times this junction did not converge during the simulation. Avg Convr = Average junction iterations. Conv err = Mean convergence error. Omega Cng = Change of omega during iterations Max Itern = Maximum number of iterations *=========================================================* Junction Not Convr Avg Convr Total Itt Omega Cng Max Itern Ittrn >10 Ittrn >25 Ittrn > Page 9
113 a11-13_100chi.out E Total number of iterations for all junctions Minimum number of possible iterations Efficiency of the simulation Good Efficiency *==========================================================* Extran Efficiency is an indicator of the efficiency of the simulation. Ideal efficiency is one iteration per time step. Altering the underrelaxation parameter, lowering the time step, increasing the flow and head tolerance are good ways of improving the efficiency, another is lowering the internal time step. The lower the efficiency generally the faster your model will run. If your efficiency is less than 1.5 then you may try increasing your time step so that your overall simulation is faster. Ideal efficiency would be around 2.0 Good Efficiency < 1.5 mean iterations Excellent Efficiency < 2.5 and > 1.5 mean iterations Good Efficiency < 4.0 and > 2.5 mean iterations Fair Efficiency < 7.5 and > 4.0 mean iterations Poor Efficiency > 7.5 mean iterations *==========================================================* *======================================================* Table E9 - JUNCTION SUMMARY STATISTICS The Maximum area is only the area of the node, it does not include the area of the surrounding conduits *======================================================* Uppermost Maximum Time Meters of Maximum Maximum Maximum Maximum Ground PipeCrown Junction of Surcharge Freeboard Junction Gutter Gutter Gutter Junction Elevation Elevation Elevation Occurence at Max of node Area Depth Width Velocity Name meters meters meters Hr. Min. Elevation meters m^2 meters meters m/s Page 10
114 a11-13_100chi.out E *======================================================* Table E10 - CONDUIT SUMMARY STATISTICS Note: The peak flow may be less than the design flow and the conduit may still surcharge because of the downstream boundary conditions. * denotes an open conduit that has been overtopped this is a potential source of severe errors *======================================================* Conduit Maximum Maximum Time Maximum Time Ratio of Maximum Depth Ratio Design Design Vertical Computed of Computed of Max. to at Pipe Ends d/d Conduit Flow Velocity Depth Flow Occurence Velocity Occurence Design Upstream Dwnstrm US DS Name (cms) (m/s) (mm) (cms) Hr. Min. (m/s) Hr. Min. Flow (m) (m) C C C C C C C C C C Page 11
115 a11-13_100chi.out C C C C C FREE # 1 Undefnd Undefnd Undefn *==================================================* Table E11. Area assumptions used in the analysis Subcritical and Critical flow assumptions from Subroutine Head. See manual for more information. *==================================================* Duration Duration Durat. of Durat. of of of Sub- Upstream Downstream Maximum Maximum Maximum Conduit Dry Critical Critical Critical Hydraulic X-Sect Vel*D Name Flow(min) Flow(min) Flow(min) Flow(min) Radius-m Area(m^2) (m^2/s) C C C C C C C C C C C C C C C *===========================================* Table E12. Mean Conduit Flow Information *===========================================* Mean Total Mean Low Mean Mean Page 12
116 a11-13_100chi.out Mean Mean Conduit Flow Flow Percent Flow Froude Hydraulic Cross Conduit Name (cms) (m^3) Change Weightng Number Radius Area Roughness C C C C C C C C C C C C C C Page 13
117 a11-13_100chi.out C FREE # *===============================================================* Table E13. Channel losses(h), headwater depth (HW), tailwater depth (TW), critical and normal depth (Yc and Yn). Use this section for culvert comparisons *===============================================================* Conduit Maximum Head Friction Critical Normal HW TW Name Flow Loss Loss Depth Depth Elevat Elevat C Max Flow C Max Flow C Max Flow C Max Flow C Max Flow C Max Flow C Max Flow C Max Flow C Max Flow C Max Flow C Max Flow C Max Flow C Max Flow C Max Flow C Max Flow *==========================================================* Table E13a. CULVERT ANALYSIS CLASSIFICATION, and the time the culvert was in a particular classification during the simulation. The time is in minutes. The Dynamic Wave Equation is used for all conduit analysis but the culvert flow classification condition is based on the HW and TW depths. *==========================================================* Mild Mild Steep Mild Mild Slope Slope TW Slope TW Slug Flow Slope Slope Critical D Control Insignf Outlet/ TW > D TW <= D Page 14
118 a11-13_100chi.out Conduit Outlet Outlet Entrance Entrance Outlet Outlet Outlet Inlet Inlet Name Control Control Control Control Control Control Control Control Configuration C None C None C None C None C None C None C None C None C None C None C None C None C None C None C None *=====================================* Kinematic Wave Approximations Time in Minutes for Each Condition *=====================================* Conduit Duration of Slope Super- Roll Name Normal Flow Criteria Critical Waves C C C C C C C C C C C C C C C Page 15
119 a11-13_100chi.out *=========================================================* Table E15 - SPREADSHEET INFO LIST Conduit Flow and Junction Depth Information for use in spreadsheets. The maximum values in this table are the true maximum values because they sample every time step. The values in the review results may only be the maximum of a subset of all the time steps in the run. Note: These flows are only the flows in a single barrel. *=========================================================* Conduit Maximum Total Maximum Maximum ## Junction Invert Maximum Name Flow Flow Velocity Volume ## Name Elevation Elevation (cms) (m^3) (m/s) (m^3) ## (m) (m) ## C ## C ## C ## C ## C ## C ## C ## C ## C ## C ## C ## C ## Page 16
120 112E a11-13_100chi.out C ## C ## C ## FREE # ## *====================================================* Table E15a - SPREADSHEET REACH LIST Peak flow and Total Flow listed by Reach or those conduits or diversions having the same upstream and downstream nodes. *====================================================* Upstream Downstream Maximum Total Node Node Flow Flow (cms) (m^3) Page 17
121 a11-13_100chi.out ######################################################### # Table E16. New Conduit Information Section # # Conduit Invert (IE) Elevation and Conduit # # Maximum Water Surface (WS) Elevations # ######################################################### Conduit Name Upstream Node Downstream Node IE Up IE Dn WS Up WS Dn Conduit Type C Circular C Circular C Circular C Circular C Circular C25 112E Circular C Circular C Circular C Circular C Circular Page 18
122 a11-13_100chi.out C Circular C Circular C Circular C Circular C Circular *=============================================================================* Table E18 - Junction Continuity Error. Division by Volume added 11/96 Continuity Error = Net Flow + Beginning Volume - Ending Volume Total Flow + (Beginning Volume + Ending Volume)/2 Net Flow = Node Inflow - Node Outflow Total Flow = absolute (Inflow + Outflow) Intermediate column is a judgement on the node continuity error. Excellent < 1 percent Great 1 to 2 percent Good 2 to 5 percent Fair 5 to 10 percent Poor 10 to 25 percent Bad 25 to 50 percent Terrible > 50 percent *=============================================================================* Junction <------Continuity Error > Remaining Beginning Net Flow Total Flow Failed to Name Volume % of Node % of Inflow Volume Volume Thru Node Thru Node Converge Page 19
123 a11-13_100chi.out E The total continuity error was cubic meters The remaining total volume was cubic meters Your mean node continuity error was Excellent Your worst node continuity error was Excellent *===================================================* Table E19 - Junction Inflow Sources Units are either ft^3 or m^3 depending on the units in your model. *===================================================* Constant User Interface DWF Inflow RNF Layer Inflow Junction Inflow Inflow Inflow Inlow through Inflow Outflow Evaporation from Name to Node to Node to Node to Node Outfall to Node from Node from Node 2D Layer Page 20
124 a11-13_100chi.out *=====================================================* Table E20 - Junction Flooding and Volume Listing. The maximum volume is the total volume in the node including the volume in the flooded storage area. This is the max volume at any time. The volume in the flooded storage area is the total volume above the ground elevation, where the flooded pond storage area starts. The fourth column is instantaneous, the fifth is the sum of the flooded volume over the entire simulation Units are either ft^3 or m^3 depending on the units. *=====================================================* Out of System Stored in System Junction Surcharged Flooded Flooded Maximum Ponding Allowed Name Time (min) Time(min) Volume Volume Flood Pond Volume Page 21
125 a11-13_100chi.out E *==================================* Page 22
126 a11-13_100chi.out Simulation Specific Information *==================================* Number of Input Conduits Number of Simulated Conduits Number of Natural Channels... 0 Number of Junctions Number of Storage Junctions... 0 Number of Weirs... 0 Number of Orifices... 0 Number of Pumps... 0 Number of Free Outfalls... 1 Number of Tide Gate Outfalls... 0 *=========================================================* Average % Change in Junction or Conduit is defined as: Conduit % Change ==> ( Q(n+1) - Q(n) ) / Qfull Junction % Change ==> ( Y(n+1) - Y(n) ) / Yfull *=========================================================* The Conduit with the largest average change was..c16 with percent The Junction with the largest average change was.102 with percent The Conduit with the largest sinuosity was...c16 with *===================================================================* Table E21. Continuity balance at the end of the simulation Junction Inflow, Outflow or Street Flooding Error = Inflow + Initial Volume - Outflow - Final Volume *===================================================================* Inflow Inflow Average Junction Volume, m^3 Inflow, cms Page 23
127 a11-13_100chi.out Outflow Outflow Average Junction Volume m^3 Outflow, cms *=====================================================* Initial system volume = Cu M Total system inflow volume = Cu M Inflow + Initial volume = Cu M *=====================================================* Total system outflow = Cu M Volume left in system = Cu M Evaporation = Cu M Outflow + Final Volume = Cu M *=====================================================* *===============================================* Total Model Continuity Error Error in Continuity, Percent = Error in Continuity, m^3 = Error means a continuity loss, - a gain Page 24
128 a11-13_100chi.out *===============================================* ################################################### # Table E22. Numerical Model judgement section # ################################################### Your overall error was percent Worst nodal error was in node 107 with percent Of the total inflow this loss was percent Your overall continuity error was Excellent Excellent Efficiency Efficiency of the simulation 1.10 Most Number of Non Convergences at one Node 0. Total Number Non Convergences at all Nodes 0. Total Number of Nodes with Non Convergences 0. ===> Hydraulic model simulation ended normally. ===> XP-SWMM Simulation ended normally. ===> Your input file was named : E:\poplin\a11-13_100chi.DAT ===> Your output file was named : E:\poplin\a11-13_100chi.out *==============================================================* SWMM Simulation Date and Time Summary *==============================================================* Starting Date... January 11, 2013 Time... 11:23:17:62 Ending Date... January 11, 2013 Time... 11:23:40:64 Elapsed Time minutes or seconds *==============================================================* Page 25
129 Appendix A7 Storm Sewer Design Sheet
130 RIVERSIDE SOUTH - BLOCK 3/4 STORM SEWER DESIGN PARAMETERS DESIGN SHEET I = a / (t+b) c (As per City of Ottawa Guidelines, 2004 DATE: 25-Sep-2012 (City of Ottawa) 1:5 yr 1:10 yr REVISION DATE: a = MANNING'S n = BEDDING CLASS = B DESIGNED BY: DT FILE NUMBER: b = MINIMUM COVER: 2.00 m CHECKED BY: AMP c = TIME OF ENTRY 10 min LOCATION DRAINAGE AREA PIPE SELECTION UPSTREAM DOWNSTREAM AREA ID FROM TO AREA AREA AREA C ACCUM. A x C ACCUM. ACCUM. A x C ACCUM. T of C I 5-YEAR I 10-YEAR Q CONTROL ACCUM. Q ACT LENGTH PIPE WIDTH PIPE PIPE MATERIAL CLASS SLOPE Q CAP % FULL VEL. VEL. TIME OF Ground Obvert Invert U/S Ground Obvert Invert D/S NUMBER M.H. M.H. (5-YEAR) (10-YEAR) (ROOF) AREA (5YR) (5-YEAR) AxC (5YR) AREA (10YR) (10-YEAR) AxC (10YR) Q CONTROL (CIA/360) OR DIAMETER HEIGHT SHAPE (FULL) (FULL) (ACT) FLOW Elevation Elevation Elevation Cover Elevation Elevation Elevation Cover (ha) (ha) (ha) (-) (ha) (ha) (ha) (ha) (ha) (ha) (min) (mm/h) (mm/h) (L/s) (L/s) (L/s) (m) (mm) (mm) (-) (-) (-) % (L/s) (-) (m/s) (m/s) (min) (m) (m) (m) (m) (m) (m) (m) (m) ST106A CIRCULAR PVC SDR CIRCULAR PVC SDR CIRCULAR PVC SDR ST104A CIRCULAR PVC SDR ST112A CIRCULAR PVC SDR ST103A CIRCULAR CONCRETE 65-D ST109A CIRCULAR PVC SDR CIRCULAR PVC SDR ST108A CIRCULAR PVC SDR CIRCULAR PVC SDR ST111A, ST111B CIRCULAR PVC SDR CIRCULAR PVC SDR CIRCULAR PVC SDR ST107A CIRCULAR CONCRETE 65-D CIRCULAR CONCRETE 65-D #REF!
131 Appendix A8 V x d Calculations
132 :RIVERSIDE SOUTH BLOCK 3/4 Flow Depth and Spread at Location with Highest Peak Flow Depth - Velocity Calculations for Major System Worst Case Scenario Segment Worst Case Depth 1 Q 2 Area 3 V = Q/A d*v Type Segment ID (m) (cms) (m 2 ) (m/s) (m 2 /s) Full Street ST103A Half Street ST103A Depth is equal to depth of flow from DDSWMM output (100yr, 3hr Chicago) plus ponding depth at sag storage 2. Flow obtained from DDSWMM output (100yr, 3hr Chicago). 3. Cross sectional area based on the geometry of each segment at the depth in 1. 3% C B 3% A 15cm 3.50m
133 Appendix A9 SWM Criteria Correspondence
134 Carter, Catherine From: Sent: To: Cc: Subject: Jonathan Parraga Thursday, January 03, :08 AM Wilkie, Tim Paerez, Ana; Thiffault, Dustin; Mary Jarvis Re: FW: Richcraft Homes Poplin - Riverside South Tim, Happy New Year to you as well! Please find an except (in red) from a chain of with Jacek (City) confirming the SWM requirements for 199 Poplin. The same requirements would be required for 240 Poplin. Please contact me if you require clarification. Hi Jonathan, Please note that the item 3 is not required, item 4 covers it. For the 5 to 100 year events the site will release 108 l/s to the minor system. The site will store an X m 3 of volume which is based on the volume generated from the C value difference (5 year event) plus 70.5 m 3 (50 x 1.41). Thanks, Jacek From: Jonathan Parraga [mailto:jparraga@jlrichards.ca] Sent: December 06, :50 AM To: Taracha, Jacek Cc: Tousignant, Eric; Elliott, Gord; Mary Jarvis Subject: RE: RSS Phase 9-1A Jacek, As my client is anxious for approval, I would like to confirm the methodology to we intend to apply to SWM so the review process can go as smoothly and quickly as possible. 1. As discussed below, we propose to provide storage for 50 m3/ha plus the volume generated from the 5 year event difference between the presently proposed runoff coefficient and the C of 0.5. OK 2. Since the site is only 1.41 ha, we propose to use the Modified Rational method to compute the required volume generated from the 5 year event difference between the presently proposed runoff coefficient and the C of 0.5. Volume of X m 3 generated from the C value difference (5 year event) and 70.5 m 3 (50 x 1.41) will be stored on site consist of both surface and pipe storage. 3. Storm servicing for the site will be developed incorporating CBs equipped w/ ICDs sized to capture the 5yr with a C of Flows in excess of the 5 yr will be retained in local sags. These ICDs will prevent unnecessary surcharge of the local system protecting basements. 4. In order to meet the MSS requirements and ensure the integrity of the downstream sewers are maintained, the minor system inlet rate will be controlled to L/s (77L/s/ha x 1.41 ha), this is the same plug flow provided in the sewer design sheet submitted to MOE for early servicing). Regards, Jonathan Párraga, P.Eng. Senior Civil Engineer 1
135 J.L. Richards & Associates Limited 864 Lady Ellen Place, Ottawa, ON K1Z 5M2 Tel: Fax: Jonathan Párraga, P.Eng. Senior Civil Engineer J.L. Richards & Associates Limited 864 Lady Ellen Place, Ottawa, ON K1Z 5M2 Tel: Fax: >>> >>> From: To: CC: Date: "Wilkie, Tim" "Jonathan Parraga "Paerez, Ana" "Thiffault, Dustin" 1/2/2013 4:21 PM Subject: FW: Richcraft Homes Poplin - Riverside South Hi Jonathan Happy New Year! Can you bring me up to speed concerning the latest on the SWM criteria. My understanding is that the City is now allowing us the pond in the OCT parking. If this is the case doesn t our original SWM criteria remain unchanged and therefore no changes to our SWM design/report? Please let me know. Thanks From: Phil Castro [mailto:philc@richcraft.com] Sent: Wednesday, January 02, :45 PM To: Wilkie, Tim Cc: Thiffault, Dustin Subject: FW: Richcraft Homes Poplin - Riverside South Hey Tim and Dustin, hope you guys had a good break... Looks like we have some work to do...please read the notes from the City below and give me a call when your back in the office... It may just be easier to pull the manholes back to match the entrance and have Urbandale come into line with the revised location, but I'm interested in your thoughts. Thanks, Phil Castro MCIP, RPP Planning and Land Development philc@richcraft.com ext. 113 Richcraft Group of Companies 2280 St.Laurent Blvd, Ottawa, Ontario K1G 4K1 From: McCann-MacMillan, Patricia [mailto:patricia.mccann-macmillan@ottawa.ca] Sent: Wednesday, January 02, :25 PM 2
136 To: Phil Castro Cc: Elliott, Gord Subject: FW: Richcraft Homes Poplin - Riverside South Phil, I received a response to my enquiry about the sketch provided. I was advised the following: The sketch indicates new manholes to be installed within the ROW, this is not acceptable. The proposed storm/sanitary MH s will need to be moved back onto private property. If the MH s are moved the distance between the proposed sanitary sewer & the proposed building foundation is approx+/ 2.0m. Given the sewer is approx. 4m deep there does not appear to be adequate clearance to avoid undermining the building. Stantec will have to prepare a x section to demonstrate how this can work in the future should the sewers need to be excavated. (or shift the sewers further from the building) Concerning the ex. service stub location, we are still unclear as to why Urbandale & Richcraft s plans do not line up?? Mary Jarvis seemed to indicate at the meeting all this was worked out between the 2 developers & agreed upon, the service stubs should have been in the correct location?? Regarding the storm water management a solution has been agreed too that will require resubmission of the servicing design brief & likely changes to the SWM storage volume provided on site. This will include revisions to the servicing drawings, possibly changes to ICD s & underground storage pipes. At this point we would suggest resubmission of the engineering package is required before circulation commences. So it appears that the manhole issue still needs to be resolved, the service stub location still needs clarification, and the engineering package needs to be revised and resubmitted as mentioned above, before the application is circulated. Regards, Pat Patricia McCann-MacMillan Planner, Development Review (Suburban Services - East) Planning and Growth Management Department 110 Laurier Avenue West Tel: , Ext Fax: Patricia.McCann-MacMillan@ottawa.ca From: Phil Castro [mailto:philc@richcraft.com] Sent: January 02, :00 AM To: McCann-MacMillan, Patricia Subject: Richcraft Homes Poplin - Riverside South Importance: High Good morning Patricia, In response to your letter of November 28th. please find the following items attached for your review: 1. A signed authorization from the Riverside South Development Corporation allowing us official permission to submit our application. 2. A hand drawing showing a revised sewer connection to Poplin Street now the we have the as-built information. As 3
137 this is a minor change to the engineering design and the drawings and reports have already been printed, we hope that the City can go ahead with our submission as is and we will update the drawings as part of second submission back to the City. 3. it is our understanding that the storm water issue has been discussed and a solution in forth coming. We'd ask that the application be circulated in order to avoid any delay from a situation that will be solved shortly. Please let me know if you have further concerns or questions. Hard copies of all the attached items will be dropped for you review later this week. Thank you, Phil Castro MCIP, RPP Planning and Land Development philc@richcraft.com ext. 113 Richcraft Group of Companies 2280 St.Laurent Blvd, Ottawa, Ontario K1G 4K1 This originates from the City of Ottawa system. Any distribution, use or copying of this or the information it contains by other than the intended recipient(s) is unauthorized. If you are not the intended recipient, please notify me at the telephone number shown above or by return and delete this communication and any copy immediately. Thank you. Le présent courriel a été expédié par le système de courriels de la Ville d'ottawa. Toute distribution, utilisation ou reproduction du courriel ou des renseignements qui s'y trouvent par une personne autre que son destinataire prévu est interdite. Si vous avez reçu le message par erreur, veuillez m'en aviser par téléphone (au numéro précité) ou par courriel, puis supprimer sans délai la version originale de la communication ainsi que toutes ses copies. Je vous remercie de votre collaboration. 4
138 Carter, Catherine From: Sent: To: Cc: Subject: Attachments: Jonathan Parraga Friday, August 17, :56 PM Paerez, Ana Guy Forget; Gillian Dumencu; Mary Jarvis Modeling Methodology Methodology used for DDSWMM modeling of Stacked Units.doc Ana, Please find attached our modeling methodology as requested. With the new City criteria, as discussed, the overland flow currently exceeds the City requirements. I will call Eric Tousignant (City) to discuss. The real difficulty is that there is not an outlet for this land, as the culverts west on Earl Armstrong were not installed. I will keep you posted with the outcome of our discussions with the City. Regards, Jonathan Párraga, P.Eng. Senior Civil Engineer J.L. Richards & Associates Limited 864 Lady Ellen Place, Ottawa, ON K1Z 5M2 Tel: Fax:
139 Methodology used for DDSWMM modeling of Stacked Units - Riverside South Phase 9: Table 1: Sub-catchment Characteristics used for DDSWMM model Sub- Runoff Area Catchment Land Use Coefficient Imperviousness (ha) ID C SUB A1 Poplin Street ROW SUB A2 Stacked Units SUB A3 Townhomes SUB A4 SUB A5 Stacked Units Future Residential (by Others) SUB A6 Townhomes SUB A7 Townhomes SUB A8 SUB A9 Poplin Street ROW Brian Good Avenue ROW Street segments of Poplin Street and Brian Good Avenue were modeled as individual sub-catchments with storage to accommodate the major flow: Table 2: Street sub-catchments Sub-Catchment ID SUB A1 SUB A8 SUB A9 Land Use Poplin Street ROW Poplin Street ROW Brian Good Avenue ROW Available Storage (m 3 ) Number of Catchbasins Inlet Capture Rate (L/s) Street segments as part of sub-catchments A3, A5 and A7 have available storage to accommodate major overland flow from these areas:
140 Table 3: Sub-catchments with street sags Sub-Catchment ID Land Use Available Number of Inlet Capture Storage (m 3 ) Catchbasins Rate (L/s) SUB A3 Townhomes SUB A5 Future Residential (by Others) SUB A7 Townhomes There is no storage provided on the sub-catchments A2 and A4 (Stacked Units). Major overland flow is directed towards Poplin Street and Brian Good Avenue respectively, while the inlet capture rates were calculated based on the criteria of 77L/s/ha developed in the Infrastructure Servicing Study Update (ISSU) developed by Stantec for the Riverside South Community (September 30, 2008) Major overland flow is cascading from street sags in downstream direction towards Brian Good Avenue. The current modeling results show that the major overland flow exceeds the allowance of 0.3 m on the streets and this need to be approved by the City of Ottawa.
141
142 Appendix B Sanitary Sewer Design Sheets
143 SUBDIVISION: SUBDIVISION: SANITARY SEWER DESIGN SHEET (City of Ottawa) DESIGN PARAMETERS MAX PEAK FACTOR (RES.)= 4.0 AVG. DAILY FLOW / PERSON 350 l/p/day MINIMUM VELOCITY 0.60 m/s DATE: November 10, 2010 MIN PEAK FACTOR (RES.)= 2.0 COMMERCIAL 0.58 l/s/ha MAXIMUM VELOCITY 3.00 m/s REVISION: PEAKING FACTOR (INDUSTRIAL): 2.4 INDUSTRIAL 0.40 l/s/ha MANNINGS n DESIGNED BY: FILE NUMBER: XXX PEAKING FACTOR (COMM., INST.): 1.5 INSTITUTIONAL 0.60 l/s/ha BEDDING CLASS B CHECKED BY: PERSONS / SINGLE UNIT 3.4 INFILTRATION 0.28 l/s/ha MINIMUM COVER 2.50 m PERSONS / TOWNHOME PERSONS / JLR TOWN/STACKED LOCATION RESIDENTIAL AREA AND POPULATION COMM INDUST INSTIT GREEN / UNUSED C+I+I INFILTRATION PIPE AREA ID FROM TO AREA UNITS POP. CUMULATIVE PEAK PEAK AREA ACCU. AREA ACCU. AREA ACCU. AREA ACCU. PEAK TOTAL ACCU. INFILT. TOTAL LENGTH DIA MATERIAL CLASS SLOPE CAP. CAP. V VEL. NUMBER M.H. M.H. SINGLE TOWN JLR TOWN AREA POP. FACT. FLOW AREA AREA AREA AREA FLOW AREA AREA FLOW FLOW (FULL) PEAK FLOW (FULL) (ha) /STACK (ha) (l/s) (ha) (ha) (ha) (ha) (ha) (ha) (ha) (ha) (l/s) (ha) (ha) (l/s) (l/s) (m) (mm) (%) (l/s) (%) (m/s) SA6A PVC SDR % 0.84 SA5A PVC SDR % 0.66 SA14A PVC SDR % 0.84 SA4A PVC SDR % 0.66 SA12B PVC SDR % 0.84 SA3A PVC SDR % 0.66 SA9A PVC SDR % 0.84 SA15A PVC SDR % 0.84 SA8A PVC SDR % 0.66 SA12A PVC SDR % 0.84 SA11A PVC SDR % 0.66 SA13A PVC SDR % 0.84 SA10A PVC SDR % 0.66 SA7A PVC SDR % 0.66 SA2A PVC SDR % 0.66 EX102, EX103, EXTERNAL EXMH PVC SDR % EXMH PVC SDR % 0.86 EXTERNAL EX STUB EXMH PVC SDR % 0.70 EX101 EXMH21 EXMH PVC SDR % of 1 san_ _dt_ xls
144 Appendix C Potable Water Hydraulic Analysis

145 FUS Fire Flow Calculations Stantec Project #: Project Name: Riverside South Block 84 Fire Flow Calculation #: 2 Date: October 23, 2012 Building Type/Description/Name: Block 2 Data input by: Shawn Ireland, COOP Student Reviewed by: Kevin Alemany, P. Eng. Calculations Based on 1999 Publication "Water Supply for Public Fire Protection" by Fire Underwriters' Survey (FUS) Table A: Fire Underwriters Survey Determination of Required Fire Flow - Long Method Step Task Term Options Multiplier Associated with Option Choose: Value Used Unit Total Fire Flow (L/min) 1 2 Framing Material Coefficient related Choose Frame Used Wood Frame 1.5 to type of for Construction of Ordinary construction 1 construction (C) Unit Non-combustible construction 0.8 Wood Frame 1.5 m Fire resistive construction (< 2 hrs) 0.7 Fire resistive construction (> 2 hrs) 0.6 Floor Space Area Single Family 1 Townhouse - indicate # of units 10 Other (Comm, Ind, etc.) # of Storeys Number of Floors/ Storeys in the Unit (do not include basement): 3 3 Storeys Choose Type of Housing (if TH, Enter Number of Units Per TH Block) Enter Ground Floor Area of One Unit Obtain Required Fire Flow without Reductions Apply Factors Affecting Burning Choose Combustibility of Building Contents Type of Housing Measurement Units Occupancy content hazard reduction or surcharge Choose Reduction Sprinkler Due to Presence of reduction Sprinklers Choose Separation Distance Between Units Obtain Required Fire Flow, Duration & Volume Exposure Distance Between Units Enter Ground Floor Area (A) of One Unit Only : Square Feet (ft 2 ) Square Metres (m 2 ) 1 Hectares (ha) Townhouse - indicate # of units Non-combustible Limited combustible Combustible 0 Free burning 0.15 Rapid burning 0.25 Complete Automatic Sprinkler Protection -0.3 None 0 North Side 45.1m or greater 0 East Side 0 to 3.0m 0.25 South Side 20.1 to 30.1m 0.1 West Side 10.1 to 20.0m 0.15 Note: The most current FUS document should be referenced before design to ensure that the above figures are consistent with the intent of the Guideline Legend Drop down menu - choose option, or enter value. No Information, No input required. 528 Square Feet (ft2) Required Fire Flow( without reductions or increases per FUS) (F = 220 * C * A) Round to nearest 1000L/min Reductions/Increases Due to Factors Affecting Burning 10 Units 1,472 Area in Square Meters (m 2 ) 13,000 Limited combustible N/A 11,050 None 0 N/A 0.5 m 5,525 Total Required Fire Flow, rounded to nearest 1000 L/min, with max/min limits applied: Total Required Fire Flow (above) in L/s: Required Duration of Fire Flow (hrs) Required Volume of Fire Flow (m 3 ) 0 17, ,825 Date: 10/23/2012 Stantec Consulting Ltd. Block 2 W:\active\1604_01004_Riverside South Block 84\planning\analysis\STANTEC_FUS_FIREFLOW_CALCULATOR_RiversideSouth_Block84.xlsx
146 Appendix D Geotechnical Report Excerpts
147 Geotechnical Engineering patersongroup Environmental Environmental Engineering Engineering Hydrogeology Hydrogeology Geological Engineering Geological Engineering Materials Testing Materials Testing Building Science Building Science Archaeological Studies Geotechnical Investigation Proposed Residential Development Block Riverside South Spratt Road Ottawa, Ontario Prepared For Richcraft Homes Paterson Group Inc. Consulting Engineers 154 Colonnade Road South Ottawa (Nepean), Ontario Canada K2E 7J5 Tel: (613) Fax: (613) June 15, 2012 Report: PG2560-1
148 patersongroup Ottawa Kingston North Bay Geotechnical Investigation Proposed Residential Development - Block 252 Spratt Road - Ottawa TABLE OF CONTENTS PAGE 1.0 INTRODUCTION PROPOSED PROJECT METHOD OF INVESTIGATION 3.1 Field Investigation Field Survey Laboratory Testing Analytical Testing OBSERVATIONS 4.1 Surface Conditions Subsurface Profile Groundwater DISCUSSION 5.1 Geotechnical Assessment Site Grading and Preparation Foundation Design Design for Earthquakes Basement Slab Pavement Structure DESIGN AND CONSTRUCTION PRECAUTIONS 6.1 Foundation Drainage and Backfill Protection of Footings Excavation Side Slopes Pipe Bedding and Backfill Groundwater Control Winter Construction Landscaping Considerations Corrosion Potential and Sulphate RECOMMENDATIONS STATEMENT OF LIMITATIONS Report: PG June 15, 2012 Page i
149 patersongroup Ottawa Kingston North Bay Geotechnical Investigation Proposed Residential Development - Block 252 Spratt Road - Ottawa APPENDICES Appendix 1: Appendix 2: Soil Profile and Test Data Sheets Symbols and Terms Analytical Test Results Figure 1 - Key Plan Drawing PG Test Hole Location Plan Report: PG June 15, 2012 Page ii
150 patersongroup Ottawa Kingston North Bay Geotechnical Investigation Proposed Residential Development - Block 252 Spratt Road - Ottawa 1.0 INTRODUCTION Paterson Group (Paterson) was commissioned by Richcraft Homes (Richcraft) to conduct a geotechnical investigation for Block 252 of Riverside South residential development to be located just south of Earl Armstrong Road alogn Spratt Road, in the City of Ottawa, Ontario (refer to Figure 1 - Key Plan in Appendix 2 of this report). The objectives of the current investigation were: determine the subsoil and groundwater conditions at this site by means of boreholes, to provide geotechnical recommendations pertaining to design of the proposed development including construction considerations which may affect the design. The following report has been prepared specifically and solely for the aforementioned project which is described herein. It contains our findings and includes geotechnical recommendations pertaining to the design and construction of the subject development as they are understood at the time of writing this report. Investigating the presence or potential presence of contamination on the subject property was not part of the scope of work of this present investigation. 2.0 PROPOSED DEVELOPMENT It is understood that the proposed residential development will consist of a series of 3 to 4 storey residential buildings with associated parking areas, as well as, access lanes and landscaped areas. Report: PG June 15, 2012 Page 1
151 patersongroup Ottawa Kingston North Bay Geotechnical Investigation Proposed Residential Development - Block 252 Spratt Road - Ottawa 3.0 METHOD OF INVESTIGATION 3.1 Field Investigation The field program for the geotechnical investigation was carried out on April 9, At that time, three (3) boreholes were advanced to a maximum 7.9 m depth. The test hole locations were distributed across the proposed development in a manner to provide general coverage. The borehole locations are shown on Drawing PG Test Hole Location Plan, included in Appendix 2. The boreholes were put down using a track-mounted auger drill rig operated by a twoperson crew. All fieldwork was conducted under the full-time supervision of our personnel under the direction of a senior engineer. The drilling procedure consisted of augering to the required depths at the selected locations, then sampling and testing the overburden. Sampling and In Situ Testing Soil samples were recovered using a 50 mm diameter split-spoon sampler. The splitspoon samples were classified on site and placed in sealed plastic bags. All samples were transported to our laboratory. The depths at which the split-spoon samples were recovered from the boreholes are shown as SS on the Soil Profile and Test Data sheets in Appendix 1. The Standard Penetration Test (SPT) was conducted in conjunction with the recovery of the split spoon samples. The SPT results are recorded as N values on the Soil Profile and Test Data sheets. The N value is the number of blows required to drive the split spoon sampler 300 mm into the soil after a 150 mm initial penetration using a 63.5 kg hammer falling from a height of 760 mm. Undrained shear strength testing, using a vane apparatus, was carried out at regular intervals of depth in cohesive soils. The subsurface conditions observed in the test holes were recorded in detail in the field. The soil profiles are logged on the Soil Profile and Test Data sheets in Appendix 1 of this report. Overburden thickness was evaluated during the course of the site investigation by dynamic cone penetration testing (DCPT) at one of the borehole locations. The DCPT consists of driving a steel drill rod, equipped with a 50 mm diameter cone at the tip, using a 63.5 kg hammer falling from a height of 760 mm. The number of blows required to drive the cone into the soil is recorded for each 300 mm increment. Report: PG June 15, 2012 Page 2
152 patersongroup Ottawa Kingston North Bay Geotechnical Investigation Proposed Residential Development - Block 252 Spratt Road - Ottawa Groundwater Flexible PVC standpipes were installed in all boreholes to permit monitoring of the groundwater levels subsequent to the completion of the sampling program. Sample Storage All samples will be stored in the laboratory for a period of one month after issuance of this report. They will then be discarded unless we are otherwise directed. 3.2 Field Survey The test hole locations were selected in the field by Paterson personnel in a manner to provide general coverage of the proposed development, taking into consideration site features. The ground surface elevations at the borehole locations were referenced to a temporary benchmark (TBM), consisting of the marked bolt on the fire hydrant, located at the intersection of Earl Armstrong Road and Spratt Road. A geodetic elevation of m was provided by Annis, O Sullivan, Vollebekk for this TBM. The locations and ground surface elevations of the boreholes, and the location of the TBM are presented on Drawing PG Test Hole Location Plan in Appendix Laboratory Testing The soil samples recovered from the subject site were examined in our laboratory to review the results of the field logging. 3.4 Analytical Testing One (1) soil sample was submitted for analytical testing to assess the corrosion potential for exposed ferrous metals and the potential of sulphate attacks against subsurface concrete structures. The sample was submitted to determine the concentration of sulphate and chloride, the resistivity and the ph of the soil. The analytical test results are presented in Appendix 1 and discussed in Subsection 6.8 of this report. Report: PG June 15, 2012 Page 3
153 patersongroup Ottawa Kingston North Bay Geotechnical Investigation Proposed Residential Development - Block 252 Spratt Road - Ottawa 4.0 OBSERVATIONS 4.1 Surface Conditions The subject site has been stripped of topsoil and is relatively flat and at grade with neighbouring roadways. Two (2) topsoil windrow piles were noted within the subject site at the time of field program. 4.2 Subsurface Profile The subsurface profile at the test hole locations consists of a stiff to very stiff silty clay crust underlain by a firm to stiff grey silty clay deposit. Refusal to DCPT was encountered at a 10 m depth at BH 2. Based on available geological mapping, interbedded sandstone and dolomite bedrock of the March Formation is present in this area with an overburden thickness ranging between 10 to 25 m. Reference should be made to the Soil Profile and Test Data sheets in Appendix 1 for the details of the soil profiles encountered at each test hole location. 4.3 Groundwater Groundwater levels were measured in the standpipes at the borehole locations on April 16, The results are summarized in Table 1. It should be noted that surface water can become perched within a backfilled borehole. Based on field observations and soil sample moisture levels, the long term groundwater table is anticipated between a 2 to 3 m depth. It should be noted that groundwater levels are subject to seasonal fluctuations. Therefore, the groundwater levels could be different at the time of construction. Table 1 - Summary of Groundwater Level Readings Borehole Number Ground Elevation (m) Measured Groundwater Level (m) Depth Elevation Recording Date BH April 16, 2012 BH April 16, 2012 BH April 16, 2012 Report: PG June 15, 2012 Page 4
154 patersongroup Ottawa Kingston North Bay Geotechnical Investigation Proposed Residential Development - Block 252 Spratt Road - Ottawa 5.0 DISCUSSION 5.1 Geotechnical Assessment From a geotechnical perspective, the subject site is adequate for the proposed residential development. It is expected that the proposed residential buildings will be founded on conventional shallow footings placed on an undisturbed, stiff silty clay bearing surface. The above and other considerations are discussed in the following paragraphs. 5.2 Site Grading and Preparation Stripping Depth Topsoil and deleterious fill, such as those containing organic materials, should be stripped from under any buildings and other settlement sensitive structures. Fill Placement Fill used for grading beneath the proposed buildings, unless otherwise specified, should consist of clean imported granular fill, such as Ontario Provincial Standard Specifications (OPSS) Granular A or Granular B Type II. The fill should be tested and approved prior to delivery to the site. It should be placed in lifts no greater than 300 mm thick and compacted using suitable compaction equipment for the lift thickness. Fill placed beneath the building areas should be compacted to at least 98% of its standard Proctor maximum dry density (SPMDD). Non-specified existing fill along with site-excavated soil can be used as general landscaping fill where settlement of the ground surface is of minor concern. These materials should be spread in thin lifts and at least compacted by the tracks of the spreading equipment to minimize voids. If these materials are to be used to build up the subgrade level for areas to be paved, they should be compacted in thin lifts to a minimum density of 95% of their respective SPMDD. Non-specified existing fill and site-excavated soils are not suitable for use as backfill against foundation walls, unless used in conjunction with a geocomposite drainage membrane, such as Miradrain G100N or Delta Drain Report: PG June 15, 2012 Page 5
155 patersongroup Ottawa Kingston North Bay Geotechnical Investigation Proposed Residential Development - Block 252 Spratt Road - Ottawa 5.3 Foundation Design Shallow Foundation Strip footings, up to 4 m wide, and pad footings, up to 6 m wide, can be designed using a bearing resistance value at serviceability limit states (SLS) of 150 kpa and a factored bearing resistance value at ultimate limit states (ULS) of 225 kpa placed on undisturbed, stiff silty clay bearing surface. A geotechnical resistance factor of 0.5 was applied to the above noted bearing resistance value at ULS. The bearing resistance value at SLS will be subjected to potential post-construction total and differential settlements of 25 and 20 mm, respectively. A permissible grade raise restriction of 1 m is recommended for the proposed development. An undisturbed soil bearing surface consists of a surface from which all topsoil and deleterious materials, such as loose, frozen or disturbed soil, whether in situ or not, have been removed, in the dry, prior to the placement of concrete for footings. The bearing medium under footing-supported structures is required to be provided with adequate lateral support with respect to excavations and different foundation levels. Adequate lateral support is provided to a silty clay bearing medium when a plane extending down and out from the bottom edge of the footing at a minimum of 1.5H:1V, passes only through in situ soil or engineered fill of the same or higher capacity as the soil. 5.4 Design for Earthquakes The site class for seismic site response can be taken as Class D for the foundations considered at this site. Soils underlying the subject site are not susceptible to liquefaction. Reference should be made to the latest revision of the Ontario Building Code for a full discussion of the earthquake design requirements. 5.5 Basement Slab With the removal of all topsoil and fill within the footprint of the proposed buildings, the silty clay will be considered an acceptable subgrade surface on which to commence backfilling for floor slab construction. OPSS Granular B Type II, with a maximum particle size of 50 mm, are recommended for backfilling below the floor slab. It is recommended that the upper 200 mm of sub-slab fill consist of 19 mm clear crushed stone material. All backfill material within the footprint of the proposed buildings should be placed in maximum 300 mm thick loose layers and compacted to at least 98% of its SPMDD. Report: PG June 15, 2012 Page 6
156 patersongroup Ottawa Kingston North Bay Geotechnical Investigation Proposed Residential Development - Block 252 Spratt Road - Ottawa 5.6 Pavement Structure For design purposes, the pavement structure presented in the following tables could be used for the design of car only parking areas and access lanes. Table 2 - Recommended Pavement Structure - Car Only Parking Areas Thickness (mm) Material Description 50 Wear Course - HL-3 or Superpave 12.5 Asphaltic Concrete 150 BASE - OPSS Granular A Crushed Stone 300 SUBBASE - OPSS Granular B Type II SUBGRADE - Either in situ silty clay or OPSS Granular B Type I or II material placed over in situ soil Table 3 - Recommended Pavement Structure - Access Lanes Thickness (mm) Material Description 40 Wear Course - HL-3 or Superpave 12.5 Asphaltic Concrete 50 Binder Course - HL-8 or Superpave 19.0 Asphaltic Concrete 150 BASE - OPSS Granular A Crushed Stone 400 SUBBASE - OPSS Granular B Type II SUBGRADE - Either in situ silty clay or OPSS Granular B Type I or II material placed over in situ soil Minimum Performance Graded (PG) asphalt cement should be used for this project. If soft spots develop in the subgrade during compaction or due to construction traffic, the affected areas should be excavated and replaced with OPSS Granular B Type I or II material. The pavement granular base and subbase should be placed in maximum 300 mm thick lifts and compacted to a minimum of 100% of the material s SPMDD using suitable vibratory equipment. Report: PG June 15, 2012 Page 7
157 patersongroup Ottawa Kingston North Bay Geotechnical Investigation Proposed Residential Development - Block 252 Spratt Road - Ottawa Pavement Structure Drainage Satisfactory performance of the pavement structure is largely dependent on keeping the contact zone between the subgrade material and the base stone in a dry condition. Failure to provide adequate drainage under conditions of heavy wheel loading can result in the fine subgrade soil being pumped into the voids in the stone subbase, thereby reducing its load carrying capacity. Due to the impervious nature of the subgrade materials consideration should be given to installing subdrains during the pavement construction. These drains should be installed at each catch basin, be at least 3 m long and should extend in four orthogonal directions or longitudinally when placed along a curb. The subdrain inverts should be approximately 300 mm below subgrade level. The subgrade surface should be crowned to promote water flow to the drainage lines. Report: PG June 15, 2012 Page 8
158 patersongroup Ottawa Kingston North Bay Geotechnical Investigation Proposed Residential Development - Block 252 Spratt Road - Ottawa 6.0 DESIGN AND CONSTRUCTION PRECAUTIONS 6.1 Foundation Drainage and Backfill It is recommended that a perimeter foundation drainage system be provided for the proposed structures. The system should consist of a 100 to 150 mm diameter perforated corrugated plastic pipe, surrounded on all sides by 150 mm of 10 mm clear crushed stone, placed at the footing level around the exterior perimeter of the structure. The pipe should have a positive outlet, such as a gravity connection to the storm sewer. Backfill against the exterior sides of the foundation walls should consist of free-draining non frost susceptible granular materials. The greater part of the site excavated materials will be frost susceptible and, as such, are not recommended for re-use as backfill against the foundation walls, unless used in conjunction with a drainage geocomposite, such as Miradrain G100N or Delta Drain 6000, connected to the perimeter foundation drainage system. Imported granular materials, such as clean sand or OPSS Granular B Type I granular material, should otherwise be used for this purpose. 6.2 Protection of Footings Against Frost Action Perimeter footings of heated structures are required to be insulated against the deleterious effect of frost action. A minimum of 1.5 m thick soil cover (or equivalent) should be provided in this regard. A minimum of 2.1 m thick soil cover (or equivalent) should be provided for exterior unheated footings, not thermally connected to a heated space, such as exterior columns and/or wing walls. 6.3 Excavation Side Slopes The side slopes of excavations in the soil and fill overburden materials should either be cut back at acceptable slopes or should be retained by shoring systems from the start of the excavation until the structure is backfilled. It is assumed that sufficient room will be available for the greater part of the excavation to be undertaken by opencut methods (i.e. unsupported excavations). Report: PG June 15, 2012 Page 9
159 patersongroup Ottawa Kingston North Bay Geotechnical Investigation Proposed Residential Development - Block 252 Spratt Road - Ottawa The excavation side slopes above the groundwater level extending to a maximum depth of 3 m should be cut back at 1H:1V or flatter. The flatter slope is required for excavation below groundwater level. The subsoil at this site is considered to be mainly a Type 2 and 3 soil according to the Occupational Health and Safety Act and Regulations for Construction Projects. Excavated soil should not be stockpiled directly at the top of excavations and heavy equipment should be kept away from the excavation sides. Slopes in excess of 3 m in height should be periodically inspected by the geotechnical consultant in order to detect if the slopes are exhibiting signs of distress. It is recommended that a trench box be used at all times to protect personnel working in trenches with steep or vertical sides. It is expected that services will be installed by cut and cover methods and excavations will not be left open for extended periods of time. 6.4 Pipe Bedding and Backfill At least 150 mm of OPSS Granular A should be used for pipe bedding for sewer and water pipes. The bedding should extend to the spring line of the pipe. Cover material, from the spring line to at least 300 mm above the obvert of the pipe should consist of OPSS Granular A. The bedding and cover materials should be placed in maximum 225 mm thick lifts compacted to a minimum of 95% of the material s SPMDD. Generally, it should be possible to re-use the silty clay crust above the cover material if the excavation and filling operations are carried out in dry weather conditions. Where hard surface areas are considered above the trench backfill, the trench backfill material within the frost zone (about 1.8 m below finished grade) should match the soils exposed at the trench walls to minimize differential frost heaving. The trench backfill should be placed in maximum 300 mm thick loose lifts and compacted to a minimum of 95% of the material s SPMDD. Report: PG June 15, 2012 Page 10
160 patersongroup Ottawa Kingston North Bay Geotechnical Investigation Proposed Residential Development - Block 252 Spratt Road - Ottawa To reduce long-term lowering of the groundwater level at this site, clay seals should be provided in the service trenches. The seals should be at least 1.5 m long (in the trench direction) and should extend from trench wall to trench wall. Generally, the seals should extend from the frost line and fully penetrate the bedding, subbedding and cover material. The barriers should consist of relatively dry and compactable brown silty clay placed in maximum 225 mm thick loose layers and compacted to a minimum of 95% of the material s SPMDD. The clay seals should be placed at the site boundaries and at strategic locations at no more than 60 m intervals in the service trenches. 6.5 Groundwater Control The contractor should be prepared to direct water away from all bearing surfaces and subgrades, regardless of the source, to prevent disturbance to the founding medium. It is anticipated that pumping from open sumps will be sufficient to control the groundwater influx through the sides of the excavations. A temporary MOE permit to take water (PTTW) will be required for this project if more than 50,000 L/day are to be pumped during the construction phase. At least 3 to 4 months should be allowed for completion of the application and issuance of the permit by the MOE. 6.6 Winter Construction Precautions must be taken if winter construction is considered for this project. The subsoil conditions at this site consist of frost susceptible materials. In the presence of water and freezing conditions, ice could form within the soil mass. Heaving and settlement upon thawing could occur. In the event of construction during below zero temperatures, the founding stratum should be protected from freezing temperatures by the use of straw, propane heaters and tarpaulins or other suitable means. In this regard, the base of the excavations should be insulated from sub-zero temperatures immediately upon exposure and until such time as heat is adequately supplied to the building and the footings are protected with sufficient soil cover to prevent freezing at founding level. Report: PG June 15, 2012 Page 11
161 patersongroup Ottawa Kingston North Bay Geotechnical Investigation Proposed Residential Development - Block 252 Spratt Road - Ottawa Trench excavations and pavement construction are also difficult activities to complete during freezing conditions without introducing frost in the subgrade or in the excavation walls and bottoms. Precautions should be taken if such activities are to be carried out during freezing conditions. 6.7 Landscaping Considerations Tree Planting Restrictions The proposed development is located in an area of low to medium sensitive silty clay deposits for tree planting. It is expected that the combination of the proposed finished grades and the thickness of the underlying weathered clay crust will provide approximately 2 to 3 m thick buffer to the underlying firm silty clay deposit. Tree planting for this subject development should be limited to low water demand trees. The minimum permissible distance from the foundation will depend on the nature of the tree, the depth of the clay crust and the final grade raise in relation to the permissible grade raise. A minimum permissible distance of 5 m from the foundation wall is recommended for a tree planting. It is well documented in the literature, and is our experience, that fast-growing trees located near buildings founded on cohesive soils that shrink on drying can result in long-term differential settlements of the structures. Tree varieties that have the most pronounced effect on foundations are seen to consist of poplars, willows and some maples (i.e. Manitoba Maples) and, as such, they should not be considered in the landscaping design. Swimming Pools The in-situ soils are considered to be acceptable for swimming pools. Above ground swimming pools must be placed at least 3 m away from the residence foundation and neighbouring foundations. Otherwise, pool construction is considered routine, and can be constructed in accordance with the manufacturer`s requirements. Installation of Decks or Additions If consideration is given to construction of a deck or addition, a geotechnical consultant should be retained by the homeowner to review the site conditions. Additional grading around proposed deck or addition should not exceed permissible grade raises. Otherwise, standard construction practices are considered acceptable. Report: PG June 15, 2012 Page 12
162 patersongroup Ottawa Kingston North Bay Geotechnical Investigation Proposed Residential Development - Block 252 Spratt Road - Ottawa 6.8 Corrosion Potential and Sulphate The results of analytical testing show that the sulphate content is less than 0.1%. This result is indicative that Type 10 Portland cement (normal cement) would be appropriate for this site. The chloride content and the ph of the sample indicate that they are not significant factors in creating a corrosive environment for exposed ferrous metals at this site, whereas the resistivity is indicative of a low to slightly aggressive corrosive environment. Report: PG June 15, 2012 Page 13
163 patersongroup Ottawa Kingston North Bay Geotechnical Investigation Proposed Residential Development - Block 252 Spratt Road - Ottawa 7.0 RECOMMENDATIONS It is a requirement for the foundation design data provided herein to be applicable that a materials testing and observation services program including the following aspects be performed by the geotechnical consultant. Review of grading plan from a geotechnical perspective. Observation of all bearing surfaces prior to the placement of concrete. Sampling and testing of the concrete and fill materials used. Periodic observation of the condition of unsupported excavation side slopes in excess of 3 m in height, if applicable. Observation of all subgrades prior to backfilling and follow-up field density tests to determine the level of compaction achieved. Sampling and testing of the bituminous concrete including mix design reviews. A report confirming that these works have been conducted in general accordance with our recommendations could be issued, upon request, following the completion of a satisfactory materials testing and observation program by the geotechnical consultant. Report: PG June 15, 2012 Page 14


164 patersongroup Ottawa Kingston North Bay Geotechnical Investigation Proposed Residential Development - Block 252 Spratt Road - Ottawa 8.0 STATEMENT OF LIMITATIONS The recommendations made in this report are in accordance with our present understanding of the project. The client should be aware that any information pertaining to soils and all test hole logs are furnished as a matter of general information only and test hole descriptions or logs are not to be interpreted as descriptive of conditions at locations other than those of the test holes. The recommendations provided herein should only be used by the design professionals associated with this project. They are not intended for contractors bidding on or undertaking the work. The present report applies only to the project described in this document. Use of this report for purposes other than those described herein or by person(s) other than Richcraft Homes or their agent(s) is not authorized without review by this firm for the applicability of our recommendations to the altered use of the report. Paterson Group Inc. Kirk Thompson, B.Eng David J. Gilbert, P.Eng. Report Distribution: Richcraft Homes (3 copies) Paterson Group (1 copy) Report: PG June 15, 2012 Page 15
165 APPENDIX 1 SOIL PROFILE AND TEST DATA SHEETS SYMBOLS AND TERMS ANALYTICAL TEST RESULTS
166 patersongroup 154 Colonnade Road South, Ottawa, Ontario K2E 7J5 Consulting Engineers SOIL PROFILE AND TEST DATA Geotechnical Investigation Proposed Residential Development - Block 252 Spratt Road, Ottawa, Ontario DATUM Ground surface elevations referenced to a TBM consisting of the marked bolt on the FILE NO. fire hydrant located at the northeast corner of Spratt Road and Earl Armstrong Road. REMARKS Geodetic elevation o 91.59m was provided. BORINGS BY CME 55 Power Auger DATE April 9, 2012 HOLE NO. BH 1 PG2650 SOIL DESCRIPTION GROUND SURFACE Brown SILTY CLAY 0.60 STRATA PLOT TYPE SAMPLE NUMBER % RECOVERY N VALUE or RQD DEPTH (m) 0 ELEV. (m) Pen. Resist. Blows/0.3m 50 mm Dia. Cone Water Content % Piezometer Construction SS Stiff, brown SILTY CLAY with sand seams firm to very stiff and grey by 2.8m depth End of Borehole 6.00m-April 16, 2012) Shear Strength (kpa) Undisturbed Remoulded
167 patersongroup 154 Colonnade Road South, Ottawa, Ontario K2E 7J5 DATUM REMARKS BORINGS BY CME 55 Power Auger Consulting Engineers DATE Geotechnical Investigation Proposed Residential Development - Block 252 Spratt Road, Ottawa, Ontario Ground surface elevations referenced to a TBM consisting of the marked bolt on the fire hydrant located at the northeast corner of Spratt Road and Earl Armstrong Road. Geodetic elevation o 91.59m was provided. SOIL PROFILE AND TEST DATA April 9, 2012 FILE NO. HOLE NO. PG2650 BH 2 SOIL DESCRIPTION GROUND SURFACE STRATA PLOT TYPE SAMPLE NUMBER % RECOVERY N VALUE or RQD DEPTH (m) 0 ELEV. (m) Pen. Resist. Blows/0.3m 50 mm Dia. Cone Water Content % Piezometer Construction Hard to stiff, brown SILTY CLAY soft to firm and grey by 2.8m depth TW very stiff by 5.0m depth Dynamic Cone Penetration Test 7.92m depth. Cone pushed to 9.96m depth End of Borehole 9.96 Practical DCPT 9.96m depth 0.67m-April 16, 2012) Shear Strength (kpa) Undisturbed Remoulded
168 patersongroup 154 Colonnade Road South, Ottawa, Ontario K2E 7J5 Consulting Engineers SOIL PROFILE AND TEST DATA Geotechnical Investigation Proposed Residential Development - Block 252 Spratt Road, Ottawa, Ontario DATUM Ground surface elevations referenced to a TBM consisting of the marked bolt on the FILE NO. fire hydrant located at the northeast corner of Spratt Road and Earl Armstrong Road. REMARKS Geodetic elevation o 91.59m was provided. BORINGS BY CME 55 Power Auger DATE April 9, 2012 HOLE NO. BH 3 PG2650 SOIL DESCRIPTION GROUND SURFACE STRATA PLOT TYPE SAMPLE NUMBER % RECOVERY N VALUE or RQD DEPTH (m) 0 ELEV. (m) Pen. Resist. Blows/0.3m 50 mm Dia. Cone Water Content % Piezometer Construction SS Very stiff to stiff, brown SILTY CLAY with sand seams firm to very stiff and grey by 2.8m depth TW End of Borehole 0.30m-April 16, 2012) Shear Strength (kpa) Undisturbed Remoulded
169 SYMBOLS AND TERMS SOIL DESCRIPTION Behavioural properties, such as structure and strength, take precedence over particle gradation in describing soils. Terminology describing soil structure are as follows: Desiccated - having visible signs of weathering by oxidation of clay minerals, shrinkage cracks, etc. Fissured - having cracks, and hence a blocky structure. Varved - composed of regular alternating layers of silt and clay. Stratified - composed of alternating layers of different soil types, e.g. silt and sand or silt and clay. Well-Graded - Having wide range in grain sizes and substantial amounts of all intermediate particle sizes (see Grain Size Distribution). Uniformly-Graded - Predominantly of one grain size (see Grain Size Distribution). The standard terminology to describe the strength of cohesionless soils is the relative density, usually inferred from the results of the Standard Penetration Test (SPT) N value. The SPT N value is the number of blows of a 63.5 kg hammer, falling 760 mm, required to drive a 51 mm O.D. split spoon sampler 300 mm into the soil after an initial penetration of 150 mm. Relative Density N Value Relative Density % Very Loose <4 <15 Loose Compact Dense Very Dense >50 >85 The standard terminology to describe the strength of cohesive soils is the consistency, which is based on the undisturbed undrained shear strength as measured by the in situ or laboratory vane tests, penetrometer tests, unconfined compression tests, or occasionally by Standard Penetration Tests. Consistency Undrained Shear Strength (kpa) N Value Very Soft <12 <2 Soft Firm Stiff Very Stiff Hard >200 >30
170 SYMBOLS AND TERMS (continued) SOIL DESCRIPTION (continued) Cohesive soils can also be classified according to their sensitivity. The sensitivity is the ratio between the undisturbed undrained shear strength and the remoulded undrained shear strength of the soil. Terminology used for describing soil strata based upon texture, or the proportion of individual particle sizes present is provided on the Textural Soil Classification Chart at the end of this information package. ROCK DESCRIPTION The structural description of the bedrock mass is based on the Rock Quality Designation (RQD). The RQD classification is based on a modified core recovery percentage in which all pieces of sound core over 100 mm long are counted as recovery. The smaller pieces are considered to be a result of closelyspaced discontinuities (resulting from shearing, jointing, faulting, or weathering) in the rock mass and are not counted. RQD is ideally determined from NXL size core. However, it can be used on smaller core sizes, such as BX, if the bulk of the fractures caused by drilling stresses (called mechanical breaks ) are easily distinguishable from the normal in situ fractures. RQD % ROCK QUALITY Excellent, intact, very sound Good, massive, moderately jointed or sound Fair, blocky and seamy, fractured Poor, shattered and very seamy or blocky, severely fractured 0-25 Very poor, crushed, very severely fractured SAMPLE TYPES SS - Split spoon sample (obtained in conjunction with the performing of the Standard Penetration Test (SPT)) TW - Thin wall tube or Shelby tube PS - Piston sample AU - Auger sample or bulk sample WS - Wash sample RC - Rock core sample (Core bit size AXT, BXL, etc.). Rock core samples are obtained with the use of standard diamond drilling bits.
171 SYMBOLS AND TERMS (continued) GRAIN SIZE DISTRIBUTION MC% - Natural moisture content or water content of sample, % LL - Liquid Limit, % (water content above which soil behaves as a liquid) PL - Plastic limit, % (water content above which soil behaves plastically) PI - Plasticity index, % (difference between LL and PL) Dxx - Grain size which xx% of the soil, by weight, is of finer grain sizes These grain size descriptions are not used below mm grain size D10 - Grain size at which 10% of the soil is finer (effective grain size) D60 - Grain size at which 60% of the soil is finer Cc - Concavity coefficient = (D30) 2 / (D10 x D60) Cu - Uniformity coefficient = D60 / D10 Cc and Cu are used to assess the grading of sands and gravels: Well-graded gravels have: 1 < Cc < 3 and Cu > 4 Well-graded sands have: 1 < Cc < 3 and Cu > 6 Sands and gravels not meeting the above requirements are poorly-graded or uniformly-graded. Cc and Cu are not applicable for the description of soils with more than 10% silt and clay (more than 10% finer than mm or the #200 sieve) CONSOLIDATION TEST p o - Present effective overburden pressure at sample depth p c - Preconsolidation pressure of (maximum past pressure on) sample Ccr - Recompression index (in effect at pressures below p c ) Cc - Compression index (in effect at pressures above p c ) OC Ratio Overconsolidaton ratio = p c / p o Void Ratio Initial sample void ratio = volume of voids / volume of solids Wo - Initial water content (at start of consolidation test) PERMEABILITY TEST k - Coefficient of permeability or hydraulic conductivity is a measure of the ability of water to flow through the sample. The value of k is measured at a specified unit weight for (remoulded) cohesionless soil samples, because its value will vary with the unit weight or density of the sample during the test.
172
173 Order #: Certificate of Analysis Client: Paterson Group Consulting Engineers Report Date: 14-May-2012 Order Date:9-May-2012 Client PO: Project Description: PG2650 Client ID: BH3-SS Sample Date: 10-Apr Sample ID: MDL/Units Soil Physical Characteristics % Solids 0.1 % by Wt General Inorganics ph 0.05 ph Units Resistivity 0.10 Ohm.m Anions Chloride 5 ug/g dry <5 [1] Sulphate 5 ug/g dry 53 [1] Page 3 of 7
174 APPENDIX 2 FIGURE 1 - KEY PLAN DRAWING PG TEST HOLE LOCATION PLAN


175 SITE FIGURE 1 KEY PLAN
176
177 Appendix E Background Reports Excerpts
178 DESIGN REPORT RIVERSIDE SOUTH DEVELOPMENT CORPORATION RIVERSIDE SOUTH COMMUNITY PHASE 9 CITY OF OTTAWA October 2010 Revised May 2011 Revised September 2011 Revised December 2011 Prepared for: RIVERSIDE SOUTH DEVELOPMENT CORPORATION 2193 Arch Street Ottawa, Ontario K1G 2H5 Prepared by: J.L. RICHARDS & ASSOCIATES LIMITED Consulting Engineers, Architects & Planners 864 Lady Ellen Place Ottawa, Ontario K1Z 5M2 JLR
179 DESIGN REPORT RIVERSIDE SOUTH DEVELOPMENT CORPORATION RIVERSIDE SOUTH COMMUNITY PHASE 9 CITY OF OTTAWA 1.0 INTRODUCTION 1.1 Scope Riverside South Development Corporation (RSDC) has retained the services of J.L. Richards & Associates Limited (JLR) to proceed with the detailed design of municipal services for Phase 9 of the Riverside South Community (RSC). This Report outlines the proposed servicing strategy for the development, in accordance with the November 2009 Servicing Study Guidelines for Development Applications in the City of Ottawa (City) and the Master Plan Documents prepared for the RSC area. This Design Report contains the objectives, design criteria, constraints and detailed design strategy for servicing the subject lands with water, wastewater, and stormwater management services. This Report also includes the strategies and solutions for implementing erosion and sedimentation control throughout the construction life of the project. Finally, the Agencies requiring approvals and/or permits have been identified, along with the necessary steps for obtaining these approvals. 1.2 Report Revisions Since the second submission (dated May 2011), there have been several revisions to the Phase 9 Design Report as a result of comments received from the City and new information becoming available. A summary of these changes is provided below: Geotechnical Report and Memoranda: A new Geotechnical Report (dated June 2011) has been issued for the proposed development, with no changes to the findings and recommendations of the previous version of the Report (copy provided under separate cover). Additionally, two Technical Memoranda have been issued to confirm that the proposed grading is acceptable, and to address the setback from the deep sewers located in the easement at the extension of Mattingly Way near the existing Park and Ride Facility. These documents are included in Appendix B for reference. Water Servicing: There have not been any revisions to the proposed water distribution system and hydraulic network analysis, with the exception of some minor relocations of hydrants to eliminate conflicts with other services. JLR October 2010 Revised May 2011 Revised September J.L. Richards & Associates Limited
180 Riverside South Development Corporation Design Report Riverside South Community Phase 9 Wastewater Servicing: There have not been any significant changes to the proposed Phase 9 wastewater servicing. Details have been coordinated with the Consultant for the Claridge Summerhill Village development, including the addition of a previously omitted sanitary drainage area west of River Road. Storm Servicing and Stormwater Management: There have not been any significant changes to the proposed storm servicing and stormwater management systems. Details have been coordinated with the Consultant for the Summerhill Village development, including the design of the storm trunk sewer on River Road, an additional storm subcatchment area deviation, and revisions to the proposed hydraulic grade line. 1.3 Property Description The Phase 9 lands consist of a 42.0 ha parcel located in the RSC, east of River Road and south of Earl Armstrong Road, as depicted on the Site Location and Study Area Plan in Figure 1.1. The RSDC Phase 9 Subdivision Draft Plan is shown on Figure 1.2. Currently, the land is undeveloped. Its topography is relatively flat, as a result of past farming activities; generally, the land slopes from the northeast corner at Earl Armstrong Road and Spratt Road to its southwest boundary. The Phase 9 parcel does not contain any notable forestation or identified archaeological significance; however, there are two (2) small tributaries (N5-R2 and S5-R2) located within the parcel boundaries. 1.4 Proposed Development The current RSDC Phase 9 development consists of 160 single family units, 329 townhouses, 216 stacked townhouse units, and a commercial block (Block 256) located at the intersection of Earl Armstrong Road and Spratt Road. The RSDC Phase 9 development is bisected into a northern and southern portion by the proposed Claridge Homes Summerhill Village development, which has recently been submitted for review. Based on information provided, it is assumed that the Claridge development will include 127 single family units and 152 townhouses. Additionally, the combined development area includes three (3) existing single family dwellings along River Road, and a future school and community park on Summerhill Street. The development of the southeast portion and a small southwest portion of the RSDC Phase 9 lands will require the construction of the Stormwater Management Facility Pond No. 5, referred to as Pond 5 in the Riverside South Community Infrastructure Servicing Study Update (RSCISSU), dated September 2008 and prepared by JLR October 2010 Revised May 2011 Revised September J.L. Richards & Associates Limited
181 Riverside South Development Corporation Design Report Riverside South Community Phase 9 Stantec Inc. (Stantec). Consequently, these areas are not planned for construction and are not included as part of this Application. These portions of Phase 9, henceforward referred to as Future Phase 9 (refer to Drawing OS at back of the Report for limits), are planned to be constructed coincident with the construction of Pond 5. It is important to note that, during the detailed design process, minor deviations from the RSCISSU (September 2008) and subsequent RSCISSU revisions provided in the lettertype reports issued by Stantec (June 2009 and May 2010) were required to facilitate servicing. These deviations are described in detail in the appropriate sections of this Report, and summarized as follows: 1) The major overland flow route suggested in the RSCISSU proposed, in general, a route flowing from the northeast to the southwest, while both the minor storm sewer system and sanitary sewer system generally flow in the opposite direction (i.e., from south to north). Due to grade raise restrictions, it was determined that, for a portion of the southerly lands, the required separation distance of 0.30 m from the underside of footing (USF) and the hydraulic grade line (HGL) would not be achievable. Hence, in conjunction with Claridge Homes and the guidance of Stantec (refer to Appendix B for meeting minutes from May 19, 2010), it was decided to grade the site such that some of the major overland flow would be directed towards River Road north of the original outlet point. 2) Coincident with the above deviation, it was decided by both Claridge Homes and RSDC to attempt to store on site the 1:100 year storm event to mitigate any adverse impacts resulting from the revised overland flow route. The requirements for storage were modelled using the Stantec SWMHYMO input files and, since both sites are relatively flat, it was found that the new storage requirements were achievable. It should be noted that there are two portions of the Claridge lands where the full containment of the 1:100 year storm event could not be achieved. This overflow was allowed to spill onto the southern portion of the RSDC lands, where additional storage volume was available. It was also determined during detailed design that, in the southern portion of the RSDC Phase 9 lands, maintaining strict adherence to both the sanitary and storm drainage boundaries proposed in the RSCISSU would not be achievable, as the required cover could not be provided for sewer obverts at the upstream ends of the systems. Consequently, sanitary and storm drainage boundaries have been modified. Details of these changes are described in Sections 4.3 and of this Report. JLR October 2010 Revised May 2011 Revised September J.L. Richards & Associates Limited
182 Riverside South Development Corporation Design Report Riverside South Community Phase Background Information The RSC encompasses approximately 1,800 ha (4,500 acres) south of the Ottawa Macdonald-Cartier International Airport and east of the Rideau River. The community is located in the former City of Gloucester, which amalgamated with the City of Ottawa in The original Land Use Plan for the community was adopted in 1992, and has evolved to include a Community Development Plan (CDP), depicted on Figure 1.3. The current CDP and its Implementation Guidelines (approved by City Council on June 22, 2005) provide the guidelines and supporting information for community design in this area. To further assist and facilitate design in the Riverside South Community (RSC), numerous technical studies have been completed with respect to servicing, geotechnical and environmental considerations. The most recent Infrastructure Servicing Study Update (RSCISSU) and Master Drainage Plan Update (RSCMDPU), as identified below, provide the approved design criteria for infrastructure design in the subject area and have been implemented into the detailed servicing design of the Phase 9 lands Master Servicing Study Letter-type Report regarding Riverside South Community Storm Sewer Realignment at Park and Ride (Stantec, May 4, 2010). Letter-type Report regarding Riverside South Community Storm and Sanitary Sewer Realignment at Transit Corridor (Stantec, June 12, 2009). Riverside South Community Infrastructure Servicing Study Update (RSCISSU), Final Report (Stantec, 2008) Master Drainage Study Riverside South Community Master Drainage Plan Update (RSCMDPU), Final Report (Stantec, September 2008) Geotechnical Studies Technical Memorandum, Grading Plan Review, Proposed Residential Development, Riverside South Community Phase 9, Ottawa, Ontario (Golder Associates, No , September 29, 2011). JLR October 2010 Revised May 2011 Revised September J.L. Richards & Associates Limited
183 Riverside South Development Corporation Design Report Riverside South Community Phase 9 Technical Memorandum, Foundations Townhouse Block 17, Proposed Residential Development at Sewer Easement (Block 239), Riverside South Community Phase 9, Ottawa, Ontario (Golder Associates, No , September 23, 2011). Report on Geotechnical Investigation, Proposed Residential Development, Riverside South Development (Phase 9), Ottawa, Ontario (Golder Associates, Report No , June 2011). Preliminary Geotechnical Investigation, Proposed Residential Development, Riverside South Community Development Phases 6 to 9, Ottawa, Ontario (Golder Associates, Report Number , September 24, 2009). 1.6 Existing Infrastructure Water The Phase 9 lands are to be serviced by the existing infrastructure located on Earl Armstrong Road, as shown in Figure 1.4, and in accordance with the RSCISSU. Water servicing will be supplied by three (3) connections to existing watermain stubs: one (1) 300 mm diameter watermain connection on River Road at Earl Armstrong Road; one (1) 400 mm diameter connection on Brian Good Avenue at Earl Armstrong Road; and one (1) 300 mm diameter connection on Spratt Road at Earl Armstrong Road Wastewater There are two (2) sanitary sewer outlets for the Phase 9 lands that connect to existing stubs. The majority of the wastewater generated in Phase 9 will be conveyed by gravity sewers to a 525 mm diameter sanitary sewer stub located at the Park and Ride Facility on the south side of Earl Armstrong Road. The wastewater generated in the northeast quadrant of Phase 9 will be conveyed by gravity sewers to a 525 mm diameter sanitary sewer stub on Spratt Road at Earl Armstrong Road Stormwater There are two (2) storm sewer outlets for the Phase 9 lands that connect to existing stubs. The majority of the minor system flow will be conveyed by gravity sewers to a 1700x2650 mm elliptical storm sewer stub, located at the Park and Ride Facility, as noted in Section The northeast portion of the RSDC Phase 9 development will outlet to a 1650 mm diameter storm sewer stub on Brian Good Avenue at JLR October 2010 Revised May 2011 Revised September J.L. Richards & Associates Limited
184 Hunt Club Airport Lester Existing Railway Line Bank Woodroffe Ottawa International Airport Merivale Limebank Existing Railway Line Fallowfield River Leitrim Proposed RTC Albion Spratt Earl Armstrong Bowesville Rideau Spratt RSDC PHASE 9 Mitch Owens River This drawing is copyright protected and may not be reproduced or used for purposes other than execution of the described work without the express written consent of J.L. Richards & Associates Limited. PROJECT: RIVERSIDE SOUTH PHASE 9 CITY OF OTTAWA.L. Richards DRAWING: DESIGN: DRAWN: CHECKED: K.T.K. K.T.K. J.L.P. PLOTTED: Apr 29, 2011 SITE LOCATION AND STUDY AREA DRAWING NO.: FIGURE 1.1 JLR NO:
185 This drawing is copyright protected and may not be reproduced or used for purposes other than execution of the described work without the express written consent of J.L. Richards & Associates Limited. PROJECT: RIVERSIDE SOUTH PHASE 9 CITY OF OTTAWA DRAWING: COPY OF DRAFT PLAN OF SUBDIVISION DESIGN: OTHER DRAWN: OTHER CHECKED: J.L.P. PLOTTED: Apr25,2011 DRAWING NO.: FIGURE 1.2 JLR NO:
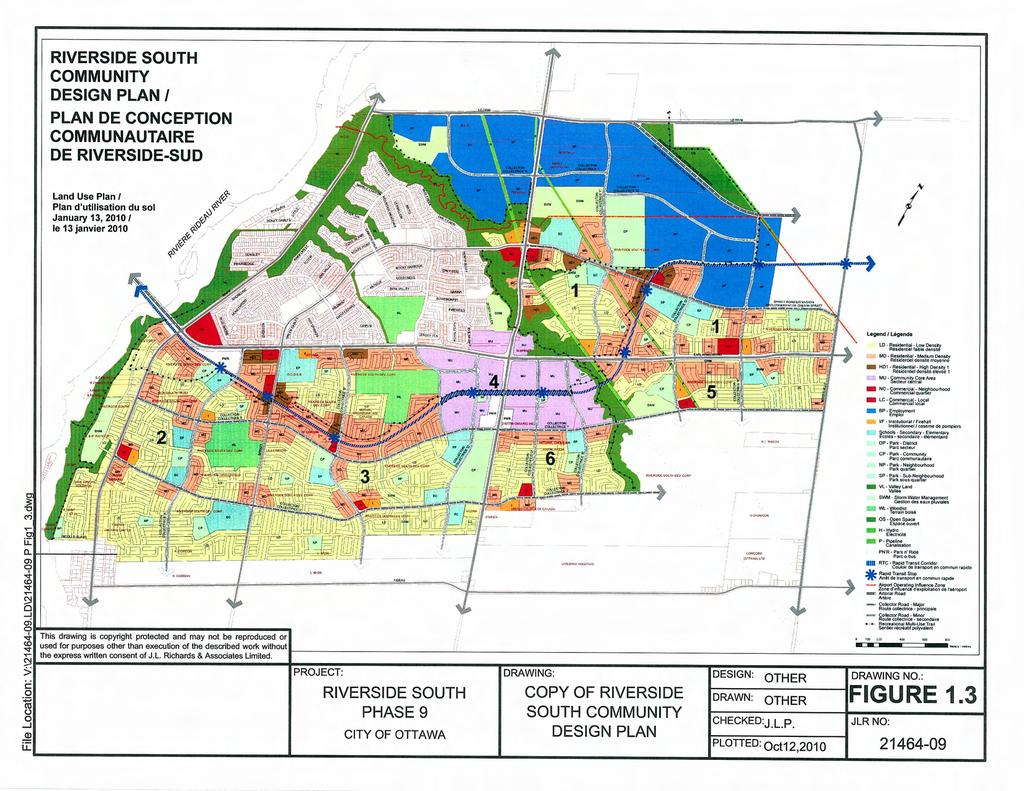
186
187 400mmØ WM 300mmØ WM 2100mmØ STM 525mmØ SAN 2100mmØ STM 525mmØ SAN Existing Watermain Existing Sanitary Sewer Existing Storm Sewer Future Phase 9 300mmØ WM EARL ARMSTRONG ROAD 300mmØ WM 400mmØ WM 525mmØ SAN 2100mmØ STM INVERTS STM = 84.53m SAN = 83.60m 1650mmØ STM 1500mmØ STM INVERTS STM = 85.39m 1050mmØ STM 2400mmØ STM 300mmØ WM 525mmØ SAN INVERTS STM = 83.69m SAN = 85.15m RIVER ROAD CLARIDGE SUMMERHILL VILLAGE SPRATT ROAD This drawing is copyright protected and may not be reproduced or used for purposes other than execution of the described work without the express written consent of J.L. Richards & Associates Limited..L. Richards PROJECT: RIVERSIDE SOUTH PHASE 9 CITY OF OTTAWA DRAWING: LOCATION OF EXISTING INFRASTRUCTURE DESIGN: J.L.P. DRAWN: K.T.K. CHECKED: J.L.P. PLOTTED: Apr29,2011 DRAWING NO.: FIGURE 1.4 JLR NO:
188 Riverside South Development Corporation Design Report Riverside South Community Phase 9 Earl Armstrong Road. Both storm sewer outlets convey storm runoff to the existing 2100 mm diameter storm sewer along River Road, which discharges to the existing Stormwater Management Facility Pond No. 1 (Pond 1). 1.7 Consultation and Permits Consultation has been initiated with the City of Ottawa (City), the Rideau Valley Conservation Authority (RVCA), and the Ontario Ministry of the Environment (MOE). Copies of the consultation correspondence and permits are included in Appendix B. There are two (2) existing tributaries (N5-R2 and S5-R2) located within the Phase 9 development boundaries, both classified as indirect fish habitat, which will need to be filled to achieve the required grading for the Phase 9 Subdivision. An Application was submitted to the RVCA in April 2010, and Permits to fill the existing watercourses were issued on July 21, 2010 (refer to Appendix B ). Additionally, it has been determined that water taking may occur during construction. A Permit To Take Water (PTTW) has been granted by the MOE (Permit Number AZKWD). 2.0 GRADING AND GEOTECHNICAL CONSIDERATIONS Since the second submission, the geotechnical investigation by Golder Associates has been finalized. There are no changes to the findings and recommendations of the Geotechnical Report since the second submission. Additionally, two (2) Technical Memoranda have been issued to confirm that the proposed grade raises are acceptable, and to address the setback from the deep sewers located in the easement at the extension of Mattingly Way near the existing Park and Ride Facility. 2.1 General A geotechnical investigation was carried out by Golder Associates to assess general soil and groundwater conditions, and to provide recommendations for developing a residential subdivision, including construction considerations. The findings and recommendations of this investigation have been compiled in the document entitled Report on Geotechnical Investigation, Proposed Residential Development, Riverside South Development (Phase 9), Ottawa, Ontario, Report No , by Golder Associates (June 2011), a copy of which has been provided under separate cover. JLR October 2010 Revised May 2011 Revised September J.L. Richards & Associates Limited
189 Riverside South Development Corporation Design Report Riverside South Community Phase 9 Generally, the surficial geology of the Phase 9 lands consists of a topsoil layer ranging from 80 mm to 360 mm in depth, with some local pockets of fill. The subsurface stratigraphy consists of either layered silty sand/sandy silt and weathered silty clay, or weathered silty clay only, extending to depths ranging from 1.4 m to 10.4 m. This layered deposit is underlain by a deposit of unweathered grey silty clay, which, itself, is underlain by glacial till. Groundwater was measured in six (6) boreholes, at depths ranging between 0.3 m and 1.9 m below the existing ground surface. For specific soil details and construction considerations, refer to the detailed Geotechnical Report. For immediate reference, the recommended grade raise restrictions and pavement structure design requirements are presented in Table 2.1 and Table 2.2, while the proposed Grading Plans are included in Appendix C. Table 2.1: Grade Raise Restrictions Zone Location Maximum Grade Raise A Northwest Quadrant 3.0 m B Northeast Quadrant 1.6 m C Southern Portion 1.8 m D Southern Central Portion 1.0 m Notes: Taken from Geotechnical Investigation Proposed Residential Development, Riverside South Community Development Phase 9, Ottawa, Ontario prepared by Golder Associates (June 2011). Table 2.2: Recommended Pavement Structure Pavement Component Collector Roads Thickness Local Roads (1) Thickness Superpave 12.5 mm (or HL3) 40 mm 50 mm Superpave 19.0 mm (or HL8) 50 mm - Granular A Base 150 mm 150 mm Granular B Type II Subbase 450 mm (2) 375 mm Notes: Taken from Geotechnical Investigation Proposed Residential Development, Riverside South Community Development Phase 9, Ottawa, Ontario prepared by Golder Associates (June 2011). (1) No bus or truck traffic. (2) For arterial roadways, subbase thickness should be increased to 600 mm. JLR October 2010 Revised May 2011 Revised September J.L. Richards & Associates Limited
190 Riverside South Development Corporation Design Report Riverside South Community Phase Geotechnical Memoranda Since the second submission, Golder Associates has issued two (2) Technical Memoranda for the purpose of reviewing the proposed Phase 9 design. These documents are included in Appendix B for reference. The first Memorandum (dated September 29, 2011) reviews the proposed Grading Plan, and confirms that the proposed grade raises are acceptable. A recommendation was made that the rear yard footings for some of the residential units should be made deeper, or provided with insulation, in order to achieve the required frost protection. The second Memorandum (dated September 23, 2011) investigates the suitability of the proposed townhouse foundations and the setback from the deep sanitary sewer located in the easement at the extension of Mattingly Way near the existing Park and Ride Facility. It was determined that the proposed setback and the stepped footings for the adjacent townhouse units would provide acceptable clearance from the zone of influence of the trench to the building foundations. 3.0 WATER SERVICING The changes to the proposed water supply and distribution system since the second submission are limited to some minor relocations of hydrants to eliminate conflicts with other services (e.g., catch basin leads, services to residential units, utilities). These changes do not affect the Hydraulic Network Analysis and simulation results, as described in the second submission. 3.1 Background In order to confirm watermain sizing, a Hydraulic Network Analysis (HNA) was conducted for the RSDC Phase 9 development. The proposed network for the Claridge Homes Summerhill Village development was incorporated into the analysis, as it bisects the RSDC Phase 9 land into a northern and a southern portion. The southern portion is reliant on the construction of watermain trunks on Brian Good Avenue and River Road by Claridge Homes, while the northern portion can mostly be accommodated by the existing system. JLR October 2010 Revised May 2011 Revised September J.L. Richards & Associates Limited
191 Riverside South Development Corporation Design Report Riverside South Community Phase 9 To obtain the Certificate of Approval (C of A) from the MOE for Phase 9, the City has requested that an HNA be carried out to demonstrate compliance of the proposed distribution system with regulatory standards. The current and future servicing conditions for the RSDC Phase 9 development are noted in Section 1.4 of this Report. As previously noted, the Future Phase 9 portion is reliant on the construction of Pond 5 and is therefore not included in this analysis. The proposed RSDC Phase 9 water servicing is presented in Figure 3.1, while supporting information for the HNA is provided in Appendix D. Since the time of the first submission, it has been confirmed that the 2W/2C feedermain will be completed and commissioned by Fall 2011, while occupancy of RSDC Phase 9 will only occur in Spring 2012 (refer to Appendix D for City correspondence). Therefore, the description of the proposed water servicing and the HNA simulation results provided in Sections 3.2 and 3.3 have been updated to reflect the 2W/2C servicing condition. Analysis under the existing condition has been included in Section 3.4 for information purposes, and in case of unforeseen delays in the construction and commissioning of the 2W/2C feedermain. Also, at the request of the City of Ottawa, the section of watermain trunk on Borbridge Avenue (Collector I ) identified as 305 mm diameter (Drawing WM-1 in the RSCISSU) between Brian Good Avenue and River Road was increased to 406 mm diameter watermain. This request has been incorporated and modelled as part of the current HNA. 3.2 Water Supply and Distribution System Watermain Pressure and Demand Objectives The principal goal of a water supply and distribution system is to provide a reliable supply of potable water to all of its consumers. Peak water demands are generally met through a combination of pumping, storage and transmission mains. To assess the reliability of the RSDC Phase 9 water supply and distribution system, the City of Ottawa Design Guidelines for Water Distribution (July 2010) were used. Section of that document requires that all new development additions to the public water distribution system be designed such that the minimum and maximum water pressures, as well as flow rates, conform to the following: JLR October 2010 Revised May 2011 Revised September J.L. Richards & Associates Limited
192 Riverside South Development Corporation Design Report Riverside South Community Phase 9 i) In accordance with MOE Guidelines, the distribution system shall be sized so that, under maximum hourly demand conditions (peak hour), the pressures are not less than 276 kpa (40 psi). ii) iii) iv) Where fire flow is provided; during periods of maximum day and fire flow demand, the residual pressure at any point in the distribution system shall not be less than 140 kpa (20 psi). In accordance with the Ontario Code & Guide for Plumbing, the maximum pressure at any point in the distribution system in occupied areas outside of the public right-of-way shall not exceed 552 kpa (80 psi). The maximum pressure at any point in the distribution system in unoccupied areas shall not exceed 689 kpa (100 psi). v) Feedermains, which have been provided primarily for the purpose of redundancy, shall meet, at a minimum, the basic day plus fire flow demand Water Demands To assess the water supply and distribution system, water demands were simulated to evaluate system pressures with respect to the pressure criteria listed in Section The average day demand was first calculated based on a residential consumption rate of 350 L/capita/day, as recommended in the Water Distribution Design Guidelines. Once calculated, the average day demand was used to compute the maximum daily and peak hourly demands using the ratios recommended in the Guidelines. For residential land uses, the Guidelines recommend a maximum day to average day ratio of 2.5, and a peak hourly to maximum day ratio of 2.2. To estimate the demands for the proposed and existing institutional and commercial blocks, the water consumption rates presented in Table 4.2 of the Guidelines were used, along with a maximum day to average day ratio of 1.5, and a peak hourly to maximum day ratio of 1.8. Additionally, a water demand of 4 L/s (flat rate) was used for splash pads in park areas, as confirmed by a parks planner for the City of Ottawa (refer to Appendix D for copy of correspondence). Table 3.1 below presents the overall water demands that were calculated using the aforementioned design parameters for the Study Area, including the RSDC Phase 9 and Claridge Summerhill Village developments, as well as existing residential, commercial, institutional and park areas along Earl Armstrong and Spratt Roads, from River Road to JLR October 2010 Revised May 2011 Revised September J.L. Richards & Associates Limited
193 Riverside South Development Corporation Design Report Riverside South Community Phase 9 the Canyon Walk/Goldeneye Way intersection (for a detailed demand breakdown, refer to the Water Consumption Summary Table included in Appendix D ). Average Day Demand Table 3.1: Calculated Water Demands Maximum Day Demand Peak Hourly Demand 37.3 L/s 82.9 L/s L/s Notes: Demands include RSDC Phase 9 and Claridge Homes development; existing residential, institutional, and park areas along Spratt Road from Earl Armstrong Road to the Canyon Walk/Goldeneye Way intersection; and existing commercial area at Earl Armstrong/River Road intersection Watermain Sizing and Roughness Coefficients The overall watermain layout for the RSDC Phase 9 is shown in Figure 3.1. Watermain roughness coefficients were determined using the friction factors presented in Section of the Water Distribution Design Guidelines and summarized in Table 3.2 below. The elevations used in the HNA are the proposed centreline of road elevations, as shown on the Grading Plans in Appendix C. Table 3.2: Watermain Roughness Coefficients Watermain Diameter C-Factor 150 mm to 250 mm to 600 mm 120 Over 600 mm 130 WaterCAD Schematic Drawings showing watermain sizes and junction elevations were prepared, along with Junction and Pipe Summary Reports detailing the parameters used in the simulation (refer to Appendix D ). The inside pipe diameters were modelled based on Section of the Guidelines, as summarized in Table 3.3. JLR October 2010 Revised May 2011 Revised September J.L. Richards & Associates Limited
194 Riverside South Development Corporation Design Report Riverside South Community Phase 9 Table 3.3: PVC Watermain Pipe Inside Diameters Nominal Diameter Inside Diameter 200 mm 204 mm 300 mm 297 mm 400 mm 393 mm Simulation of Fire Flows Various guidelines are used throughout North America to establish fire flow requirements for different types of buildings. The Guidelines provided by the Fire Underwriters Survey (FUS) govern fire flow protection requirements in the City of Ottawa. Previously approved reports for the City of Ottawa (Genivar Servicing Report, December 2006, and Stantec River Ridge Water Supply Assessment Report, February 2005) identified fire flow requirements for the Riverside South Catholic High School (RSCHS) and residential units. However, these requirements were reconsidered as part of this HNA. The FUS Guidelines (Water Supply for Public Fire Protection, 1999) were used to determine the fire flow needed for single homes, townhomes and stacked flats (refer to Appendix D for proposed fire flow requirement calculations). The required fire flows for institutional and commercial blocks were selected based on previous experience with these types of developments in the City of Ottawa (since the actual construction of these sites has not yet been determined). As such, a fire flow of 150 L/s was selected as providing sufficient fire flow to these land uses in the Study Area. On this basis, simulations were conducted with the minimum fire flow requirements listed in Table 3.4. Table 3.4: Fire Flow Requirements Land Usage Single Family Units Townhouse Units Stacked Flats Commercial/Institutional Min. Fire Flow Requirement 100 L/s 120 L/s 135 L/s 150 L/s JLR October 2010 Revised May 2011 Revised September J.L. Richards & Associates Limited
195 EARL ARMSTRONG ROAD RIVER ROAD CLARIDGE SUMMERHILL VILLAGE SPRATT ROAD This drawing is copyright protected and may not be reproduced or used for purposes other than execution of the described work without the express written consent of J.L. Richards & Associates Limited..L. Richards PROJECT: Existing 300mmØ Watermain Existing 400mmØ Watermain Proposed 200mmØ Watermain RIVERSIDE SOUTH PHASE 9 CITY OF OTTAWA DRAWING: WATER SERVICING PLAN Proposed 300mmØ Watermain Future Phase 9 Proposed 400mmØ Watermain Proposed Watermain Summerhill Village by Claridge Homes DESIGN: DRAWN: J.L.P. T.B. CHECKED: J.L.P. PLOTTED: Apr29,2011 DRAWING NO.: FIGURE 3.1 JLR NO:
196 Riverside South Development Corporation Design Report Riverside South Community Phase Proposed Servicing The proposed water servicing for the Phase 9 development is depicted in Figure 3.1. It is proposed to supply potable water to the development via three (3) watermain connections: one (1) 300 mm diameter watermain connection on River Road at Earl Armstrong Road (to extend south along River Road), one (1) 400 mm diameter connection at Earl Armstrong Road and Brian Good Avenue (to extend south along Brian Good Avenue), and one (1) 300 mm diameter watermain on Spratt Road (to extend south from Earl Armstrong Road). In addition, a 400 mm diameter watermain is proposed along Borbridge Avenue from River Road to Brian Good Avenue, as requested by the City Hydraulic Boundary Conditions The HNA was carried out using hydraulic boundary conditions supplied by City staff for the existing and 2W/2C supply conditions, as summarized in Table 3.5 below (refer to Appendix D for a copy of the correspondence, dated November 24, 2009). At the time of preparation of the above correspondence and of the first submission of this Report, it was envisioned that the 2W/2C feedermain would be operational in 2016 (and the 2W/2C condition was labelled as the future interim condition ). Based on recent correspondence from the City project manager for the 2W/2C feedermain construction (refer to Appendix D ), the supply characteristics associated with the future interim condition will apply before the end of 2011 (i.e., after October 31, 2011). Therefore, for the purpose of this Report, the future interim condition shall be referred to as the 2W/2C condition. Since the first units in RSDC Phase 9 will not be occupied until Spring 2012, the 2W/2C supply condition forms the basis of the current HNA, and the existing supply characteristics are not expected to apply to RSDC Phase 9 water servicing. However, the performance of the distribution system was analysed under the existing supply condition, and simulation results have been included in Appendix D, and summarized in Section 3.4 for information purposes. Water supply to Phase 9 was simulated in WaterCAD using one (1) static reservoir at the intersection of Spratt Road and Canyon Walk / Goldeneye Way for the peak hour, maximum day plus fire flow, and high pressure demand conditions. JLR October 2010 Revised May 2011 Revised September J.L. Richards & Associates Limited
197 Riverside South Development Corporation Design Report Riverside South Community Phase 9 Table 3.5: Hydraulic Boundary Conditions at Spratt Road and Goldeneye Way Static Elevation Water Demands 2W/2C Condition Existing Condition Peak Hour m m Maximum Day + Fire Flow m m High Pressure m m 3.3 Simulation Results Under the 2W/2C Supply Condition Peak Hour Demand The proposed servicing was simulated under peak hourly demand conditions using the 2W/2C boundary conditions presented in Table 3.5. Results for this demand condition indicate that the simulated pressures within RSDC Phase 9 are expected to range between kpa (55.7 psi) at Junction J-31 to kpa (60.7 psi) at Junction J-53. The computed pressures fall between the minimum and maximum operating pressures of 276 kpa (40 psi) and 552 kpa (80 psi), as recommended in the Water Distribution Design Guidelines (refer to Appendix D for WaterCAD simulation results). The Guidelines also recommend the use of 25 mm diameter water services for residential areas having pressures less than 310 kpa (45 psi) under peak demand flow conditions. However, the minimum simulated pressure of 384 kpa (55.7 psi) exceeds that limit; therefore, 20 mm diameter service connections are proposed for all units in Phase 9. Additionally, there are 216 stacked townhouse units located off of Poplin Street in the northeastern portion of the Phase that require a greater pressure due to the configuration of these units. Their configuration is such that the top stacked townhouse unit will have its first floor located approximately 5 m above the centreline elevation. Therefore, the following methodology was applied to ensure an adequate level of service is provided to the top townhouse units: The following relationship describes the acceptable elevation differences for stacked townhouses that will achieve the minimum pressure requirement of 276 kpa for the top unit: (HGL - CL - H) x K > 276 kpa JLR October 2010 Revised May 2011 Revised September J.L. Richards & Associates Limited
198 Riverside South Development Corporation Design Report Riverside South Community Phase 9 where: HGL Minimum hydraulic grade line elevation (m) under peak hour demand conditions CL Maximum acceptable centreline elevation (m) to achieve the minimum pressure requirement H Height difference (m) between the centreline and finished floor elevations of the top unit (i.e., 5 m) K Constant relating metres to pressure in kpa (i.e., kpa/m) The stacked townhouse units are serviced from the proposed 200 mm diameter watermain on Poplin Street. The minimum simulated HGL elevation along Poplin Street under the 2W/2C peak hour demand condition is m at J-20. Solving the above relationship yields the maximum acceptable CL elevation: (HGL - CL - H) x K > 276 kpa ( m - CL - 5 m) x kpa/m > 276 kpa ( m - CL) > m CL < m Therefore, stacked townhouse units that have centreline elevations below m will generate pressures in excess of 276 kpa. The proposed centreline elevations along Poplin Street are all less than m (on average approximately m). Consequently, the projected operating pressure for the top units under the 2W/2C servicing condition is 349 kpa (50 psi), which well-exceeds the minimum required pressure of 276 kpa. Since the projected operating pressure also exceeds 310 kpa, 20 mm diameter service connections are proposed for all stacked townhouse units in Phase Maximum Day Demand Plus Fire Flow Section of the City Design Guidelines requires that the distribution system satisfies the maximum day demand combined with a fire flow condition, as presented in Section The simulation was carried out by adding a fire flow demand of 100 L/s for singles, 120 L/s for townhouses, 135 L/s for stacked units, and 150 L/s for commercial/institutional lands, simultaneously to the maximum day demand. Simulation results for the 2W/2C condition indicate that fire flow availabilities exceed 180 L/s everywhere in the Phase 9 Study Area, with the exception of Hydrant H-48 on Rosina Avenue where L/s is expected. Since single units are proposed along Rosina JLR October 2010 Revised May 2011 Revised September J.L. Richards & Associates Limited
199 Riverside South Development Corporation Design Report Riverside South Community Phase 9 Avenue, the FUS fire flow requirement of 100 L/s will be achieved. Therefore, the minimum fire flow requirements for firefighting purposes will be met High Pressure Under Average Day Demand A high pressure analysis was carried out to ensure that the maximum pressure constraint of 552 kpa (80 psi) is not exceeded. This scenario was simulated under the average day demand using the maximum hydraulic grade line boundary conditions under the 2W/2C development conditions presented in Table 3.5. The simulation results indicate a maximum pressure of kpa (79.2 psi) at Junctions J-53 and J-56, which falls below the maximum pressure of 552 kpa (80 psi), as recommended in the City Design Guidelines (refer to Appendix D for WaterCAD simulation results). Consequently, pressure reducing valves (PRVs) are not required in Phase Simulation Results Under the Existing Supply Condition The HNA simulation results for the existing supply condition are summarized below for information purposes, and in case of delay for the construction and commissioning of the 2W/2C feedermain that would occur after the initial occupancy for RSDC Phase 9 (refer to Appendix D for detailed WaterCAD simulation results). Peak Hour Demand: Simulated pressures under peak hour demand conditions were found to range from kpa (41.1 psi) at Junction J-31 to kpa (46.1 psi) at Junction J-53. These results fall within the required pressure range of 276 kpa (40 psi) to 552 kpa (80 psi), as recommended in the City Design Guidelines. The simulated operating pressure for the top units of the stacked townhouses along Poplin Street is approximately 248 kpa (36 psi), i.e., 28 kpa (4 psi) less than the 276 kpa pressure requirement. These stacked units are not scheduled for construction and occupancy until after the construction and commissioning of the 2W/2C feedermain. However, in the unlikely event that occupancy of the stacked units coincides with the existing water supply condition, the temporary reduced pressure can be mitigated by the use of 25 mm diameter water service connections for these units. Maximum Day Demand Plus Fire Flow: Simulation results for the maximum day plus fire flow condition found that fire flow availability ranges from L/s to flows in excess of 200 L/s, with the exception of Hydrant H-48 on Rosina Avenue. This hydrant achieves a fire flow of 97.0 L/s under the temporary JLR October 2010 Revised May 2011 Revised September J.L. Richards & Associates Limited
200 Riverside South Development Corporation Design Report Riverside South Community Phase 9 existing supply condition, compared to 100 L/s as required by the FUS for single family homes. High Pressure Under Average Day Demand: The maximum simulated pressure for the high pressure condition under average day demand is kpa (59.3 psi) at Junction J-53. This result falls below the maximum allowable pressure of 552 kpa (80 psi), as recommended in the City Design Guidelines. 3.5 Summary and Conclusions The proposed water servicing shown on Drawing OS (at back of the Report) was simulated to determine its compliance to regulatory standards. The proposed servicing of Phase 9 consists of a series of 200 mm diameter PVC watermains everywhere in the subdivision, with one (1) 300 mm diameter watermain connection on River Road at Earl Armstrong Road (to extend south along River Road), one (1) 400 mm diameter connection at Earl Armstrong Road and Brian Good Avenue (to extend south along Brian Good Avenue and west along Borbridge Avenue to River Road), and one (1) 300 mm diameter watermain on Spratt Road (to extend south from Earl Armstrong Road). Detailed hydraulic modelling of the Phase 9 Study Area under the 2W/2C feedermain supply condition shows the following: An average day demand of 37.3 L/s was calculated for the Phase 9 Study Area based on water consumption rates from the City of Ottawa Design Guidelines for Water Distribution (July 2010). Similarly, maximum day and peak hourly demands of 82.9 L/s and L/s, respectively, were calculated based on recommended peaking factors from the Guidelines. The simulated pressures during peak hour demands were found to range between to kpa, falling within the required pressure range of 276 to 552 kpa, as recommended in the City Design Guidelines. A comparison of the simulated pressures and the top unit floor elevations for stacked townhouses along Poplin Street indicates that the required minimum pressure of 276 kpa will be achieved for these (and all) units. Furthermore, operating pressures greater than 310 kpa are anticipated everywhere in Phase 9; therefore, 20 mm diameter service connections are proposed for all units. Residential fire flow requirements used in the HNA were based on the FUS Guidelines. Fire flows of 100 L/s, 120 L/s and 135 L/s should ideally be made available for protection of single family, townhouse and stacked townhouse units, JLR October 2010 Revised May 2011 Revised September J.L. Richards & Associates Limited
201 Riverside South Development Corporation Design Report Riverside South Community Phase 9 respectively, while a minimum of 150 L/s should be available for the protection of commercial/institutional developments. Simulation results for the maximum day plus fire flow conditions found that fire flow availabilities will range from L/s to flows in excess of 200 L/s. The above simulation results are adequate in meeting the FUS requirements for fire protection. The maximum simulated pressure for the high pressure condition under average day demand is kpa, which falls below the maximum allowable pressure of 552 kpa, as recommended in the City Design Guidelines. Based on the above summary results, it is recommended that water servicing shown on Drawing OS (at back of the Report) be implemented to provide potable water for domestic and fire flow usages for the RSDC Phase 9 development. 4.0 WASTEWATER SERVICING There have not been any significant changes to the proposed wastewater servicing for Phase 9 since the second submission. As recommended by the City (letter dated July 4, 2011), the section of sanitary sewer between MH 21 and MH 2 on Poplin Street has been upsized from a 200 mm to a 300 mm diameter pipe to provide more capacity for the future development of high density residential and commercial blocks in the northeast quadrant of Phase 9. Sanitary servicing details have been coordinated with the Consultant (IBI Group) for the Claridge Summerhill Village development. The Phase 9 Sanitary Sewer Design Sheet and Drainage have been updated to reflect the latest Phase 9 and Summerhill Village designs. The revised sanitary servicing design details are summarized in Figure Wastewater Outlets There are two (2) main outlet locations that have been identified for the conveyance of sanitary wastewater generated by the Phase 9 lands. The first sanitary connection, referred to hereafter as Outlet 1, is an existing 525 mm diameter sanitary sewer stub, located on the south side of the Earl Armstrong Road Park and Ride Facility, which runs north and then west to the existing River Road trunk sanitary sewer. The second connection point, referred to as Outlet 2, is an existing 525 mm diameter sanitary sewer stub on Spratt Road just south of Earl Armstrong Road, which was designed by AECOM as part of the Earl Armstrong Road Reconstruction project. The existing and proposed sanitary sewer layout is shown in Figure 4.1. JLR October 2010 Revised May 2011 Revised September J.L. Richards & Associates Limited
202 6.08ha 176ppl 3.58ha 176ppl 66.24ha 3036ppl 3.94ha 167ppl 6.00ha 246ppl 1.20ha COM ha 5575ppl 4.18ha 206ppl 0.85ha 50ppl 1.00ha INST 1.20ha COM 0.71ha 50ppl 3.46ha INST 86.46ha 3944ppl 7.63ha INST 1.70ha 226ppl 2.21ha 141ppl 3.02ha COM 8.92ha 370ppl ha 4758ppl 8.47ha INST 17.16ha INST EARL ARMSTRONG ROAD SPRATT ROAD CLARIDGE SUMMERHILL VILLAGE PROJECT: DRAWING: DESIGN: G.D. DRAWING NO.: RIVER ROAD This drawing is copyright protected and may not be reproduced or used for purposes other than execution of the described work without the express written consent of J.L. Richards & Associates Limited..L. Richards Existing Sanitary Sewer Proposed Sanitary Sewer Summerhill Village Proposed Sanitary Sewer by Claridge Homes Future Phase 9 RIVERSIDE SOUTH PHASE 9 CITY OF OTTAWA SANITARY SERVICING PLAN DRAWN: CHECKED: T.B. J.L.P. PLOTTED: Aug30,2011 FIGURE 4.1 JLR NO:
203 Riverside South Development Corporation Design Report Riverside South Community Phase Design Criteria Key parameters used in the design are summarized in Table 4.1, while the minimum sanitary sewer slopes are listed in Table 4.2. Sanitary sewers in the RSDC Phase 9 development were designed in accordance with the Stantec RSCISSU (particularly for population and flow generation, and subcatchment boundaries) and with the City of Ottawa Sewer Design Guidelines (November 2004). Table 4.1: Wastewater Servicing Design Criteria Design Criteria Design Value City Reference Minimum velocity 0.6 m/s Section Maximum velocity 3.0 m/s Section Manning roughness coefficient Section (for all smooth wall pipes) Residential average flow 350 L/cap/day Section Commercial/institutional average flow 50,000 L/gross ha/d Section Industrial average flow 35,000 L/gross ha/d Section Residential peaking factor Harmon Formula Section Commercial/institutional peaking factor 1.5 Section Industrial peaking factor Varies (by area) Section 4.4.1, Appendix B Infiltration flow 0.28 L/s/effective gross ha Section Minimum allowable slopes Varies (see Table 4.2 below) Table 6.2, Section Table 4.2: Minimum Sanitary Sewer Slopes Nominal Diameter Minimum Slope 200 mm 0.320% 250 mm 0.240% 300 mm 0.186% 375 mm 0.140% 450 mm 0.111% Over 525 mm 0.100% JLR October 2010 Revised May 2011 Revised September J.L. Richards & Associates Limited
204 Riverside South Development Corporation Design Report Riverside South Community Phase Proposed Sanitary Sewer Drainage Boundary and Flow Deviations As noted in Section 1.4, a sanitary drainage boundary deviation from the RSCISSU was identified. Specifically, it was determined that a net area of ha and 591 people should be moved from sanitary drainage area 2d to area 2b, as summarized in Table 4.3 and Table 4.4 below, and depicted in Figure 4.2. This area was originally assigned to the 525 mm diameter sanitary trunk sewer on Borbridge Avenue (Collector I ) that flows east to Spratt Road and north to Outlet 2 at Earl Armstrong Road. The obvert of this trunk sewer at the intersection of Brian Good Avenue and Borbridge Avenue is approximately m. Connecting a local 200 mm diameter sewer at this point and constructing the sewer at a minimum slope of 0.32% to MH 132 at the intersection of Ardmore Street and Earnscliffe Grove (approximate distance of 320 m) results in an obvert of approximately m, compared to a proposed grade of m at this location (difference of 1.22 m). Thus, a local sewer constructed at this elevation would not achieve the required depth for frost protection, nor would it be capable of accommodating residential services. Additionally, in coordination with IBI Group, the existing residential areas fronting on River Road (between Summerhill Street and Borbridge Avenue) have been incorporated into the design, as shown in Figure 4.2. These areas, totalling 6.71 ha and 381 people, are now included on the sanitary drainage plans and design sheets (refer to Appendix E ). It appears that these areas were omitted from the RSCISSU sanitary drainage areas, and it is our understanding that the matter is being considered by the City s Consultant. The following Tables summarize the proposed deviations to the RSCISSU sanitary drainage areas and flows. JLR October 2010 Revised May 2011 Revised September J.L. Richards & Associates Limited
205 PROPOSED SUB-DRAINAGE AREA LIMIT MSS SUB-DRAINAGE AREA LIMIT AREA MOVED BETWEEN SUB-DRAINAGE AREAS FROM OUTLET 2 TO OUTLET 1 AREA MOVED BETWEEN SUB-DRAINAGE AREAS TO SAME OUTLET AREA OMITTED FROM MSS, NOW INCLUDED IN SUB-DRAINAGE AREA This drawing is copyright protected and may not be reproduced or used for purposes other than execution of the described work without the express written consent of J.L. Richards & Associates Limited..L. Richards PROJECT: RIVERSIDE SOUTH PHASE 9 CITY OF OTTAWA DRAWING: SANITARY DRAINAGE PLAN DESIGN: G.D. DRAWN: K.T.K. CHECKED: J.L.P. PLOTTED: Oct05,2011 DRAWING NO.: FIGURE 4.2 JLR NO:
206 Riverside South Development Corporation Design Report Riverside South Community Phase 9 Table 4.3: Sanitary Drainage Area Deviations to Park & Ride Outlet Land Use Stantec Area (ha) Revised Area (ha) Difference (ha) Stantec Area 2a Residential (1) Commercial Institutional Park/Road TOTAL: Stantec Area 2b Residential (2) Commercial Institutional (3) Park/Road (4) TOTAL: (5) Stantec Areas 2a-2b TOTAL: (5) (6) Notes: Refer to Figure 4.2 for illustration of sanitary drainage area boundary deviations from Stantec RSCISSU. (1) Area moved from Stantec area 2a to 2b based on updated road pattern south of Borbridge Avenue. (2) Total of RSDC Phase 9, Claridge Summerhill Village, future residential lands west of River Road, and existing residential lands fronting on River Road (including 6.71 ha omitted from RSCISSU). (3) Future school located on Summerhill Street at Brian Good Avenue. (4) Total of Park & Ride and Earl Armstrong Road. (5) Stantec area 2b does not appear to include residential lands fronting on River Road (totalling 6.71 ha). (6) Area deviation includes ha moved from Stantec area 2a to 2b, and ha added for existing and future residential lands fronting on River Road that were omitted from RSCISSU. JLR October 2010 Revised May 2011 Revised September J.L. Richards & Associates Limited
207 Riverside South Development Corporation Design Report Riverside South Community Phase 9 Table 4.4: Sanitary Drainage Area Deviations to Spratt Road Outlet Stantec Area ID Stantec Area (ha) Revised Area (ha) Difference (ha) 2c d (1) 2e-3a (2) TOTAL: Notes: Refer to Figure 4.2 for illustration of sanitary drainage area boundary deviations from Stantec RSCISSU. (1) ha moved from Stantec area 2d to 2b due to drainage area boundary revisions in the southeastern portion of RSDC Phase 9, less 2.82 ha (per Note 2), i.e., =7.71 ha. (2) 2.82 ha added to Area 2d from 2e for Chipping Avenue area along Spratt Road at Borbridge Avenue. Stantec Area ID Table 4.5: Sanitary Sewer Flow Deviations Stantec Total Flow (L/s) Revised Total Flow (L/s) Difference (L/s) Park & Ride Outlet 2a (to node 107) (1) 2b (to node 106) (2) Spratt Road Outlet 2c (to node 113) d (to node 112) (3) 2e-3a (to node 111) (3) Notes: Refer to Figure 4.2 for illustration of sanitary drainage area boundary deviations from Stantec RSCISSU. (1) Area of 7.75 ha moved from 2a to 2b based on updated road pattern south of Borbridge Avenue. (2) Deviation includes ha (+591 ppl) moved from area 2a to 2b, and ha (+381 ppl) added for existing and future residential lands fronting on River Road that were omitted from RSCISSU. (3) Area of ha moved from 2d to 2b due to drainage area boundary revisions in the southeastern portion of RSDC Phase 9. Therefore, it is proposed that ha and 591 people be moved from sanitary drainage area 2d to area 2b. Additionally, it is proposed that the existing residential areas fronting on River Road, totalling 6.71 ha and 381 people, be included in sanitary drainage area 2b, where these areas were apparently omitted from the original sanitary drainage area tabulation in the RSCISSU. JLR October 2010 Revised May 2011 Revised September J.L. Richards & Associates Limited
208 Riverside South Development Corporation Design Report Riverside South Community Phase 9 The total proposed flow to the sanitary sewer outlet at the Park and Ride Facility is L/s, which is 18 L/s greater than the RSCISSU flow, which can be attributed to the additional drainage area (i.e., ha) and population (i.e., people), as noted above. Conversely, the proposed flow at the Spratt Road sanitary sewer outlet is 130 L/s, which is 8 L/s less than the RSCISSU. The pipe capacity for the Park and Ride outlet is L/s (refer to Stantec Sanitary Sewer Design Sheet in Appendix E ), therefore there is adequate capacity to convey the proposed flow. However, the proposed drainage area and flow deviations, coupled with the omitted sanitary drainage area in the RSCISSU, have brought into question the adequate capacity of the existing sanitary trunk sewer along River Road. It is our understanding that the City s Consultant has been engaged to review the situation and to provide recommendations. 4.4 Temporary Flow Restriction Phase 9 has two (2) outlet locations for servicing the sanitary sewer system. Due to the limitations of construction phasing and scheduling, there is the potential for additional flow, greater than the allocated amount, to outlet into the downstream sanitary sewer system. Temporary inlet control devices (ICDs) shall be installed at both sanitary sewer outlet locations (refer to Figure 4.1) to temporarily restrict flows until all elements of the sanitary system have been constructed and are operable. The temporary sanitary sewer ICDs were sized using the peak design flows at the outlet locations (refer to Appendix E for Sanitary Sewer Design Sheets). The calculated peak flows at Outlet 1 and Outlet 2 are L/s and 20.3 L/s, respectively. To ensure allowable flow rates are not exceeded, ICDs have been sized using the orifice equation and assuming a head from the centre of the orifice to the top of grate elevation. A summary of the allowable release rates and ICD characteristics is provided in Table 4.6 below (refer to Appendix E for detailed orifice sizing calculations). Table 4.6: Temporary Wastewater Inlet Control Devices Allowable Flow (L/s) Head (m) Outlet Pipe Dia. (mm) ICD Dia. (mm) Outlet 1 at SAN MH (1) Outlet 2 at SAN MH (2) (3) Notes: (1) RSCISSU design flow at node 107c (refer to Appendix E for Stantec Sanitary Sewer Design Sheet). (2) Calculated design flow in SAN MH 21 (refer to Appendix E for Phase 9 Design Sheet). (3) For given head condition, 75 mm dia. orifice produces a flow of 23.9 L/s, which is greater than the allowable flow. However, City Guidelines specify that 75 mm is the minimum allowable orifice size. JLR October 2010 Revised May 2011 Revised December J.L. Richards & Associates Limited
209 Riverside South Development Corporation Design Report Riverside South Community Phase Summary and Conclusions Based on the above proposed drainage boundary deviations, and Sanitary Sewer Design Sheet and Drainage Plans (refer to Appendix E ), it is recommended that sanitary servicing shown on Drawing OS (at back of the Report) be implemented to provide sanitary servicing for the RSDC Phase 9 development. 5.0 STORM SERVICING AND STORMWATER MANAGEMENT There have not been any significant changes to the proposed storm servicing and stormwater management systems for Phase 9 since the second submission. Revisions to the minor storm system are limited to some interconnections of catch basins to eliminate conflicts with other services (e.g., utilities). As well, the design of the 1350 mm diameter storm trunk sewer on River Road has now been included, whereas previously it was labelled as future and a detailed design was not provided. A description of the River Road trunk sewer drainage area has been added in a new Section There is also an additional storm drainage area deviation along River Road in the Summerhill Village development area, which has been incorporated into Section The Storm Sewer Design Sheet and Drainage Plans have been updated to reflect the latest Phase 9 and Summerhill Village designs. It should be noted that there have been no changes to the proposed major stormwater system since the second submission. 5.1 Background This Design Report addresses minor and major storm drainage systems for the RSDC Phase 9 development draining to the existing Stormwater Management Facility Pond No. 1, herein referred to as Pond 1. Integrated into the proposed RSDC Phase 9 storm sewer network is the proposed Claridge Homes Summerhill Village development. This development bisects the RSDC Phase 9 land into a northern and a southern portion; the southern portion relies on the construction of storm sewer trunks on Summerhill Street in Summerhill Village by Claridge Homes, while the northern portion can mostly be accommodated by the existing storm sewer system. Figure 5.1 depicts the proposed and existing storm sewer systems. It should be noted that storm servicing for the southeast portion and a small southwest portion of Phase 9 requires the construction of Pond 5. Since the schedule for the construction and commissioning of Pond 5 is projected beyond the timeline of the current construction schedule of the RSDC Phase 9 development, servicing for these JLR October 2010 Revised May 2011 Revised September J.L. Richards & Associates Limited
210 EARL ARMSTRONG ROAD OUTLET 2 FUT. P&R OUTLET ha 0.82 RTC 88.16ha 0.53 RIVER ROAD 32.39ha ha 0.67 CLARIDGE SUMMERHILL VILLAGE 1.19ha ha 0.80 SPRATT ROAD 4.40ha ha ha ha 0.50 This drawing is copyright protected and may not be reproduced or used for purposes other than execution of the described work without the express written consent of J.L. Richards & Associates Limited..L. Richards PROJECT: Proposed Storm Sewer Proposed Storm Sewer Summerhill Village by Claridge Homes RIVERSIDE SOUTH PHASE 9 CITY OF OTTAWA DRAWING: STORM SERVICING PLAN Proposed Storm Sewer by Others Existing Storm Sewer DESIGN: DRAWN: G.D. K.T.K. CHECKED: J.L.P. PLOTTED: Sep29,2011 DRAWING NO.: FIGURE 5.1 JLR NO: Future Phase
211 Riverside South Development Corporation Design Report Riverside South Community Phase 9 portions of Phase 9, identified as Future Phase 9, will be constructed at a later date, coincident with the construction of Pond 5. This Report includes the analysis of Phase 9 lands only and does not take into consideration the Future Phase 9 development, with the exception of the proposed trunk sewers on Borbridge Avenue and River Road that are tributary to the future Pond 5. These storm sewers are to be constructed, as stipulated in the Subdivision Draft Conditions, and capped at the 2400 mm diameter stub flowing west at the intersection of River Road and Borbridge Avenue. This Report provides a hydraulic grade line (HGL) analysis for the RSDC Phase 9 development to ensure the protection against basement flooding in the event of a 1:100 year storm. This analysis was conducted based on the City-approved HGL elevations at Pond 1 and along trunk sewers, as determined in the RSCISSU and subsequent revisions (refer to Appendix B for copy of Stantec letter-type report, dated May 4, 2010). Furthermore, since the first submission of this Report, the City has requested that the July 1, 1979 historical storm be analysed in terms of HGL elevations and major overland flows. The requested analyses have been incorporated into Sections and Storm Sewer Outlets Stormwater Management Facility Pond No. 1 Runoff generated by Phase 9 will discharge to Pond 1 via a storm sewer system. This facility was designed and constructed in the early 1990s to provide erosion control, along with water quality and quantity control for its tributary area. Therefore, no further requirements in terms of storm runoff quality and quantity control are expected for the subject lands tributary to Pond 1, with the exception of temporary flow restriction measures to be installed at the Phase 9 minor system outlets (two locations) for the duration of the construction period (refer to Section ). Currently, a 2100 mm diameter storm sewer is in place and previously capped on River Road east of Earl Armstrong Road. A copy of Plan and Profile Drawing No. 36 showing the existing 2100 mm diameter sewer has been included in Appendix F. Based on a review of the Storm Sewer Design Sheet developed as part of the September 2008 RSCISSU (refer to Appendix F ), the area proposed to be serviced by the 2100 mm diameter storm sewer along River Road was estimated at ha (including 2.90 ha for a future transportation corridor and 4.80 ha for the Earl Armstrong Road Arterial Road ). JLR October 2010 Revised May 2011 Revised September J.L. Richards & Associates Limited
212 Riverside South Development Corporation Design Report Riverside South Community Phase 9 In accordance with the RSCISSU and the June 12, 2009 Transit Corridor letter-type report by Stantec, the existing 2100 mm diameter storm trunk sewer has been extended from River Road, east along Earl Armstrong Road, to service the Phase 9 lands. The 2100 mm diameter storm sewer extends approximately 210 m east on Earl Armstrong Road, as far as the Park and Ride Facility, and then approximately 97 m south to the Rapid Transit Corridor (RTC), where it transitions to a 1700x2650 mm elliptical storm sewer. This existing elliptical storm sewer stub, hereafter referred to as storm Outlet 1, is to be extended further south into Phase 9 to service the low lying areas along River Road. Further, a 1650 mm diameter storm sewer has been extended approximately 365 m east along Earl Armstrong Road from the Park and Ride to Brian Good Avenue, with a 1500 mm diameter stub, referred to herein as storm Outlet 2, extending south on Brian Good Avenue to service the northeast portion of Phase 9 between the RTC and Earl Armstrong Road. It is our understanding that this alignment (east on Earl Armstrong then south to service Phase 9 lands) will allow for a future below grade RTC crossing at River Road. Prior to planning for the RTC project, the alignment of the 2100 mm diameter storm trunk sewer extension from River Road at Earl Armstrong Road was directly south along River Road Stormwater Management Facility Pond No. 5 Since the second submission, the design of the storm trunk sewer flowing south on River Road has been included in the Phase 9 design, as specified in the RSCISSU. It is noted that the construction of that trunk sewer (and approximately 330 m of storm trunk sewer flowing west on Borbridge Avenue to River Road) is not required for the servicing of the current Phase 9 and Summerhill Village developments, as these sewers are tributary to Pond 5, which has not yet been constructed. However, construction of sanitary sewers, storm sewers and watermains on River Road (and Borbridge Avenue) are required as part of the Draft Conditions for both Subdivisions. The River Road storm trunk sewer conveys runoff from subcatchment areas 5-1, 5-1A, 5-2 and 5-2A, as specified in the RSCISSU. These lands include River Road and some existing fronting properties, and the future RSDC Phase 12 lands to the west of River Road (south of Earl Armstrong Road). There are existing 825 mm diameter and 1350 mm diameter storm sewers on River Road, extending approximately 200 m south of Earl Armstrong Road, that were designed by AECOM as part of the Earl Armstrong Road Reconstruction project. The RSCISSU specifies that the 1350 mm diameter sewer is to be extended south on River Road to Borbridge Avenue at the southwestern limit of RSDC Phase 9. The design of the proposed 1350 mm diameter trunk sewer has been JLR October 2010 Revised May 2011 Revised September J.L. Richards & Associates Limited
213 Riverside South Development Corporation Design Report Riverside South Community Phase 9 coordinated with IBI Group for the Claridge Summerhill Village development. The proposed trunk sewers on River Road and Borbridge Avenue are to be capped at the 2400 mm diameter outlet pipe stub flowing west at the intersection of River Road and Borbridge Avenue. 5.3 Design Criteria The design criteria and parameters presented in the following Sections were used to complete the detailed storm servicing design for the Riverside South Phase 9 development General The general stormwater servicing design parameters are listed in Table 5.1 below: Table 5.1: Stormwater Servicing Design Criteria General Design Criteria Runoff from rear yards conveyed to rear lot swales Runoff from front yards conveyed to roadways Runoff coefficients per RSCISSU, summarized in Table 5.2 Minimum rear and side yard swale grades at 1.5% Maximum rear yard ponding depth of approx m for 1:100 year storm event Minimum freeboard of 0.30 m between the front terrace elevation and the maximum street ponding elevation Minimum roadway profile grades at 0.5% Maximum ponding depth in roadside sags of 0.30 m Minimum freeboard of 0.30 m between the rear terrace elevation and the maximum rear yard ponding elevation All roadway catch basins restricted to 20.0 L/s with the use of inlet control devices (ICDs) Some street catch basins interconnected in series of two (2) with a 20.0 L/s ICD installed in the downstream catch basin lead All rear yard catch basins restricted to 13.4 L/s with the use of a custom ICD Some rear yard catch basins interconnected in series of two (2) with a 13.4 L/s ICD installed in the downstream catch basin lead Minimum of 0.3 m clearance between the underside of footing and the 1:100 year HGL elevation JLR October 2010 Revised May 2011 Revised September J.L. Richards & Associates Limited
214 Riverside South Development Corporation Design Report Riverside South Community Phase 9 Minimum roadway slope of 0.1% from crest to crest for overland flow route Storm sewers sized for the 1:5 year storm event using the Rational Method and City of Ottawa Intensity-Duration-Frequency (IDF) curves Minimum storage volume of 50 m 3 /ha located strategically along the roadway within the subdivision. Storage volume implemented in the rear yards is not to be included in the overall tabulation of storage volume. Maximum allowable minor system inlet capture rates per RSCISSU, summarized in Table Runoff Coefficients and Minor System Capture Rate The SWMHYMO Parameter Summary in the September 2008 RSCISSU (included in Appendix F ) lists specific parameters used in the computer simulation of the storm sewersheds that are tributary to the outlet at River Road (i.e., the 2100 mm diameter storm sewer). A review of the flow generation parameters indicates that weighted average runoff coefficients ranging between 0.39 and 0.51 were used in the hydrological analysis. As described in Section of the RSCISSU (Storm Sewer Criteria), these weighted average runoff coefficients are based on the land use runoff coefficient values summarized in Table 5.2 below. Additionally, the minor system inlet capture rates are summarized in Table 5.3 for the subcatchment areas in the vicinity of the Phase 9 lands. Table 5.2: Storm Runoff Coefficients Land Use Description Runoff Coefficient, C Residential - Low Density 0.40 Residential - Medium Density 0.50 Residential - High Density 0.60 Core Area 0.80 Commercial Area 0.80 Employment Lands 0.70 Schools 0.40 Institutional (other than school) 0.60 Collector Road/Transitway ROW 0.67 Parkland/Open Space/Hydro/Pipeline Corridor 0.20 JLR October 2010 Revised May 2011 Revised September J.L. Richards & Associates Limited
215 Riverside South Development Corporation Design Report Riverside South Community Phase 9 Subcatchment Area ID Table 5.3: Allowable Inlet Capture Rates Inlet Capture Rate Subcatchment Area ID Inlet Capture Rate L/s/ha L/s/ha L/s/ha 5-1A 221 L/s/ha L/s/ha L/s/ha L/s/ha 5-2A 179 L/s/ha 1-6T 151 L/s/ha L/s/ha L/s/ha L/s/ha Major System The RSCISSU provides specific design guidelines with regard to on-site storage requirements (refer to Appendix F ). On this basis, the provision of 50 m 3 /ha of road sag storage is required for all subcatchment areas (i.e., subcatchment areas 1-1 to 1-6, inclusive) that are tributary to the noted outlets in order to meet the RSCISSU requirements. A discussion of major overland flow for RSDC Phase 9 and Claridge Homes Summerhill Village lands is provided in Section 5.5, with detailed calculations included in Appendix F. 5.4 Proposed Storm Sewer System Water Quality and Quantity Storm runoff generated by the Phase 9 lands is to be conveyed to the outlets listed in Section 5.2. Since these outlets are tributary to the Mosquito Creek watershed, fish habitat protection and water quantity storage is mandatory. To meet the above requirements, runoff from Phase 9 will be conveyed to Pond 1 for stormwater quality and quantity control. Temporary flow attenuation will be provided at the minor system outlets for the duration of the construction period (refer to Section ); however, no additional water quality measures have been included in the servicing of Phase Minor System Phase 9 was designed using the dual drainage system. The minor drainage system is comprised mainly of street gutters, inlet catch basins, junction chambers and storm sewers. This system is designed to capture and convey runoff during frequent storm JLR October 2010 Revised May 2011 Revised September J.L. Richards & Associates Limited
216 Riverside South Development Corporation Design Report Riverside South Community Phase 9 events with return periods up to 1:5 year for local and collector roads, and 1:10 year for arterial roads and Transitway, per the RSCISSU. The major drainage system is formed by swales/ditches, streets, open channels and stormwater management facilities and will accommodate runoff during storms ranging from a 1:5 year up to a 1:100 year event. Storm sewers included in the Phase 9 development were sized based on peak flows calculated using the Rational Method. An inlet time of 10 minutes for road corridors and 15 minutes for rear yard catch basins and pre-established runoff coefficients based on land use were used for this Subdivision. A time of concentration was calculated (based on inlet times noted), and rainfall intensities were calculated based on the IDF relationships listed in the City of Ottawa Sewer Design Guidelines. The Storm Sewer Design Sheet and Drainage Plans are included in Appendix F Proposed Storm Sewer Subcatchment Area and Flow Deviations As noted in Section 1.4, a minor variance in the stormwater subcatchment areas from the RSCISSU is requested to accommodate the design of the minor system. In the second submission, it was requested to redirect a net area of 1.69 ha from subcatchment areas draining to Pond 5 such that it drains instead to Pond 1. This deviation in the storm drainage boundaries was requested to allow the storm sewers on Rosina Avenue to flow in the same direction as the sanitary sewers and to prevent crossing issues. Since that time, the Consultant for the Claridge Summerhill Village development has revised their storm sewer drainage area to include an additional 0.61 ha along River Road (future provisional residential area, as requested by the City) that was previously allotted to drainage area 5-2 flowing south to future Pond 5, but is now included in area 1-1 flowing north to Pond 1 through Phase 9 lands via the Park and Ride Facility outlet. Thus, the new total drainage area deviation from Pond 5 to Pond 1 is 2.30 ha (i.e., ), as illustrated in Figure 5.2 and summarized in the Tables below. JLR October 2010 Revised May 2011 Revised September J.L. Richards & Associates Limited
217 PROPOSED MAJOR DRAINAGE AREA LIMIT PROPOSED SUB-DRAINAGE AREA LIMIT MSS SUB-DRAINAGE AREA LIMIT MSS MAJOR DRAINAGE AREA LIMIT POND 5 AREA MOVED TO POND 1 MAJOR DRAINAGE AREA AREA MOVED BETWEEN SUB-DRAINAGE AREAS WITHIN SAME MAJOR DRAINAGE AREA This drawing is copyright protected and may not be reproduced or used for purposes other than execution of the described work without the express written consent of J.L. Richards & Associates Limited..L. Richards PROJECT: RIVERSIDE SOUTH PHASE 9 CITY OF OTTAWA DRAWING: STORM DRAINAGE PLAN DESIGN: OTHER DRAWN: T.B. CHECKED: J.L.P. PLOTTED: Oct05,2011 DRAWING NO.: FIGURE 5.2 JLR NO:
218 Riverside South Development Corporation Design Report Riverside South Community Phase 9 Table 5.4: Storm Drainage Area Deviations to Pond 5 Stantec Area ID Stantec Area (ha) Revised Area (ha) Difference (ha) At Stantec Node N5-22, from East (Borbridge Avenue) 5-15 to 5-18 (1) (2) (3) TOTAL: At Stantec Node N5-22, from North (River Road) 5-1, 5-1A (4) 5-2, 5-2A (4,5) TOTAL: (5) At Stantec Node N5-22 TOTAL: (6) Notes: Refer to Figure 5.2 for illustration of storm drainage area boundary deviations from Stantec RSCISSU. (1) Includes Stantec areas 5-15, 5-15B, 5-16, 5-17 and 5-18, less 2.21 ha moved from area 5-16 to area 5-20 at the intersection of Borbridge Avenue and Spratt Road. (2) Total of 0.78 ha added to area 5-19 from areas 1-1 & 1-4 due to drainage boundary revisions along Borbridge Avenue in the southwestern portion of RSDC Phase 9. (3) Total of 1.83 ha moved from area 5-20 to 1-4 due drainage area boundary revisions in the southeastern portion of RSDC Phase 9. Additionally, 2.21 ha added to area 5-20 from area 5-16 (per Note 1). (4) Revised drainage area boundary between areas 5-1 and 5-2 (west of River Road, and north of Summerhill Street to Earl Armstrong Road) based on most recent plan of subdivision for RSDC Phase 12 residential development. (5) Total of 1.25 ha moved from area 5-2 to 1-1 along east side of River Road (north of Borbridge Avenue to Summerhill Street) due to drainage area boundary revisions in Claridge Summerhill Village development. (6) Total of 2.30 ha moved from Pond 5 to Pond 1 due to drainage area boundary revisions for RSDC Phase 9 and Claridge Homes Summerhill Village. JLR October 2010 Revised May 2011 Revised September J.L. Richards & Associates Limited
219 Riverside South Development Corporation Design Report Riverside South Community Phase 9 Table 5.5: Storm Drainage Area Deviations to Pond 1 Stantec Area ID Stantec Area (ha) Revised Area (ha) Difference (ha) At Stantec Node N1-8, at Park & Ride and Earl Armstrong Road 1-1, 1-3, (1) (2) Park & Ride (3) TOTAL: At Stantec Node N1-7, at Brian Good Avenue and Earl Armstrong Road 1-6T (2) (4) (5) Park & Ride (3) TOTAL: Total of Stantec Nodes N1-8 and N1-7 TOTAL: (6) Notes: Refer to Figure 5.2 for illustration of storm drainage area boundary deviations from Stantec RSCISSU. (1) Total of Stantec areas listed as ha in RSCISSU, but measured in CAD as ha. (2) Total of 2.30 ha moved from Pond 5 to Pond 1 (refer to Table 5.4), less 1.00 ha moved from areas 1-3 & 1-4 on south side of RTC easement to area 1-6T. (3) Park & Ride (P&R) was assigned 4.62 ha to Node N1-5c in Stantec letter regarding Storm Sewer Realignment at Park and Ride (dated May 4, 2010). Based on current AECOM design for P&R, 2.09 ha for future P&R was assigned to storm sewer on Brian Good Avenue, flowing to Node N1-7. It was assumed that =2.53 ha for existing P&R is assigned to Node N1-8. (4) Stantec area 1-6 listed as 9.68 ha in RSCISSU, but measured in CAD as 9.90 ha. (5) 0.34 ha moved from area 1-15 to area 1-6 due to drainage boundary revisions along Spratt Road. (6) Total of 2.30 ha moved from Pond 5 to Pond 1, and 0.34 ha added from area 1-15, i.e., =2.64 ha, due to drainage area boundary revisions for RSDC Phase 9 and Claridge Summerhill Vilage developments. JLR October 2010 Revised May 2011 Revised September J.L. Richards & Associates Limited
220 Riverside South Development Corporation Design Report Riverside South Community Phase 9 Table 5.6: Storm Sewer Flow Deviations Stantec Stantec Area ID Inlet Capture Flow (L/s) (1) To Pond 1 Park & Ride Outlet at Node N1-5a Revised Inlet Capture Flow (L/s) (2) Proposed Total ICD Flow (L/s) (3) 1-1, 1-3, 1-4 3, , ,064.6 To Pond 1 Brian Good Avenue Outlet at Node N , 1-6T, Park & Ride 1, , ,537.9 (4) To Pond 5 Borbridge Avenue Outlet at Node N to , , ,431.9 (5) To Pond 5 River Road Outlet at Node N , 5-1A, 5-2, 5-2A 1, , ,410.1 Notes: (1) Based on RSCISSU subcatchment areas and allowable inlet capture rates (refer to Table 5.3). (2) Based on area deviations (refer to Table 5.4 and Table 5.5) and RSCISSU capture rates. (3) Based on proposed total inlet control device (ICD) flow rates (refer to Storm Sewer Design Sheet in Appendix F ). (4) Revised inlet capture flow is greater than Stantec flow due to the addition of 1.00 ha from the south side of the RTC, and 2.09 ha from the Park and Ride. The adequate capacity of the downstream 1650 mm sewer was confirmed, per the RSCISSU Storm Sewer Design Sheet. (5) ICD flow based on RSCISSU capture rates for external areas 5-15 to 5-21 and proposed ICD flows on Borbridge Avenue in Phase 9. The actual ICD flows for external areas shall be designed to meet the allowable inlet capture flow when the detailed design of those areas is undertaken. Therefore, it is proposed that a total area of 2.30 ha be moved from Pond 5 to Pond 1, including 1.05 ha in the southeast portion of the Phase 9 lands, and 1.25 ha along the east side of River Road (refer to Figure 5.2). There are also some proposed subcatchment area deviations within the same major drainage area (i.e., to same pond but different outlets), such as 1.00 ha on the south side of the Rapid Transit Corridor, and 2.09 ha from the Park and Ride Facility. All of these area deviations contribute to different flows to the storm sewer outlets than what was determined in the RSCISSU. The allowable inlet capture flows were re-calculated based on the revised subcatchment areas (including deviations) and the allowable inlet capture rates from the RSCISSU. The proposed total ICD flows to each of the minor system outlets are summarized in Table 5.6. There is adequate capacity in the existing storm sewer outlets to convey the proposed flow. JLR October 2010 Revised May 2011 Revised September J.L. Richards & Associates Limited
221 Riverside South Development Corporation Design Report Riverside South Community Phase Inlet Control Devices General Use Storm servicing for Phase 9 incorporates the use of inlet control devices (ICDs) in both street and rear yard catch basins, which allows captured flows to be controlled to the conveyance capacity of the storm sewers, thus minimizing the risk of unacceptable surcharges. The use of ICDs provides a level of protection against basement flooding during storm events exceeding a 1:5 year recurrence. The ICD capacities were taken into account in the preparation of hydraulic grade line (HGL) calculations for the 1:100 year storm event presented in Section It is proposed that the minor system flows generated by Phase 9 lands be controlled with the following flow restrictors: Ipex Type A ICDs having a release rate of 20.0 L/s in designated roadway catch basins, or an equivalent installation approved by the City; and Custom-made ICDs having a release rate of 13.4 L/s. The proposed ICDs are indicated on the Site Servicing and Storm Drainage Plans. Note on Rational Method vs Inlet Capture Rate Method To date, storm servicing and stormwater management for Phase 9 have been developed based on recommendations from the approved RSCISSU and City Sewer Design Guidelines. Engineering calculations have been provided based on the prescribed runoff coefficients, inlet times, allowable ICD inlet capture rates, and on-site storage volume requirements. It has been demonstrated that the proposed servicing is in compliance with the recommendations of the above noted documents. However, a comment was received from the City noting that the inlet capture rates used in the Phase 9 design do not meet the 1:5 year level of service. During a meeting, the City recommended that inlet capture rates be increased from the RSCISSU values in order to achieve a 1:5 year capture. At that time, JLR informed the City that due to strict site constraints there is very little tolerance to increase the capture rates, as the resulting increase to the hydraulic grade line (HGL) could jeopardize meeting the minimum 0.30 m freeboard requirement, per the City Guidelines. The City directed JLR to proceed using the current RSCISSU capture rates, while the City s Consultant is retained to re-evaluate the allowable capture rates and their potential impact on the HGL in the storm sewer system. Accordingly, the current Phase 9 design achieves the inlet capture rate requirements prescribed in the RSCISSU. JLR October 2010 Revised May 2011 Revised September J.L. Richards & Associates Limited
222 Riverside South Development Corporation Design Report Riverside South Community Phase Temporary Flow Restriction Due to the limitations of construction phasing and scheduling, it is impossible to implement all of the designed flow restrictors (i.e., ICDs) instantaneously to provide the necessary flow attenuation to meet the allowable RSCISSU release rate. Temporary ICDs are proposed at the two (2) storm sewer outlet locations (refer to Figure 5.1) to temporarily restrict flow until all elements of the minor system have been implemented. The temporary storm sewer ICDs were sized using the allowable inlet capture flow from the RSCISSU (based on inlet capture rates in Table 5.3), modified to incorporate the proposed Phase 9 drainage area deviations (refer to Section 5.4.3). The temporary storm sewer ICD characteristics are provided in Table 5.7 (refer to Appendix F for detailed orifice sizing calculations). Table 5.7: Temporary Stormwater Inlet Control Devices Allowable Flow (L/s) (1) Head (m) Outlet Pipe Dia. (mm) ICD Dia. (mm) Outlet 1 at ST MH 543 3, Outlet 2 at ST MH 102 1, Notes: (1) RSCISSU allowable minor system inlet capture flow (based on inlet capture rates in Table 5.3), modified for proposed Phase 9 drainage area deviations (refer to Section 5.4.3) Hydraulic Grade Line General To minimize the risk of basement flooding in Phase 9, the use of ICDs is proposed in street and rear yard catch basins to control the rate of captured flow transmitted to the sewer system during infrequent storm events. To verify that the proposed basement elevations (i.e., underside of footings) are set to an acceptable elevation, an HGL analysis was conducted. The HGL elevations provided at the outlet locations have been extracted from the RSCISSU and subsequent revisions provided in the Stantec letter-type report, dated May 4, 2010 regarding Storm Sewer Realignment at Park and Ride (a copy of which has been provided in Appendix B ). A summary of HGL elevations from the Stantec reports used in the RSDC Phase 9 HGL calculations is provided in Table 5.8 for convenience. JLR October 2010 Revised May 2011 Revised December J.L. Richards & Associates Limited
223 Riverside South Development Corporation Design Report Riverside South Community Phase 9 Stantec Node ID Table 5.8: Stantec 1:100 Year HGL Elevations Corresponding Phase 9 MH 2008 RSCISSU HGL Elevation (m) May 4, 2010 Update HGL Elevation (m) N1-5a EX. STUB (P&R) N1-7 EX. 102 (AECOM) EX. BOX EX. 1 (Stantec) , (1) Notes: (1) HGL at Brian Good/Borbridge Avenue intersection was interpolated from HGL at nodes 5-19 & 5-20 at a distance of approximately 303 m upstream of node 5-19 (total distance of 885 m between nodes), i.e., (303/885)*( )=87.99 m. A spreadsheet was developed to estimate the HGL elevations throughout the sewer system for all maintenance hole junctions within the Phase 9 Study Area (refer to Appendix F for HGL elevation calculations). HGL elevations were estimated using one of the following approaches: the Darcy-Weisbach relationship for calculating friction losses (i.e., major losses) along the sewer system, when surcharged conditions are encountered; or the upstream and downstream obverts, when captured flows are below the free-flowing capacity of the pipe under non-surcharged conditions HGL Analysis The following is an overview of the methodology used to carry out the HGL analysis: the HGL analysis was conducted using the proposed storm sewer system presented in Figure 5.1 and tabulated in the Storm Sewer Design Sheets (refer to Appendix F ); inflow hydrographs were based on a release rate of 20.0 L/s established for an Ipex Type A (or City approved equivalent) for areas draining to street catch basins and 13.4 L/s for rear yard areas; inflow hydrographs were generated based on the 1:100 year IDF curve equations, as presented in Section of the Ottawa Sewer Guidelines JLR October 2010 Revised May 2011 Revised September J.L. Richards & Associates Limited
224 Riverside South Development Corporation Design Report Riverside South Community Phase 9 (November 20204); furthermore, as a means of verification and in accordance with Section of the Design Guidelines, an assessment was also made for the July 1, 1979 historical storm (refer to Section for discussion); interconnected catch basins (with an ICD installed in the downstream catch basin lead) were set to transmit peak runoff rates of 20.0 L/s and 13.4 L/s for street and rear yard catch basins, respectively; friction losses along the sewer system were calculated, when applicable, using the Darcy-Weisbach relationship: H l = f (L/D) (v 2 /2g) where: H l Head loss (m) due to friction f Darcy-Weisbach friction factor L Length (m) of sewer pipe D Diameter (m) of sewer v Velocity (m/s) of flow g Constant for acceleration due to gravity (i.e., m/s 2 ); minor losses at each maintenance hole junction were calculated, when applicable (i.e., for submerged conditions), and included in the total losses. The following minor losses have been considered when captured flows are greater than the free-flowing capacity of the pipes: o o o straight-through losses; expansion losses; and bend losses, using Figure of the Municipal Works Design Manual. The HGL elevations estimated using the above methodology were then compared with the basement underside of footings. To provide additional protection against basement flooding, a minimum freeboard of 0.30 m was set between the 1:100 year HGL elevation and the basement underside of footing HGL Results HGL elevations along the sewer system were calculated (refer to Appendix F ) following the methodology presented in Section In general, for the 1:100 year storm event, the calculated freeboard between the HGL and the basement underside of JLR October 2010 Revised May 2011 Revised September J.L. Richards & Associates Limited
225 Riverside South Development Corporation Design Report Riverside South Community Phase 9 footings (USF) elevations exceeds 0.50 m or more. However, there are some instances where the freeboard was found to range between 0.30 to 0.50 m, as summarized in Table 5.9 below. The calculated HGL elevations and freeboards have been revised in some locations since the second submission, in efforts to meet the RSCISSU inlet capture rates and in coordination with IBI Group for the Claridge Summerhill Village development. Based on these HGL calculations, the required minimum freeboard of 0.30 m is achieved for all underside of footings within Phase 9. It should be noted that, as an additional precautionary measure, and as per City of Ottawa Guidelines, all basement weeping tiles in the Phase 9 Subdivision will be equipped with a backwater valve along their service connection to the storm sewer. Table 5.9: HGL and USF Elevations for Basement Protection From MH To MH Street Name 600A 610 Southbridge Street Borbridge Avenue Rosina Avenue 1:100 Yr HGL Elevation (m) USF Elevation (m) Calculated Freeboard (m) HGL Results Under July 1, 1979 Historical Storm As a means of verification, the impact of the July 1, 1979 storm event on the minor storm sewer system was assessed. As shown on the HGL spreadsheet (refer to Appendix F ), the cumulative transmitted ICD flows under a 1:100 year storm event are substantially lower than the 1:100 year peak flow calculated with the Rational Method, as the ICDs are found to limit the flows beyond the 1:5 year recurrence. To ascertain the performance of the storm sewer system under the July 1, 1979 storm event, Figure 5.3 of the Ottawa Sewer Design Guidelines was used, as it provides a synthesis of statistical analyses for storm events ranging from 1:2 to 1:100 year recurrence. Rainfall intensities for the July 1, 1979 historical storm event are also shown on the Figure, based on the recorded intensities provided in Table 5.6 of the Guidelines. Figure 5.3 from the Guidelines has been reproduced below for illustration purposes. JLR October 2010 Revised May 2011 Revised September J.L. Richards & Associates Limited
 Based on these statistics, governing rainfall intensities are dictated by the 1:100 year")
, T c ranges from 15 minutes to a maximum of 42.3 minutes for the Phase 9 Study Area.")
226 Riverside South Development Corporation Design Report Riverside South Community Phase 9 Figure 5.3: Historical Storms vs IDF Curves (Reproduced from City of Ottawa Sewer Design Guidelines, November 2004) Based on these statistics, governing rainfall intensities are dictated by the 1:100 year storm event for times of concentration (T c ) ranging from 5 to 50 minutes. For T c exceeding 50 minutes (as shown on the above Figure), the July 1, 1979 storm intensities govern. Based on the tabulated times of concentration shown in the Storm Sewer Design Sheet (refer to Appendix F ), T c ranges from 15 minutes to a maximum of 42.3 minutes for the Phase 9 Study Area. Consequently, the 1:100 year storm intensities govern, and HGL elevations calculated for the 1:100 year storm event (as shown in Appendix F ) are more conservative than those that would be calculated for the July 1, 1979 storm event. No further assessment was, therefore, carried out under the July 1, 1979 historical storm, other than the major overland flow analysis described in Section 5.5. JLR October 2010 Revised May 2011 Revised September J.L. Richards & Associates Limited