ATTACHMENT 6 WATER QUALITY SWALE DESIGN ADDENDUM
|
|
|
- Laura Holmes
- 5 years ago
- Views:
Transcription
1 ATTACHMENT 6 WATER QUALITY SWALE DESIGN ADDENDUM
2 12 October 2010 Project No Mr. Robert R. Monok Project Manager Energy Fuels Resource Corporation 44 Union Boulevard, Suite 600 Lakewood, Colorado RE: DESIGN ADDENDUM TO KLEINFELDER CONCEPTUAL DESIGN FOR THE WATER QUALITY SWALE, PIÑON RIDGE PROJECT, MONTROSE COUNTY, COLORADO Dear Bob: 1.0 INTRODUCTION Golder Associates Inc. (Golder) has prepared this letter addendum to provide additional design information for the Water Quality Swale (WQS) and its associated stilling basin proposed for construction at the Piñon Ridge Project in Montrose County, Colorado. The conceptual design for the WQS was originally provided by Kleinfelder (Kleinfelder, 2009). This document is intended to supplement that design by specifying the design components of this swale and stilling basin as requested by the Colorado Department of Public Health and Environment (CDPHE) as part of the Request for Additional Information (RFI) #3 received on August 19, Maintenance recommendations are also provided. 2.0 WATER QUALITY SWALE Water quality swales are vegetated channels that are commonly used as a permanent stormwater Best Management Practice (BMP). When built according to specified design criteria, these channels improve the water quality of flows exiting the swale primarily by promoting settling of suspended solids. These swales also have an ancillary benefit of providing some removal of trace metals and other particulates (USEPA, 1999). 2.1 Design Criteria The U.S. Environmental Protection Agency (USEPA) provides general guidance for the design and functionality of water quality swales. For more specific design guidance, the USEPA refers engineers and designers to Design of Stormwater Filtering Systems, published by the Center for Watershed Protection. (CWP, 1996). Table 1 is provided to summarize the specific design criteria for water quality swales. I:\07\81694\0100\0110 LTR\WaterQualitySwale\ LTR ConceptDesignAddendum 12OCT10.docx Golder Associates Inc. 44 Union Boulevard, Suite 300 Lakewood, CO USA Tel: (303) Fax: (303) Golder Associates: Operations in Africa, Asia, Australasia, Europe, North America and South America Golder, Golder Associates and the GA globe design are trademarks of Golder Associates Corporation
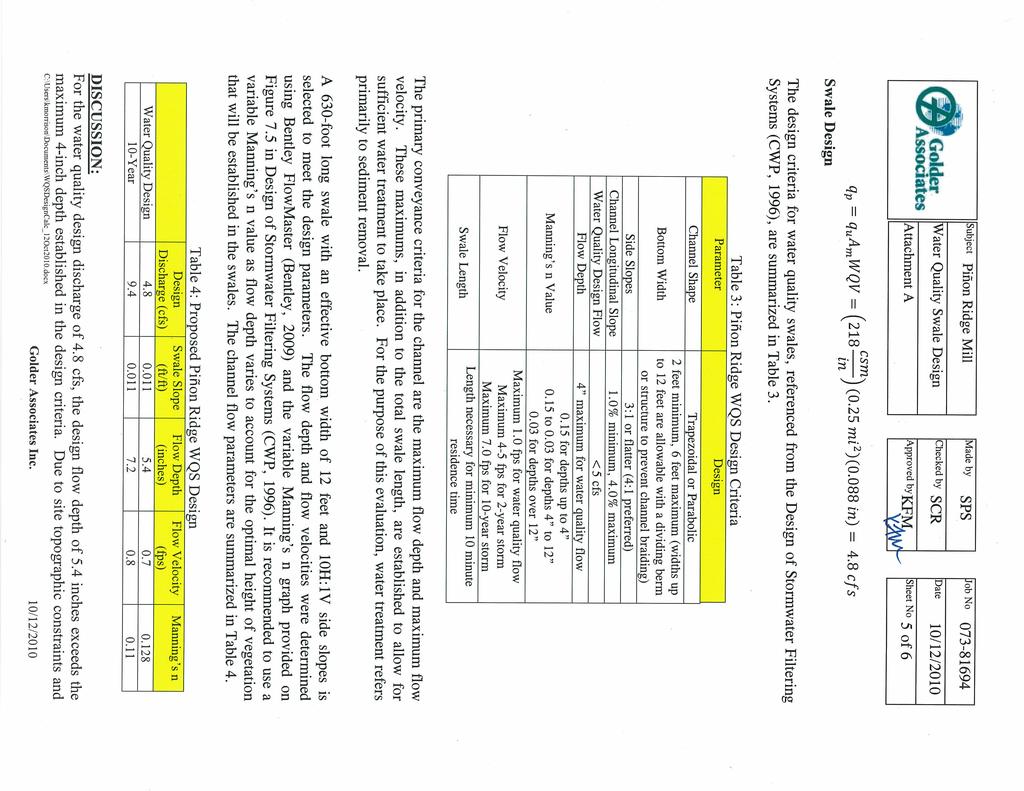
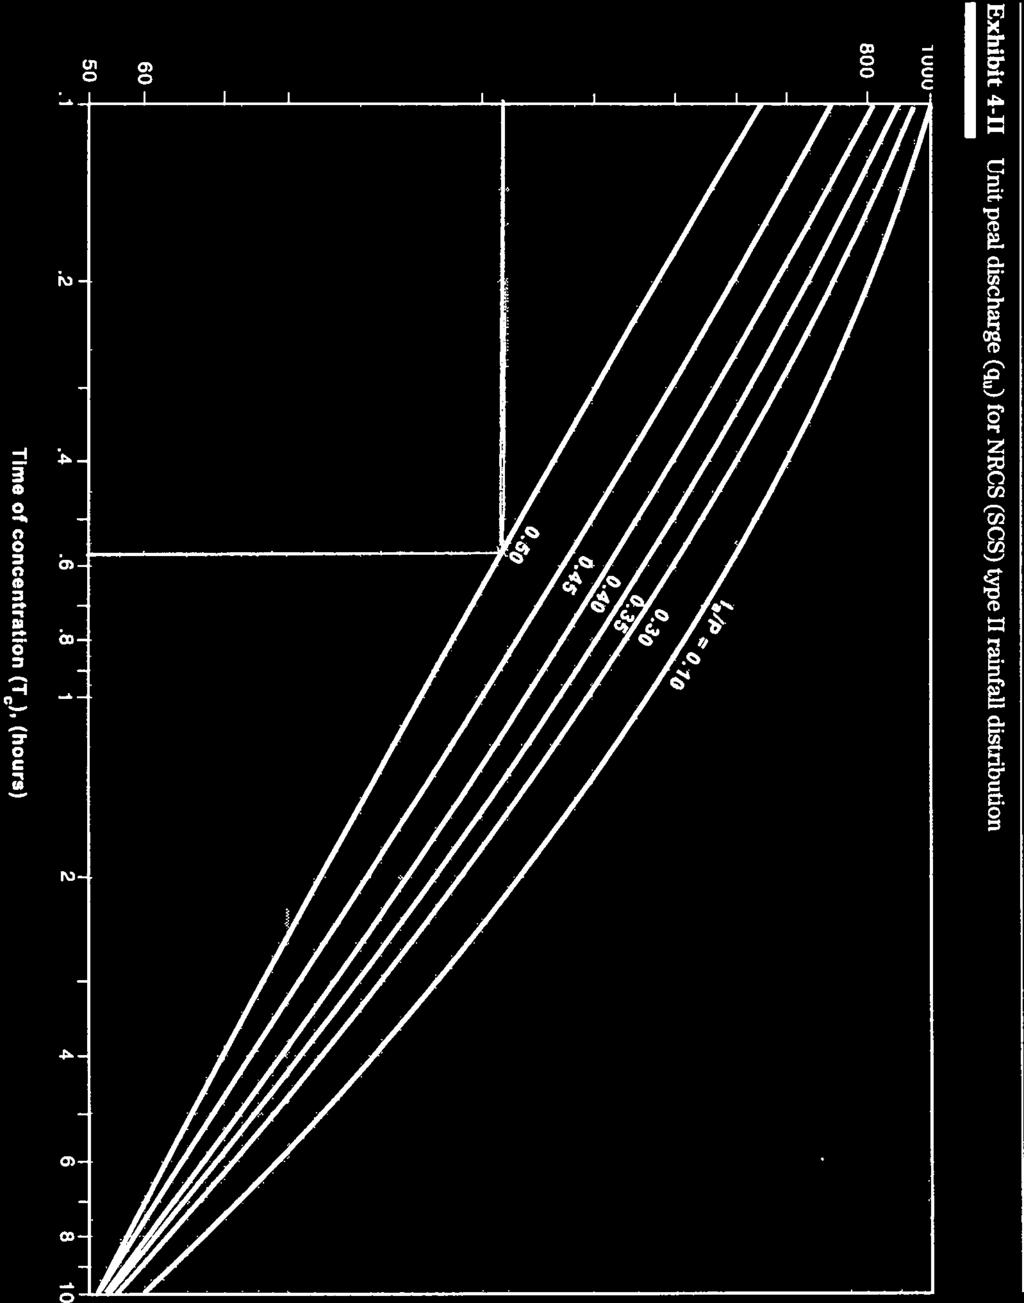
3 Mr. Robert R. Monok 12 October 2010 Energy Fuels Resource Corporation Table 1: Water Quality Swale Design Criteria Parameter Channel Shape Bottom Width Side Slopes Channel Longitudinal Slope Water Quality Design Flow Flow Depth Manning s n Value Flow Velocity Swale Length Minimum Freeboard Stilling Basin/Forebay at Swale Entrance Design Criteria Trapezoidal or Parabolic 2 feet minimum, 6 feet maximum (widths up to 12 feet are allowable with a dividing berm or structure to prevent channel braiding) 3H:1V or flatter (4H:1V preferred) 1.0% minimum, 4.0% maximum <5 cubic feet per second (cfs) 4 inches maximum for water quality flow 0.15 for depths up to 4 inches 0.15 to 0.03 for depths 4 to 12 inches 0.03 for depths over 12 inches Maximum 1.0 foot per second (fps) for water quality flow Maximum 7.0 fps for 10-year storm Length necessary for minimum 10 minute residence time 6 inches above 10-year water surface elevation Volume = 0.05 inches per impervious acre Mild (3H:1V or flatter) side slopes 2.2 Water Quality Swale WQS Design Discharges Based on previous hydrologic analyses (Kleinfelder, 2009), the 100-year, 24-hour discharge entering the WQS is estimated to be 40 cfs. Peak discharges for lower magnitude, more frequent storm events were not determined. Since designing this swale for infrequent, high magnitude peak discharges would diminish the swale s effectiveness in improving water quality, it is recommended to use the 90% Rule in the absence of locally defined design discharge criteria (CWP, 1996). Under this rule, the average 24- hour precipitation event that is expected to occur 90% of the time on an annual basis is to be used to determine the swale s water quality design discharge. This discharge will be used to verify that flow depth, velocity and residence time criteria will be met with the proposed WQS design. For the Piñon Ridge site, this 90% precipitation depth was determined using the recorded observations on precipitation events noted in the Piñon Ridge Surface Water Log Book. Based on this information, a design precipitation depth of 1.0 inches is used. For comparison purposes, a summary of precipitation depths at the Piñon Ridge site for various storm events is provided in Table 2. Table 2: Piñon Ridge Precipitation Precipitation Event 24-Hour Precipitation Depth (inches) 90% Annual Precipitation (Water Quality Design) Year 1.4 (NOAA, 2006) 10-Year 2.0 (NOAA, 2006) 100-Year 3.0 (Kleinfelder, 2009) Using the total drainage area of 0.25 square miles reporting to the WQS and an effective Curve Number (CN) of 67 (Kleinfelder, 2009), the WQS design discharge is estimated at 4.8 cfs. The design criteria also dictate using the 10-year discharge to check maximum flow depths and velocities through the WQS. A 10-year, 24-hour discharge of 9.4 cfs reporting to the WQS is estimated using the SCS method (NRCS, I:\07\81694\0100\0110 LTR\WaterQualitySwale\ LTR ConceptDesignAddendum 12OCT10.docx
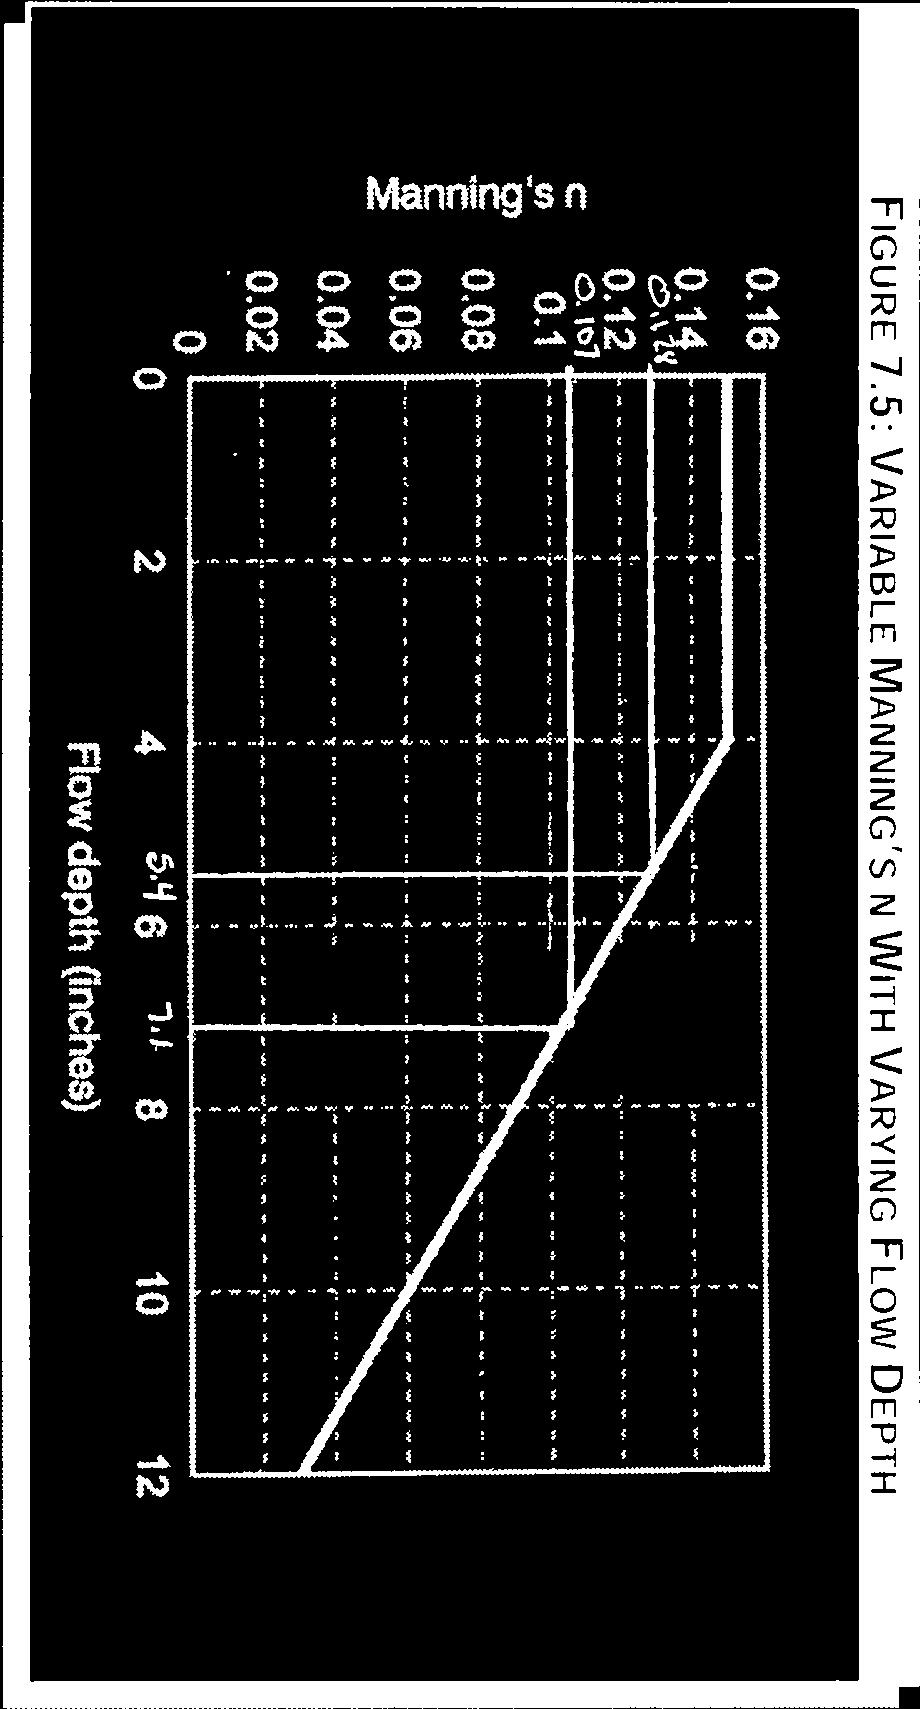
4 Mr. Robert R. Monok 12 October 2010 Energy Fuels Resource Corporation ). Additional information regarding the determination of the WQS design discharge and 10-year discharge is provided as Attachment A to this report. The 0.25 square-mile watershed area and corresponding discharges apply to the Phase 1 operating condition of the mill facility. When the facility expands to the proposed full build-out, additional area within the WQS contributing watershed will become zero-discharge facilities (i.e., evaporation ponds and tailings cells) and will no longer contribute to runoff. Although the ultimate footprint of the mill facility will result in reduced flows being directed to the WQS, the Phase 1 layout is taken to be the prevailing condition for this design WQS Design For this design, the water quality discharge of 4.8 cfs is used to determine the required swale cross section in order to meet flow depth and velocity criteria. The 10-year discharge of 9.4 cfs is used to verify that maximum velocities are not exceeded and to establish the minimum total channel depth necessary. A summary of the WQS design for Piñon Ridge is provided in Table 3. Table 3: Piñon Ridge WQS Design Parameter Channel Shape Bottom Width Side Slopes Design Trapezoidal 16 feet total, with 4-foot dividing berm 10H:1V Channel Longitudinal Slope 1.1% Design Discharge Flow Depth Manning s n Value Flow Velocity Minimum Channel Depth (with 6 inches minimum freeboard) Residence Time 4.8 cfs (water quality) 9.4 cfs (10-year) 5.4 inches (water quality flow) 7.1 inches (10-year) 0.13 (water quality flow) 0.11 (10-year) 0.6 fps (water quality flow) 0.8 fps (10-year) 14 inches 18 minutes (based on 630-foot treatment length and 0.6 fps flow velocity) For this water quality design discharge of 4.8 cfs, the design flow depth of 5.4 inches exceeds the maximum 4-inch design flow depth established in the design criteria. Due to site topographic constraints and tying into an existing downstream culvert, the longitudinal slope cannot be increased as a means of reducing the flow depth. Since the channel configuration utilizes the maximum allowable bottom width, there are limited options available to significantly reduce the flow depth. Since the design meets the maximum flow velocity and minimum swale residence time criteria, it is believed that this design will be sufficient to promote the settling of suspended solids. 2.3 Stilling Basin Design For the WQS to function appropriately, a stilling basin or small forebay at the swale entrance is recommended to provide pre-treatment of incoming flow and enhance filtering into the treatment section of the swale. The primary design element of this basin is that it is sized to provide 0.05 inches of storage volume for each impervious acre reporting to the WQS. Previous hydrologic assessment has indicated I:\07\81694\0100\0110 LTR\WaterQualitySwale\ LTR ConceptDesignAddendum 12OCT10.docx
5 Mr. Robert R. Monok 12 October 2010 Energy Fuels Resource Corporation that approximately 4% of the 0.25-square mile area reporting to the WQS, or 6.8 acres, is impervious (Golder, 2010). Based on this impervious area, the required volume of this stilling basin is approximately 1,235 cubic feet. 2.4 Recommended Vegetation and Maintenance It is recommended that drought-tolerant plant species be specified for the WQS due to this site being located in a semi-arid area. Recommended maintenance procedures are summarized in Table 4. Table 4: Piñon Ridge WQS Maintenance Activity Inspect vegetation along channel side slopes for erosion and formation of rills and gullies and correct Remove trash and accumulated debris in WQS and stilling basin Inspect and correct erosion problems within the channel bed Plant alternative vegetative species if original vegetation does not successfully establish Remove sediment build-up within the swale once it has accumulated to 25% of the original design volume (approximately 3 inches) and revegetate disturbed areas Schedule Annual (semi-annual and after significant rainfall the first 2 years) After 3 years As needed 3.0 CONCLUSIONS A water quality swale is provided for the Piñon Ridge site primarily to prevent excess sediment from exiting the property. The proposed swale has been designed in accordance with USEPA recommended criteria. Although the design exceeds the maximum threshold for flow depth, the design meets or is well below maximum design thresholds for flow velocity and residence time. A stilling basin is provided at the swale entrance to enhance sediment removal. The proposed WQS design is expected to meet water quality objectives related to the removal of suspended solids. Design drawings for the WQS are provided in Attachment B. 4.0 CLOSING We appreciate the opportunity to provide continued engineering services for the Piñon Ridge project. If you have any questions regarding this document, please contact the undersigned at Sincerely, GOLDER ASSOCIATES INC. Sheina P. Sadza Senior Project Engineer Kimberly Finke Morrison, P.E., R.G. Associate - Senior Project Manager Attachments: A Water Quality Swale Design Calculations B Water Quality Swale Design Drawings SPS/KFM/rjg I:\07\81694\0100\0110 LTR\WaterQualitySwale\ LTR ConceptDesignAddendum 12OCT10.docx
6 Mr. Robert R. Monok 12 October 2010 Energy Fuels Resource Corporation REFERENCES Center for Watershed Protection (CWP) Design of Stormwater Filtering Systems. December Golder Associates (Golder) Potential Impacts to the Dolores River from the Piñon Ridge Project, Montrose County, Colorado. May 2010 Kleinfelder (Kleinfelder) Site Drainage Analysis and Design Report, Energy Fuels Resources Corporation, Piñon Ridge Project, Montrose County, Colorado. February National Oceanic and Atmospheric Administration (NOAA) Precipitation Frequency Atlas of the United States, NOAA Atlas 14, Volume 1, Version United States Department of Agriculture Natural Resources Conservation Service (NRCS) Urban Hydrology for Small Watersheds (TR-55), June United States Environmental Protection Agency (USEPA) Stormwater Technology Fact Sheet: Vegetated Swales. September I:\07\81694\0100\0110 LTR\WaterQualitySwale\ LTR ConceptDesignAddendum 12OCT10.docx
7 ATTACHMENT A WATER QUALITY SWALE DESIGN CALCULATIONS
8
9
10
11
12
13
14
15


16

17


18
19 Worksheet for Water Quality Swale (Design) Project Description Friction Method Solve For Manning Formula Normal Depth Input Data Channel Slope ft/ft Discharge 4.80 ft³/s Section Definitions Station (ft) Elevation (ft) Roughness Segment Definitions Start Station Ending Station Roughness Coefficient (0+00, 1.17) (0+38, 1.17) Options Current Roughness Weighted Method Open Channel Weighting Method Closed Channel Weighting Method Pavlovskii's Method Pavlovskii's Method Pavlovskii's Method Results Normal Depth 0.45 ft Elevation Range 0.00 to 1.17 ft Flow Area 8.04 ft² Wetted Perimeter ft Hydraulic Radius 0.34 ft 10/8/2010 4:35:59 PM Bentley Systems, Inc. Haestad Methods Solution Bentley Center FlowMaster V8i (SELECTseries 1) [ ] 27 Siemons Company Drive Suite 200 W Watertown, CT USA Page 1 of 2
20 Worksheet for Water Quality Swale (Design) Results Top Width ft Normal Depth 0.45 ft Critical Depth 0.16 ft Critical Slope ft/ft Velocity 0.60 ft/s Velocity Head 0.01 ft Specific Energy 0.46 ft Froude Number 0.18 Flow Type Subcritical GVF Input Data Downstream Depth 0.00 ft Length 0.00 ft Number Of Steps 0 GVF Output Data Upstream Depth 0.00 ft Profile Description Profile Headloss 0.00 ft Downstream Velocity Infinity ft/s Upstream Velocity Infinity ft/s Normal Depth 0.45 ft Critical Depth 0.16 ft Channel Slope ft/ft Critical Slope ft/ft 10/8/2010 4:35:59 PM Bentley Systems, Inc. Haestad Methods Solution Bentley Center FlowMaster V8i (SELECTseries 1) [ ] 27 Siemons Company Drive Suite 200 W Watertown, CT USA Page 2 of 2
21 Project Description Cross Section for Water Quality Swale (Design) Friction Method Solve For Manning Formula Normal Depth Input Data Channel Slope ft/ft Normal Depth 0.45 ft Discharge 4.80 ft³/s Cross Section Image 10/8/2010 4:37:06 PM Bentley Systems, Inc. Haestad Methods Solution Bentley Center FlowMaster V8i (SELECTseries 1) [ ] 27 Siemons Company Drive Suite 200 W Watertown, CT USA Page 1 of 1
22 Project Description Worksheet for Water Quality Swale (10-Year Q) Friction Method Solve For Manning Formula Normal Depth Input Data Channel Slope ft/ft Discharge 9.40 ft³/s Section Definitions Station (ft) Elevation (ft) Roughness Segment Definitions Start Station Ending Station Roughness Coefficient (0+00, 1.17) (0+38, 1.17) Options Current Roughness Weighted Method Open Channel Weighting Method Closed Channel Weighting Method Pavlovskii's Method Pavlovskii's Method Pavlovskii's Method Results Normal Depth 0.59 ft Elevation Range 0.00 to 1.17 ft Flow Area ft² Wetted Perimeter ft Hydraulic Radius 0.42 ft 10/12/ :04:46 AM Bentley Systems, Inc. Haestad Methods Solution Bentley Center FlowMaster V8i (SELECTseries 1) [ ] 27 Siemons Company Drive Suite 200 W Watertown, CT USA Page 1 of 2
23 Worksheet for Water Quality Swale (10-Year Q) Results Top Width ft Normal Depth 0.59 ft Critical Depth 0.24 ft Critical Slope ft/ft Velocity 0.82 ft/s Velocity Head 0.01 ft Specific Energy 0.60 ft Froude Number 0.22 Flow Type Subcritical GVF Input Data Downstream Depth 0.00 ft Length 0.00 ft Number Of Steps 0 GVF Output Data Upstream Depth 0.00 ft Profile Description Profile Headloss 0.00 ft Downstream Velocity Infinity ft/s Upstream Velocity Infinity ft/s Normal Depth 0.59 ft Critical Depth 0.24 ft Channel Slope ft/ft Critical Slope ft/ft 10/12/ :04:46 AM Bentley Systems, Inc. Haestad Methods Solution Bentley Center FlowMaster V8i (SELECTseries 1) [ ] 27 Siemons Company Drive Suite 200 W Watertown, CT USA Page 2 of 2
 [08.11.01.03] 27 Siemons Company Drive Suite 200 W Watertown, CT 06795 USA +1-203-755-1666 Page 1 of 1")
24 Project Description Cross Section for Water Quality Swale (10-Year Q) Friction Method Solve For Manning Formula Normal Depth Input Data Channel Slope ft/ft Normal Depth 0.59 ft Discharge 9.40 ft³/s Cross Section Image 10/12/ :05:28 AM Bentley Systems, Inc. Haestad Methods Solution Bentley Center FlowMaster V8i (SELECTseries 1) [ ] 27 Siemons Company Drive Suite 200 W Watertown, CT USA Page 1 of 1
25 ATTACHMENT B WATER QUALITY SWALE DESIGN DRAWINGS
26