The National Center for Agricultural Research and Extension
|
|
|
- Percival Malone
- 5 years ago
- Views:
Transcription

 together with the 5th IWA Specialized Conference on Resources-Oriented")
1 The National Center for Agricultural Research and Extension Treatment and Reuse of Wastewater Using Surface and Subsurface Wetlands Dr. Luna Al-Hadidi 13th IWA Specialized Conference on Small Water and Wastewater Systems (SWWS) together with the 5th IWA Specialized Conference on Resources-Oriented Sanitation (ROS) Athens Sept , 2016
2 Background Jordan is a country with limited water resources. The average amount of total available fresh per capita is currently 90 m 3 /yr.
 or Vegetated submerged bed (VSB) constructed wetland.")
3 Types of constructed wetlands 1. Free water surface (FWS) constructed wetland. 2. Subsurface flow (SSF) or Vegetated submerged bed (VSB) constructed wetland.
4 Objectives Evaluate the use constructed wetlands to treat partially treated wastewater and improve the quality of treated wastewater effluent from wastewater treatment facility in Ramtha area, Jordan. Reuse of wetland - treated effluent for the irrigation of selected forage crops. Evaluate the potential uses of subsurface wetland for crop production to increase water use efficiency and reduce fresh water use.
5 Material and Methods Site Description: Field experiments were conducted at the National Center for Agricultural Research and Extension (NCARE) research station at Ramtha in the Northern part of Jordan. The experimental site is located near Ramtha wastewater treatment plant, where irrigation with treated wastewater is highly practiced.


6 Site Construction & Preparation Free Water Surface Wetland Retention basin The free water surface (FWS) wetland was composed of three cells in series of which two are open water surface and one is a channel bed planted with Cyperus alternifolius. Channel basin Third basin The FWS wetland was calibrated to estimate the volume of wastewater needed to fill the wetland. Collection basin
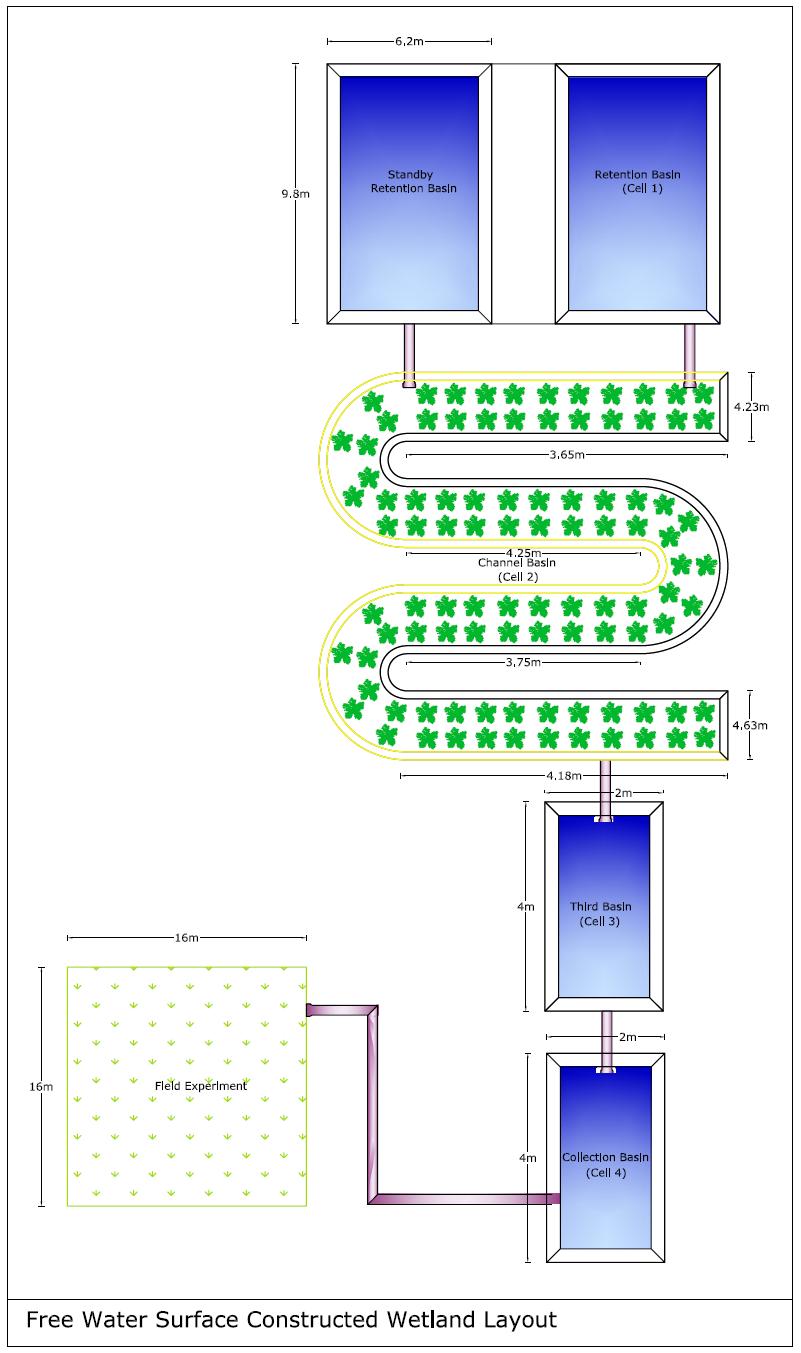
7
8 Sub-Surface Flow Wetland The sub-surface flow (SSF) wetland has a dimension of 2m*4m (W: L) with a 0.85 m media depth. The soil was compacted and lined using a 600 micron polyethylene layer. Four different gravel size layers were used as treatment media in the construction. The diameter of the first, second, third and fourth media layer was ranging from 18-20mm, 10-12mm, 6-8mm and 2-3mm respectively. The SSF wetland was calibrated to estimate the volume and the porosity of the system. Inlet TWW effluent Collection reservoir Gravel bed media 0.85 m Outlet ports

9 1. Surface Wetland Measurements & Treatments Different hydraulic retention times (HRT) were tested. Different flow rates were used within each HRT HRT (days) Flow rate (m 3 /day) Primary treated wastewater effluent was used. Different mixtures were tested. Mixture Treatment Primary treated wastewater Treated wastewater effluent
10 Measurements (Continued ) 2. Subsurface Wetland The use of subsurface wetland was also to evaluate its potential for crop production. According to this, the wetland was planted with barley crop (Hordium vulgare) in the first season and with corn crop (Zea mays L.) in the second season. The treated wastewater effluent was used within this wetland with a HRT of 1 day. Water quality parameters (turbidity, EC, PO 4, TKN and pathogens; fecal coliform and total coliform) were monitored for both wetlands for inflow and outflow on a regular basis.
11 3. Field experiment Measurements (Continued ) The treated effluent out of both wetlands was directed to irrigate a forage crop field run in 4*4 m 2 plots in 4 replicates in a randomized complete block design. The three types of treated effluents that were used: a) treated wastewater from the surface wetland, b) treated wastewater from the sub-surface wetland and c) control treatment with the treated wastewater effluent of Ramtha wastewater plant. At the first season, the field experiment was planted with barley crop (Hordium vulgare). In the second season, the field was planted with corn crop (Zea mays L.). Irrigation scheduling was based on crop water requirements using FAO reference evapotranspiration and crop coefficients. Yield data was collected and standard statistical analysis (ANOVA) was used to evaluate the differences between treatments.
12 Field Experiment Layout R1 R2 R3 R4 SSW SSW TW SW TW SW SW SSW SW TW SSW TW Legend: T1= TW: Treated wastewater effluent T2= SW: Surface wetland effluent T3= SSW: Sub-surface wetland effluent
13 Results & Discussion 1. Free water surface wetland The quality of wastewater and / or HRT in FWS constructed wetland significantly affected the ph, EC, TSS, E.coli, PO 4 and turbidity to greater levels and insignificantly affected the concentrations of BOD 5, COD, TKN, and NO 3.
14 Changes of EC Results showed a significant difference due to mixture and time effect. Mixture 2 showed the lowest salinity change. Obs Mixture Time Estimate Standard Error 1 1 _ AB 2 2 _ A Letter Group 3 3 _ B 4 4 _ AB According to the effect of time, results indicated that salinity change under HRT=3 days was the lowest with significant difference from HRT = 9 and 12 days. Obs Mixture Time Estimate Standard Error 5 _ A 6 _ AB 7 _ B 8 _ B Letter Group
15 Changes of TSS The surface wetland significantly reduced the TSS and results showed a significant effect due to the interaction effect of mixture and time. Obs Mixture Time (Days) Change (%) Standard Error Letter Group ABCD ABCD ABC A BCD A BCD D CD ABCD AB ABCD A A AB A
16 Changes of E.coli The surface wetland significantly reduced the numbers of E.coli and results showed a significant difference due to interaction between mixture and time. Obs Mixture Time (Days) Change (%) Standard Error Letter Group ABC DE ABCD ABC E E ABC BCD AB It is believed that the longer HRT the longer the bacteria are exposed to unfavorable conditions E E AB F ABC AB ABC A CD
17 Changes of Biochemical Oxygen Demand Wetlands tend to be natural exporters of organic C as a result of decomposition of organic matter into fine particulate matter and dissolved compounds. This may explain why the system was sometimes inefficient in achieving high BOD 5 removal Outlet surface Linear (Outlet surface) Outlet BOD y = 0.85x R 2 = Inlet BOD 5
18 Changes of Total Kjeldahl Nitrogen (TKN) Results from the graph indicated that many values are at or above the regression line, indicating that there is a net production of TKN from the anaerobic decomposition of the organic nitrogen. Outlet TKN Outlet Surface Linear (Outlet Surface) y = 0.99x R 2 = Inlet TKN
19 Changes of Phosphorus Phosphorus removal in most constructed wetland systems is not very effective because of the limited contact opportunities between the wastewater and the soil (media). Phosphorus removal in FWS is a result of bacteria removal, plant uptake, adsorption and precipitation. Results showed a significant difference with due respect to time. P removal was the highest under HRT of 12 days due to the longer contact between the effluent and the soil.
20 Phosphorus (Continued ) The relationship of inlet vs. outlet concentration was significant with respect to linear model with high R 2 of Outlet Surface Linear (Outlet Surface) Outlet PO y = 0.87x R 2 = Inlet PO 4
21 Changes of Trace Elements The three main wetland processes that remove heavy metals are binding to soils, sedimentation and particulate matter, precipitation as insoluble salts, and uptake by bacteria, algae and plants. The quality of influent mixture and/or HRT in FWS wetland affected significantly the removal of Fe and Mn and insignificantly affected the removal of Cu and Zn. Cadmium and lead were below the detection limit.
22 0.4 Outlet Surface Linear (Outlet Surface) Results indicated the tendency of the system to remove 30% and 10% of the inlet Fe and Mn, respectively. Outlet Fe Outlet Mn y = 0.70x R 2 = Inlet Fe Outlet Surface 0.40 Linear (Outlet Surface) y = 0.90x 0.15 R 2 = Inlet Mn
23 Changes of Turbidity Turbidity measurement is important as a guide to quality as well as an essential parameter for proper control and operation of treatment plants. Turbidity reduction showed a significant response with respect to mixture, time and interaction of both mixture and time. Significant removal was achieved under mixture 2 and 3 and under hydraulic residence times of 3, 6, and 9 days.
24 Biomass Cuttings for the Macrophyte For effective removal of nutrients from wetland systems and to avoid nutrient recycling when plants die, periodic harvesting from systems with high biomass productivity is not only desirable but a requirement. Biomass cuttings for Cyperus alternifoluis were 84, 221, and 315 kg for the first, second and the third cutting, respectively. Biomass Cutting wt (kg) for Cyperus alternifoluis Grown in FWS Wetland 350 Biomass wt. (Kg) Biomass weight (Kg) July September December Time of the year
25 Hydrology Water Balance & Actual HRT Water balance Some treatments showed a reduction in percentage effluent. This was mainly at the beginning of the research due to losses and technical errors or limitation within the system with regards to flow meters failure and clogging of the outlet system. Others showed high increase in percentage effluent which may be attributed to overloading of the system. Treatment % Effluent from influent 100% TWW, HRT = % TWW, HRT = % TWW, HRT = % TWW, HRT = % TWW, 25% P, HRT = % TWW, 25% P, HRT = % TWW, 25% P, HRT = % TWW, 25% P, HRT = % TWW, 50% P, HRT = % TWW, 50% P, HRT = % TWW, 50% P, HRT = % TWW, 50% P, HRT = % TWW, 75% P, HRT = % TWW, 75% P, HRT = % TWW, 75% P, HRT = % TWW, 75% P, HRT =
26 Actual HRT New HRTs were recalculated based on average flow rate: Q av ( Qinlet outlet Q 2 ) Evapotranspiration and seepage from the FWS wetland has the effects of increasing HRT and increasing constituent concentrations. When actual HRT were found less than the theoretical HRT, this may be attributed to either short circuiting effects or overloading of the wetland. Consequently, this lowers the removal efficiency of the system. Relationship between theoritical and actual HRT for the different mixtures for surface wetland Theoritical HRT Actual HRT HRT (day) M1 M1 M1 M1 M2 M2 M2 M2 M3 M3 M3 M3 M4 M4 M4 M4 Mixture
27 Suitability of Wastewater for Irrigation Field Experiment Barley season: results indicated a significant response with due to treatment effect. Treatment 3 (sub-surface wetland effluent) had resulted in the highest biological and straw yield and with a significant difference from T1 and T2. Obs TRT Biological yield (Ton/du) Standard Error Letter Group B B A Obs TRT Straw yield (Ton/du) Standard Error Letter Group B No significant difference was found between the three treatments with respect to seed yield B A
28 Suitability of Wastewater for Irrigation (continued ) Corn season: ANOVA analysis was carried out for the data of biological yield. Treatments 2 and 3 (FWS and SSF wetland effluents) resulted in the highest biological yield and with a significant difference from T1 (TWW effluent). Obs TRT Biological Yield (Ton/du) Standard Error Letter Group B A A
29 Sub-surface Wetland Processes The SSF wetland affects the concentration of ph, EC, TSS, NO 3, E.coli, PO 4, turbidity, Fe, Cu, Zn and Mn to greater levels.
30 Potential Uses of Subsurface Wetland for Crop Production Results for the first season indicated the possibility of using the SSF wetlands for the production of specific fodder crops. Biological yield (ton/du) for barley planted in SSF wetland in Comparison with Field Treatments 0.6 Biological yield Yield (ton/du) SSF Wetland T1 T2 T3 Treatment
31 During the second season, corn crop did not perform well within the SSF wetland. Visual observation indicated that corn crop was affected by the salinity of the wastewater as the plants were stunted with small leaves and with little coverage inside the SSF bed. Biological yield (ton/du) for corn grown in SSF Wetland in Comparison with Field Treatments 4 Yield (ton/du) Yield (ton/du) Subsurface wetland T1 T2 T3

32 Thank you