Linking the Coastal Salinity Index with Freshwater Inflows to Characterize Salinity Variability in Gulf of Mexico Estuaries
|
|
|
- Ellen Butler
- 5 years ago
- Views:
Transcription

1 Linking the Coastal Salinity Index with Freshwater Inflows to Characterize Salinity Variability in Gulf of Mexico Estuaries Christopher Swarzenski, Kirk Rodgers, Lower Mississippi Gulf Water Science Center Matt Petkewich, South Atlantic WSC United State Geological Survey National Conference on Ecosystem Restoration August 26-3 New Orleans
2 COASTAL SALINITY INDEX: a measure of the departure from long-term average salinity conditions (PAUL CONRADS, SAWSC) - Is salinity fresher or saltier than long-term averages - Specific to the measurement location - An analog to Drought Indices (eg Palmer Hydrological Drought Index) Precipitation Precipitations LA6 Precipitation 1/1/1999 1/1/2 1/1/21 1/1/22 1/1/23 1/1/24 1/1/25 1/1/26 1/1/27 1/1/28 1/1/29 1/1/21 1/1/211 1/1/212 1/1/213 1/1/214 1/1/215 1/1/216 1/1/217 1/1/218 Precipitations 6 4 LA PHDI Palmer Hydrological Drought Index 1/1/1999 1/1/2 1/1/21 1/1/22 1/1/23 1/1/24 1/1/25 1/1/26 1/1/27 1/1/28 1/1/29 1/1/21 1/1/211 1/1/212 1/1/213 1/1/214 1/1/215 1/1/216 1/1/217 1/1/218 X Data
 some are sessile (plants, oysters) New Orleans MISSISSIPPI")
3 ESTUARINE SALINITY GRADIENT: Mixing of freshwater inflows with marine waters creates an area (estuary) of variable salinity that is very productive biologically - Living resources are distributed in estuaries based on their salinity tolerance - Some are mobile (fish) some are sessile (plants, oysters) New Orleans MISSISSIPPI DELTA PLAIN

4
5 Distribution of major marsh types along the estuarine salinity gradient (based on salt tolerance of plant communities) MarshType Salinity (ppt) Mississippi River NEW ORLEANS Fresh < 1 Intermediate.5 4 MARSH TYPE FRESH INTERMEDIATE Bayou Lafourche N Brackish 4-15 Salt 11-3 BRACKISH SALT SWAMP FOREST GULF OF MEXICO BARATARIA BASIN


6 FRESH AND INTERMEDIATE MARSHES: HIGH DIVERSITY > 5 spp LARGE CONTIGUOS EXPANSES WITH CLEAR ZONATION BASED ON SHARP SALINITY GRADIENTS

7 SALT MARSH LANDSCAPE: MONOTYPIC (1-3 species), BISECTED BY NUMEROUS TIDAL CREEKS, LARGE SALINITY VARIABILITY
8 SALINITY VARIABILITY IN ESTUARIES - Freshwater inflows (streamflow, precipitation) - Storm surge (hurricanes, frontal passages) - Seasonal and annual variations in mean sea level Unique spatial and temporal salinity patterns result from interactions among these factors
9 BARATARIA BASIN West of river BRETON SOUND East of river Intermediate Marsh Lake Salvador (24) Reggio Canal (28) Jan Apr Jul Oct Jan Apr Jul Oct Salt Marsh Barataria Pass (27) Jan Apr Jul Oct NE Bay Gardene (3) Jan Apr Jul Oct Prolonged Drought (2) Long-term average Peak River flood (28)
10 Monthly mean salinity ( ) at upper and lower parts of an estuary SPECIFIC CONDUCTANCE SALINITY IN PARTS PER THOUSAND /1/98 1/1/ /1/98 1/1/99 1/1/ 1/1/1 drought 1/1/2 1/1/3 hurricanes 1/1/4 1/1/5 1/1/6 1/1/7 1/1/8 1/1/9 1/1/1 1/1/11 1/1/12 1/1/13 Fig. Monthly average salinity at BA1-2, /1/ 1/1/1 1/1/2 1/1/3 1/1/4 1/1/5 1/1/6 1/1/7 1/1/8 1/1/9 1/1/1 1/1/11 1/1/12 1/1/13
11 Monthly ( ) and daily salinity in upper reaches of Barataria Basin PER THOUSAND SALINITY IN PARTS PER THOUSAND SALINITY IN PARTS 1/1/ /1/99 1/1/ 1/1/1 1/1/2 1/1/3 1/1/4 1/1/5 1/1/6 1/1/7 1/1/8 1/1/9 1/1/1 1/1/11 1/1/12 1/1/13 Fig. Monthly average salinity at BA1-2, July 1999-July 21 July 25-July 27 Monthly salinity Daily salinity
12 SALINITY VARIABILITY IN ESTUARIES - Freshwater inflows (streamflow, precipitation) - Storm surge (hurricanes, frontal passages) - Seasonal and annual variations in mean sea level CLIMATE EVENTS IN COASTAL LOUISIANA Prolonged droughts (1999/2 and 26) - Hurricanes Katrina and Rita (25), Gustave and Ike (28) - Mississippi River record floods (28 and 211) - Extreme precipitation (216)

13 ESTUARINE SALINITY GRADIENT Breton Sound Barataria Transect
 Intermediate Brackish")
14 BARATARIA BASIN CSI (monthly ) Intermediate Brackish Salt
 Intermediate")
15 Breton Sound CSI (monthly ) Intermediate Brackish Salt


16 INTERMEDIATE MARSH Barataria Basin (with contributing catchement) Precipitations 6 4 LA6 PHDI /1/1999 1/1/2 1/1/21 1/1/22 1/1/23 1/1/24 1/1/25 1/1/26 1/1/27 1/1/28 1/1/29 1/1/21 1/1/211 1/1/212 1/1/213 1/1/214 1/1/215 1/1/216 1/1/217 1/1/218 X Data Breton Sound (without contributing catchment)

17 INTERMEDIATE MARSH Barataria Basin 1 month 12 month 24 month


18 SALT MARSH Barataria Basin 1 month 12 month 24 month


19 LINKING CSI TO SPECIFIC ECOLOGICAL CONSEQUENCES IS DIFFICULT AND MAYBE NOT NEEDED 2 drought resulted in a shift in plant community at one intermediate marsh but not three other similar marsh types in the vicinity 1997 P.hemitomon 22 S. falcata Fresh marsh


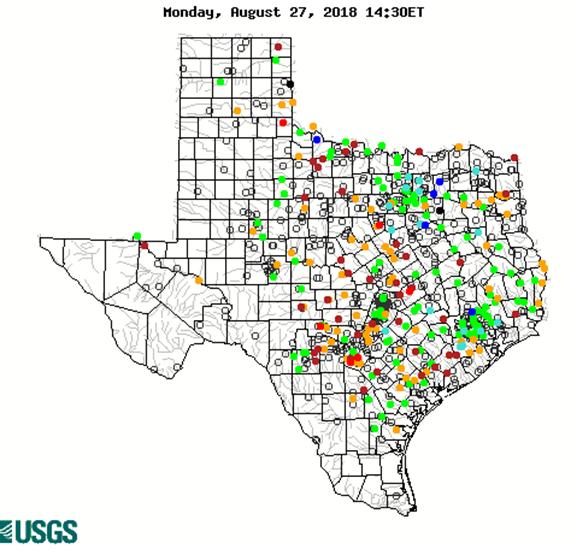
20 Daily stream flow conditions across the nation - Color co-ordinated based on at least 3 years of continuous streamflow - For CSI maybe monthly is a better choice?

21
22 COASTAL SALINITY INDEX - Extremely useful to quickly assess how far from normal salinities are at a particular location - Valuable for understanding both too much and too little freshwater input; in estuaries this is different than drought in farmlands - Sensitive to local hydrology and basin characteristics within an estuary, showing different responses near the freshwater and saltwater ends to same event, for example - Getting continuous records of salinity along estuaries and coasts has only gained traction in the last 25 years or so. Getting good records without too frequent interruptions is challenging