Energy Scenarios for the Baltic Sea Region
|
|
|
- Conrad George
- 5 years ago
- Views:
Transcription


1 Energy Scenarios for the Baltic Sea Region Towards 50% oil reduction 50% CO2 emissions reduction in 2030 Copenhagen, 20 October 2008 Anders Kofoed-Wiuff Ea Energy Analyses Ea Energianalyse
2 Contents of presentation Characteristics of the Baltic Sea Region Two scenarios for the Baltic Sea Region in 2030 towards 50% oil reduction 50% CO2 emissions reduction Opportunities for cooperation some concrete ideas Ea Energianalyse
3 CHARACTERISTICS OF THE BALTIC SEA REGION Ea Energianalyse

4 *including Germany, excl. Russisa Ea Energianalyse
5 New dem. Old dem. *including Germany, excl. Russisa Ea Energianalyse

6 CO2-emissions (Gt) *including Germany, excl. Russisa Ea Energianalyse

7 Infrastructure Ea Energianalyse


8 GAS OIL Hydro Hydro Nuclear Bio Nuclear Bio Hydro Oilshale Gas Coal Hydro Nuclear Coal Gas Wind Hydro, Gas Nuclear GAS OIL Coal Nuclear Wind Coal
9 PJ/year Oil and gas production Oil Natural gas Oil production Norway Natural gas Norway * Russia not included Ea Energianalyse
10 Gross energy consumption PJ Norway Denmark Sweden Finland Estonia Latvia Lithuania Poland Germany Russia Ea Energianalyse
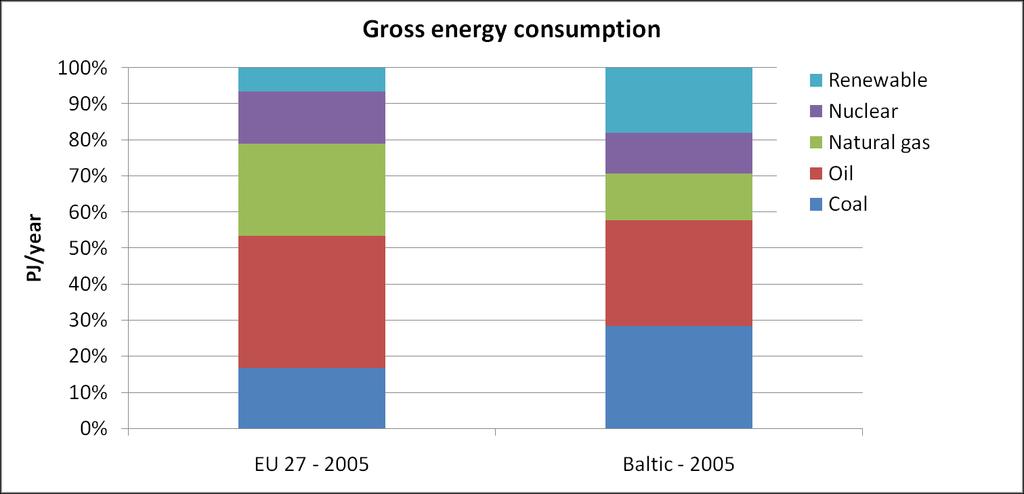
11 PJ/year Gross energy consumption EU Baltic Renewable Nuclear Natural gas Oil Coal Ea Energianalyse
12 Ea Energianalyse
13 Electricity generation by source Baltic countries EU 27 Hydro 25% Wind 4% Coal 29% Hydro 12% Wind 3% Coal 22% Oil 2% Oil 4% Natural Gas 11% Nuclear 35% Natural Gas 24% Nuclear 29% Ea Energianalyse

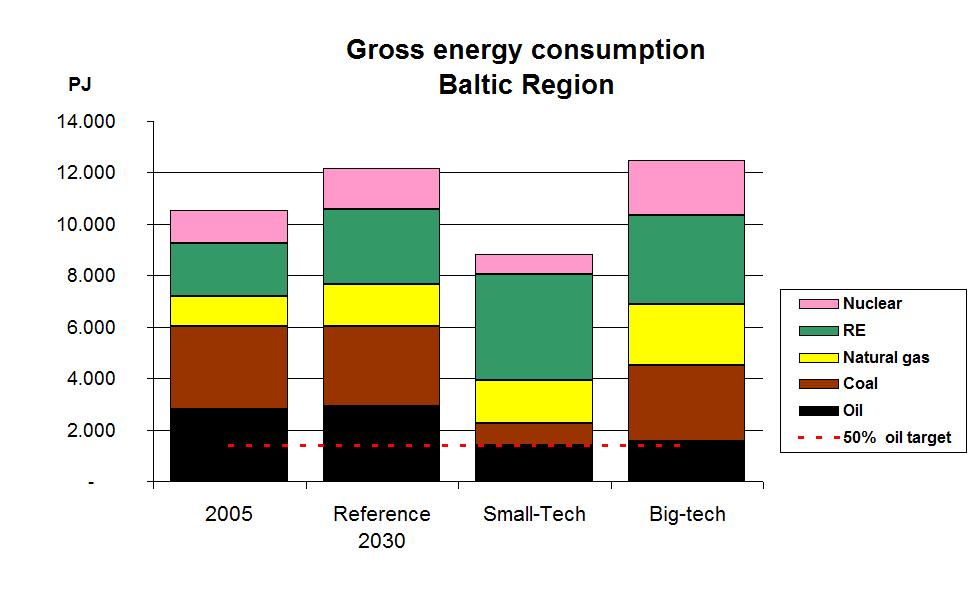
14 Source: Eurostat
15 Bioenergy 16% EU 27 Potential as share of gross energy demand Baltic 31% Calculation based on stats from DG TREN and EEA
16 Bioenergy resources PJ Source: European Environment Agency (2006): How much bioenergy can Europe produce without harming the environment?


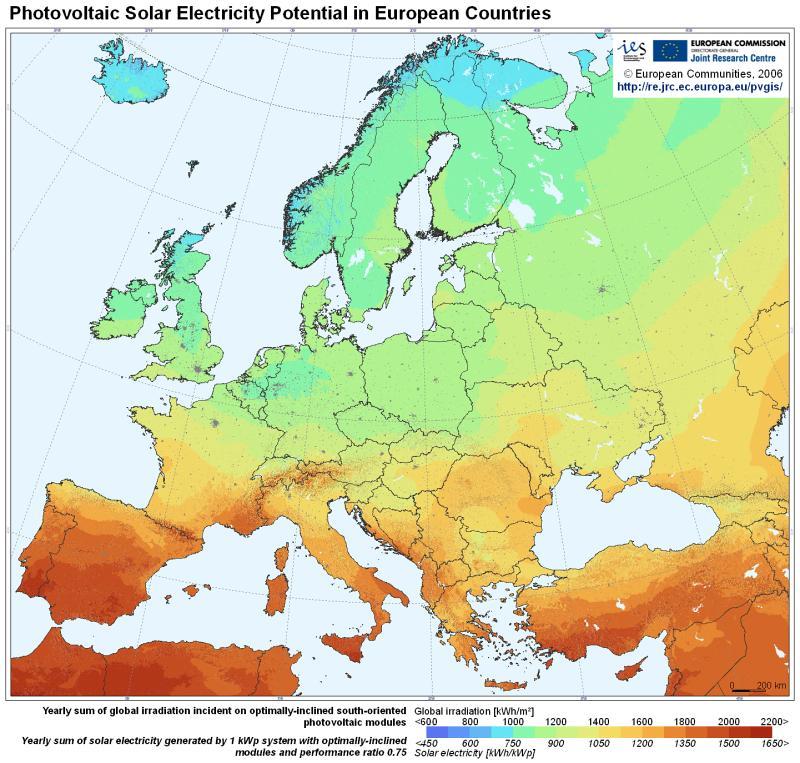
17 Wind energy resource Full Load Hours/Year
18
19 SCENARIOS FOR THE BALTIC SEA REGION 50% oil reduction 50% CO2 emissions reduction in 2030 Ea Energianalyse


20 Developing scenarios Economic growth Fuel prices Saving potentials BSR Scenario RESULTS Infrastructure Technology Development Renewable resources
21 Two scenarios (and a reference) Small-tech Energy savings District heating - CHP Biomass Wind, wave, solar Big-tech Carbon Capture & Storage Nuclear power Biomass Improved fuel economy Electric vehicles Modal-change ICT Improved fuel economy Electric vehicles Biofuels or perhaps a combination


22 Key decision makers Energy manufacturing industry Big power producers Farmers Energy consumers Wind/solar industry Grid companies Politicians (EU, regional, national) Car industry Local politicians and planning authorities Bio-fuel refineries District heating companies

23 Nuclear power Today 15 GW Big-tech 24 GW No phaseout in Sweden and Germany. New nuclear in Poland, Lithuania and 6 th reactor in Finland Small-tech 9 GW Phaseout in Germany, 50 % phaseout in Sweden No nuclear in Lithuania

24 Carbon Capture and Storage Key measure in Big-tech 30 GW power capacity equipped with CCS supplying 22 % of overall electricity demand all large thermal power plants commissioned beyond 2020 with CCS. Coal power plants commissioned in the period are prepared for CCS Assuming 90 % cleaning eff. 10 %-point electric efficiency loss
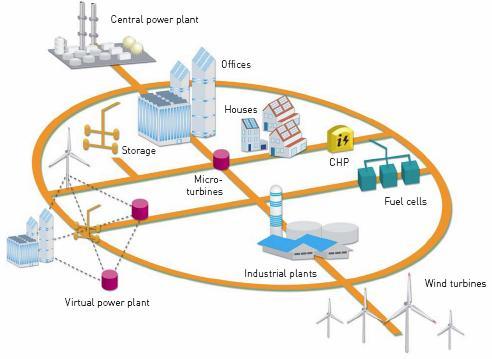
25 Small-tech calls for smart grids and ICT

26 Growth and demand 2.6 % GDP growth annually in both scenarios app. 90 % over 25 years Final energy demand Same energy services but with higher efficiency Fuel economy cars Energy savings Savings Space heating: 15 % Electricity and proces energy: 20 % 2030
27
28 Potential for CHP based district heating PJ / year Final energy demand today Suitable for district systems Electricity system losses today District heating in Small - tech
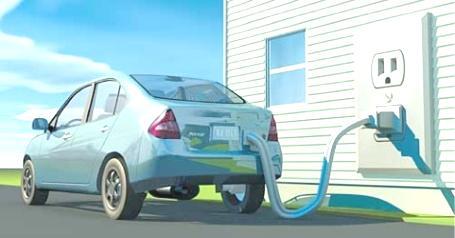
29 Transport Small-tech 2030 Big-tech Fuel economy 160 g CO 2 /km 100 g CO 2 /km 100 g CO 2 /km Electric vehicles 25% 25% Biofuels 5% 15% ICT Modal change 3 % of transport work shifted 9 % of transport work shifted
30 Improvements in fuel economy g/km Average sold car in EU per cent electric cars 10per cent -in plug hybrid cars 5per biofuel cent cars Average car in EU27 scenarios

31 Today s efficiency potential
32 Passenger transport 1.8 % growth p.a.
33 Results
34 Results
35 Results PJ % of oil/gas production from Norway Security of supply Production in 2005 Production potential 2030 Consumption Big-tech 5000 Consumption Small-tech Oil Natural gas Coal Solid biomass
36 Security of supply in EU27, including production from Norway PJ Security of supply Production in 2005 Production potential 2030 Consumption Big-tech Consumption Small-tech Oil Natural gas Coal Solid biomass Ea Energianalyse
37 Critical Assumptions Critical assumptions Small-tech scenario - Energy saving potentials are harvested (many barriers that are not only economic) - Local planning effort to expand district heating and cooling systems (to enjoy benefits of combined heat power) - Off-shore wind grid infrastructure Big-tech scenario - Dependent on the commercialization of carbon capture and storage technology - Public support for more nuclear power - Fossil fuels and uranium are accessible at reasonable prices. Both - Intelligent energy systems and markets - The increased production of biomass for energy conversion. - The fuel economy of new cars is improved considerably. - That electric vehicles or plug-in hybrids are commercialized Ea Energianalyse
 Coal Oil Gas Ea")
38 Development of nominal fuel prices from 1960 to 2006 (annual averages) Coal Oil Gas Ea Energianalyse
39 OPPORTUNITIES FOR COOPERATION SOME CONCRETE IDEAS Ea Energianalyse
40 Opportunities for cooperation Energy infrastructure Including integration of large amount of wind Energy markets Electricity and gas Demonstration of CCS Biomass technologies Sustainable cities and metropolises District heating and CHP Energy savings Transport Cooperation on energy efficient appliances and buildings Ea Energianalyse
41 Scandinavia Baltic countries Coordination of off-shore wind (hydro >< wind) Integrated electricity grids Integrated electricity markets Source: Airtricity Ea Energianalyse
42
43 Next steps Data for Russia Economic consequences Detailed model analyses Gas and electricity systems benefits of interconnectors Stakeholder involvement proces of dioalog Ea Energianalyse
44 Process of dialogue Politicians Answers Utilities Energy planners Project developers Researchers Questions Others Ea Energianalyse