The following is a description of the tasks conducted during the 2010 annual supply well sampling event and the results obtained.
|
|
|
- Betty Tyler
- 5 years ago
- Views:
Transcription
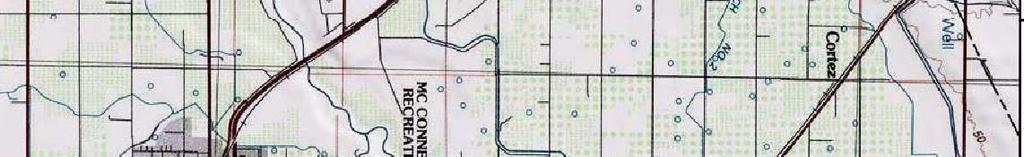
1 February 9, 2011 Mr. Jan Alfson California Regional Water Quality Control Board Fresno Branch Office 1685 E Street Fresno, CA Subject: 2010 Annual Supply Well Sampling Data Transmittal Hilmar Cheese Company, Hilmar, California Dear Mr. Alfson: On behalf of Hilmar Cheese Company (HCC), Jacobson James & Associates (JJ&A) has prepared this 2010 Annual Supply Well Sampling Data Transmittal to provide the results from supply well sampling conducted at, and in the vicinity of, the HCC facility located in Hilmar, California as shown on Figure 1 (the Site). The annual groundwater sampling was conducted from December 13 to December 15, 2010 in accordance with the October 28, 2010 Annual Supply Well Sampling Work Plan (the Work Plan) and the Regional Water Quality Control Board s response letter dated November 18, The following is a description of the tasks conducted during the 2010 annual supply well sampling event and the results obtained ANNUAL SUPPLY WELL SAMPLING SCOPE OF WORK AND RESULTS The Work Plan proposed 22 supply wells for the 2010 annual sampling event. Table 1 identifies the wells and provides their construction details. Figure 2 provides the supply well locations. As noted on Table 1 and Figure 2, six of the supply wells (DW-93/IW-17, IW-20, IW-21, DW-38E, DW-27B and DW-32/IW-4) could not be sampled. Four of the wells (DW-93/IW-17, IW-20, IW-21 and DW-38E) are used primarily for irrigation and were not operating during the sampling event. Well DW-27B no longer exists and is removed from the annual sampling program. Well DW-32/IW-4 had been removed from service, however, a sample was collected from the new replacement well (IW-04B) located approximately 30-feet to the northwest. This new well replaces DW-32/IW-4. The supply well groundwater samples were analyzed for the following constituents using the identified analytical methods; results are provided in Table 2. Anions; sulfate [SO 4 ], chloride [Cl], and nitrate-nitrogen [NO 3 -N] by US Environmental Protection Agency (US EPA) Method 300.0; 2010 Annual SW Sampling_Final_020911
2 2010 Annual Supply Well Sampling Data Transmittal February 9, 2011 Page 2 of 5 Cations; calcium [Ca], magnesium [Mg], manganese [Mn], sodium [Na], and potassium [K] by US EPA Method 200.7; Total Alkalinity (as calcium carbonate [CaCO 3 ]) with Bicarbonate (HCO 3 ) by Standard Method (SM) 2320B; Total Dissolved Solids (TDS) by SM 2540C; Dissolved Iron by EPA Method 200.7; Total Kjeldahl Nitrogen (TKN) by EPA Method 351.2; and Dissolved Arsenic by EPA Method The supply well groundwater samples were also monitored in the field for the following parameters; results are provided in the field data sheets in Attachment 1. ph; Temperature; Electrical Conductivity (EC); and Dissolved Oxygen (DO). The supply well sampling was performed consistent with prior supply well sampling events. The supply wells were purged and sampled at the closest point as possible to the well head. The supply wells were purged until water-quality parameters (ph, temperature, oxygen reduction potential (ORP), conductivity, and turbidity) stabilized and the well pump cycled on as summarized in the field monitoring forms provided in Attachment 1. A groundwater sample was collected from each location directly into sample containers supplied by the laboratory. Samples were labeled and immediately placed on ice (water-based) in an insulated cooler and submitted under chain-of-custody control to a California State-certified laboratory. Samples to be analyzed for metals were filtered in the field, using disposable 0.45 micron filter, prior to being preserved. The analytical results are presented in Table 2. Laboratory reports with chain-of-custody forms are provided in Attachment 2. A summary of historical analytical results for the wells is included in Attachment 3 and historical trend graphs are presented in Attachment 4. Quality Control Sampling The quality assurance/quality control (QA/QC) program for HCC include steps to evaluate the precision and accuracy of the laboratory analytical results and assess the integrity of the field procedures, sample handling and laboratory procedures.
3 2010 Annual Supply Well Sampling Data Transmittal February 9, 2011 Page 3 of 5 Field QC Samples Field QC samples, including field duplicate samples, were collected during the groundwater sampling event. Three field duplicate samples were collected from supply wells DW-29, DW-60 and DW-74. A duplicate summary evaluation is provided as Table 3. Data Validation Data validation evaluated the precision and accuracy of the analytical results. The procedures used for validating the data are consistent with those referenced in the October 2004 National Functional Guidelines for Inorganic Data Review prepared by the USEPA. Data collected were checked for the following: Data completeness; Holding times and proper preservation; Cleanliness of laboratory and field blanks; Accuracy and precision of laboratory quality control check samples; and Precision of field duplicate samples. Detailed data validation results are documented in a memorandum corresponding to the specific laboratory report reviewed during the validation process. The validation memorandum is included as Attachment 5. Where validation results indicated bias or poor quality, data qualifiers were assigned to the respective analytical data. These data qualifiers are appended to the respective data contained within the project database. Data validation flags, assigned during the data validation process, are defined in the Data Validation Report (Attachment 5). Data validation flags indicate when results are considered anomalous, estimated or rejected. The results from data validation indicate that the data results are considered usable, as qualified, for future decision-making purposes ANNUAL SUPPLY WELL SAMPLING RECOMMENDATIONS AND SCHEDULE Recommended 2011 changes include: (1) removing well DW-27B as it no longer exists, (2) replacing well DW-32/IW-4 with IW-04B, and (3) conducting the 2011 annual supply sell sampling event during the irrigation season (July/August 2011).
4
5 2010 Annual Supply Well Sampling Data Transmittal February 9, 2011 Page 5 of 5 List of Tables Table 1 Table 2 Table 3 Well Construction and Sampling Status Summary 2010 Supply Well Analytical Results 2010 QC Analytical Summary: Duplicate Sample Evaluation List of Figures Figure 1 Figure 2 Site Location Map Annual Supply Well Sampling Program Well Locations List of Attachments Attachment Monitoring and Sampling Forms Attachment 2 Attachment 3 Attachment 4 Attachment Laboratory Analytical Results and Chain-of-Custody Documentation (Electronic Format) Summary of Historical Analytical Data Historical Trend Graphs Data Validation Report
6 TABLES
7 Well ID Sample Date Parcel Well Location Approximate Year Drilled TABLE 1 WELL CONSTRUCTION 1 AND SAMPLING STATUS SUMMARY 2010 Annual Supply Well Sampling Hilmar Cheese Company Hilmar, California Well Use Depth of Boring (ft bgs) Depth of Well (ft bgs) Well Casing Diameter (inches) Perforated Zone (ft bgs) Seal Depth (ft bgs) Seal Material DW 23 12/15/ Columbus Ave 1995 Domestic Bentonite Notes DW 24 12/15/ Columbus Ave 1993 Domestic Bentonite DW 25 12/15/ Columbus Ave 6 DW 27A 12/14/ Columbus Ave 2005 Domestic a Cement DW 27B NS Columbus Ave Well no longer exists. DW 29 12/14/ August Ave 1994 Domestic b Bentonite DW 31 12/14/ August Ave 1976 Domestic Unknown DW 32/IW 4 NS August Ave 1998 Irrigation c Bentonite IW 04B 12/15/ August Ave Irrigation Well out of service. No pump in well. IW 4B is replacement well. DW 34 12/13/ August Ave 1983 Domestic Bentonite DW 38E NS off Lander Ave 1988 Irrigation DW 53 12/13/ Lander Ave 1991 Domestic Bentonite Well not running. Cannot run unless irrigating. DW 56/IN 4/IN 4A 12/14/ Oslo Way 1984 Dairy Bentonite DW 58 12/14/ Oslo Way 6 DW 60 12/14/ Oslo Way 6 DW 69 12/13/ W. August Ave 1998 Domestic Bentonite NE Corner Lander DW 74 12/14/ Ave/August Ave 1997 Domestic Bentonite Center of SW1/4 above DW 93/IW 17 NS Lat. 6 Sec Irrigation Unknown DW 99 12/15/ Columbus Ave 2002 Domestic Bentonite Well not running. Cannot run unless irrigating. DW C 12/15/ Columbus Ave IW 20 NS IW 21 NS North bank of Lat 6, SW1/4 of NE1/4 of Sec 10 South bank of Lat 6, 500 ft E of Lander Ave Irrigation No Seal 1964 Irrigation No Seal Well not running. Cannot run unless irrigating. Well not running. Cannot run unless irrigating. Notes: NS = Not Sampled ft bgs = feet below ground surface 1 = All well construction data is from DWR logs unless otherwise noted. a = Field Observations indicate a 12 inch diameter casing; DWR well completion report list well casing as 6 inch diameter. b = Field Observations indicate an 8 inch diameter casing; DWR well completion report list well casing as 6 inch diameter. c= Field Observations indicate a 6 inch diameter casing; DWR well completion report list well casing as 12 inch diameter. Wells to be removed from the 2011 Annual Supply Well Sampling Program 1 of 1
8 TABLE SUPPLY WELL ANALYTICAL RESULTS 2010 Annual Supply Well Sampling Hilmar Cheese Company Hilmar, California Sample Location Sample ID Sample Date Alkalinity, Bicarbonate as CaC03 (mg/l) Alkalinity, Carbonate as CaCO3 (mg/l) Alkalinity, Hydroxide as CaCO3 (mg/l) Alkalinity, Total as CaC03 (mg/l) DW 23 OW DW 23 A 12/15/ <3.0 < <1.0 UJ DW 23 OW DW 23 AF 12/15/2010 < < DW 24 OW DW 24 A 12/15/ <3.0 < <1.0 UJ DW 24 OW DW 24 AF 12/15/ < DW 25 OW DW 25 A 12/15/ <3.0 < <1.0 UJ DW 25 OW DW 25 AF 12/15/2010 < < DW 27 OW DW 27 A 12/14/ <3.0 < <1.0 DW 27 OW DW 27 AF 12/14/2010 < < DW 29 OW DW 29 A 12/14/ <3.0 < DW 29 OW DW 29 AF 12/14/ < DW 31 OW DW 31 A 12/14/ <30 < <1.0 DW 31 OW DW 31 AF 12/14/ < DW 34 OW DW 34 A 12/13/ <3.0 < <1.0 UJ DW 34 OW DW 34 AF 12/13/ < DW 53 OW DW 53 A 12/13/ <3.0 < <1.0 UJ DW 53 OW DW 53 AF 12/13/ < DW 58 OW DW 58 A 12/14/ <3.0 < <1.0 DW 58 OW DW 58 AF 12/14/2010 < < DW 60 OW DW 60 A 12/14/ <3.0 < <1.0 DW 60 OW DW 60 AF 12/14/ < DW 69 OW DW 69 A 12/13/ <30 < <1.0 UJ DW 69 OW DW 69 AF 12/13/ < DW 74 OW DW 74 A 12/14/ <3.0 < J <1.0 DW 74 OW DW 74 AF 12/14/ < < DW 99 OW DW 99 A 12/15/ <3.0 < <1.0 UJ DW 99 OW DW 99 AF 12/15/2010 < < < DW C OW DW C A 12/15/ <3.0 < <1.0 UJ DW C OW DW C AF 12/15/2010 < < < Chloride (mg/l) Dissolved Arsenic (ug/l) Dissolved Calcium (mg/l) Dissolved Iron (mg/l) Dissolved Magnesium (mg/l) Dissolved Manganese (mg/l) Dissolved Potassium (mg/l) Dissolved Sodium (mg/l) Nitrate Nitrogen (mg/l) Solids, total dissolved (mg/l) Sulfate (mg/l) Total Kjeldahl Nitrogen (mg/l) Page 1 of 2
9 TABLE SUPPLY WELL ANALYTICAL RESULTS 2010 Annual Supply Well Sampling Hilmar Cheese Company Hilmar, California Sample Location Sample ID Sample Date Alkalinity, Bicarbonate as CaC03 (mg/l) Alkalinity, Carbonate as CaCO3 (mg/l) Alkalinity, Hydroxide as CaCO3 (mg/l) Alkalinity, Total as CaC03 (mg/l) Chloride (mg/l) Dissolved Arsenic (ug/l) Dissolved Calcium (mg/l) Dissolved Iron (mg/l) Dissolved Magnesium (mg/l) Dissolved Manganese (mg/l) Dissolved Potassium (mg/l) Dissolved Sodium (mg/l) Nitrate Nitrogen (mg/l) Solids, total dissolved (mg/l) Sulfate (mg/l) Total Kjeldahl Nitrogen (mg/l) IN 04/ 04A OW IN 4 and IN 4A A 12/14/ <3.0 < <1.0 UJ IN 04/ 04A OW IN 4 and IN 4A AF 12/14/ < IW 04B OW IW 04B A 12/15/ <30 < J IW 04B OW IW 04B AF 12/15/2010 < < Notes: mg/l = milligrams per liter µg/l = micrograms per liter Page 2 of 2
10 TABLE QC ANALYTICAL SUMMARY: DUPLICATE SAMPLE EVALUATION 2010 Annual Supply Well Sampling Hilmar Cheese Company Hilmar, California Compound Location ID Sample ID Sample Date Sample Type Units DW 29 OW DW 29 A 12/14/2010 Primary DW 29 OW DW 29 B 12/14/2010 Duplicate RPD DW 29 OW DW 29 AF 12/14/2010 Primary DW 29 OW DW 29 BF 12/14/2010 Duplicate RPD DW 60 OW DW 60 A 12/14/2010 Primary DW 60 OW DW 60 B 12/14/2010 Duplicate RPD DW 60 OW DW 60 AF 12/14/2010 Primary DW 60 OW DW 60 BF 12/14/2010 Duplicate RPD DW 74 OW DW 74 A 12/14/2010 Primary DW 74 OW DW 74 B 12/14/2010 Duplicate RPD DW 74 OW DW 74 AF 12/14/2010 Primary DW 74 OW DW 74 BF 12/14/2010 Duplicate Gen Min Alkalinity, Bicarbonate as CaC03 mg/l % % % Alkalinity, Carbonate as CaCO3 mg/l <3.0 <3.0 <3.0 <3.0 <3.0 <3.0 Alkalinity, Hydroxide as CaCO3 mg/l <3.0 <3.0 <3.0 <3.0 <3.0 <3.0 Alkalinity, Total as CaC03 mg/l % % % Chloride mg/l % % % Dissolved Calcium mg/l % % % Dissolved Potassium mg/l % % % Dissolved Sodium mg/l % % % Nitrate Nitrogen mg/l % % 14 J 18 J Solids, total dissolved mg/l % % % Sulfate mg/l % % % Total Kjeldahl Nitrogen mg/l % <1.0 <1.0 <1.0 <1.0 Metals Dissolved Arsenic ug/l 3.2 < % % % Dissolved Iron mg/l <0.050 <0.050 <0.050 <0.050 <0.050 <0.050 Dissolved Magnesium mg/l % % % Dissolved Manganese mg/l % % <0.010 <0.010 RPD Notes: mg/l = milligrams per liter µg/l = micrograms per liter RPD = Relative Percent Difference Page 1 of 1
11 FIGURES


12
13
14 ATTACHMENT MONITORING AND SAMPLING FORMS
15
16
17
18
19
20
21
22
23
24
25
26
27
28
29
30
31
32
33
34 ATTACHMENT LABORATORY ANALYTICAL RESULTS AND CHAIN-OF-CUSTODY DOCUMENTATION (INCLUDED IN ELECTRONIC FORMAT ON COMPACT DISC)
35 Page 1 of 19
36 Page 2 of 19
37 Page 3 of 19
38 Page 4 of 19
39 Page 5 of 19
40 Page 6 of 19
41 Page 7 of 19
42 Page 8 of 19
43 Page 9 of 19
44 Page 10 of 19
45 Page 11 of 19
46 Page 12 of 19
47 Page 13 of 19
48 Page 14 of 19
49 Page 15 of 19
50 Page 16 of 19
51 Page 17 of 19
52 Page 18 of 19
53 Page 19 of 19
54 Page 1 of 30
55 Page 2 of 30
56 Page 3 of 30
57 Page 4 of 30
58 Page 5 of 30
59 Page 6 of 30
60 Page 7 of 30
61 Page 8 of 30
62 Page 9 of 30
63 Page 10 of 30
64 Page 11 of 30
65 Page 12 of 30
66 Page 13 of 30
67 Page 14 of 30
68 Page 15 of 30
69 Page 16 of 30
70 Page 17 of 30
71 Page 18 of 30
72 Page 19 of 30
73 Page 20 of 30
74 Page 21 of 30
75 Page 22 of 30
76 Page 23 of 30
77 Page 24 of 30
78 Page 25 of 30
79 Page 26 of 30
80 Page 27 of 30
81 Page 28 of 30
82 Page 29 of 30
83 Page 30 of 30
84 Page 1 of 36
85 Page 2 of 36
86 Page 3 of 36
87 Page 4 of 36
88 Page 5 of 36
89 Page 6 of 36
90 Page 7 of 36
91 Page 8 of 36
92 Page 9 of 36
93 Page 10 of 36
94 Page 11 of 36
95 Page 12 of 36
96 Page 13 of 36
97 Page 14 of 36
98 Page 15 of 36
99 Page 16 of 36
100 Page 17 of 36
101 Page 18 of 36
102 Page 19 of 36
103 Page 20 of 36
104 Page 21 of 36
105 Page 22 of 36
106 Page 23 of 36
107 Page 24 of 36
108 Page 25 of 36
109 Page 26 of 36
110 Page 27 of 36
111 Page 28 of 36
112 Page 29 of 36
113 Page 30 of 36
114 Page 31 of 36
115 Page 32 of 36
116 Page 33 of 36
117 Page 34 of 36
118 Page 35 of 36
119 Page 36 of 36
120 ATTACHMENT 3 SUMMARY OF HISTORICAL ANALYTICAL DATA
121 ATTACHMENT 3 SUMMARY OF HISTORICAL ANALYTICAL DATA 2010 Annual Supply Well Sampling Hilmar Cheese Company Hilmar, California Sample Location Sample ID Sample Date Alkalinity, Bicarbonate as CaC03 (mg/l) Alkalinity, Carbonate as CaCO3 (mg/l) Alkalinity, Hydroxide as CaCO3 (mg/l) Alkalinity, Total as CaC03 (mg/l) Ammonia as Nitrogen (mg/l) Chemical Oxygen Demand (mg O/L) Chloride (mg/l) Conductivity (umhos/cm) Dissolved Arsenic (mg/l) Dissolved Arsenic (ug/l) Dissolved Barium (mg/l) Dissolved Boron (mg/l) Dissolved Calcium (mg/l) Dissolved Iron (mg/l) Dissolved Magnesium (mg/l) DW 23 DW 23 10/3/ < < DW 23 DW 23 5/5/ <1 <1 770 < <0.1 < < <0.05 < DW 23 OW DW 23 A 5/14/ <1.0 < < J < DW 23 OW DW 23 A 12/15/ <3.0 < <1.0 UJ DW 23 OW DW 23 AF 5/14/ < DW 23 OW DW 23 AF 12/15/2010 < < DW 24 DW 24 5/5/ <1 <1 410 < <0.1 < < <0.05 < DW 24 OW DW 24 A 5/14/ <1.0 < < < DW 24 OW DW 24 A 12/15/ <3.0 < <1.0 UJ DW 24 OW DW 24 AF 5/14/ < < DW 24 OW DW 24 AF 12/15/ < DW 25 DW 25 5/5/ <1 <1 190 <1 < <0.1 <0.05 < <0.05 <1 30 < DW 25 OW DW 25 A 5/14/ <1.0 < < < DW 25 OW DW 25 A 12/15/ <3.0 < <1.0 UJ DW 25 OW DW 25 AF 5/14/2008 < < < < DW 25 OW DW 25 AF 12/15/2010 < < DW 27A OW DW 27A A 5/19/ <1.0 < < < DW 27A OW DW 27A AF 5/19/ < DW 27A OW DW 27A A 12/14/ <3.0 < <1.0 DW 27A OW DW 27A AF 12/14/2010 < < DW 29 DW 29 5/19/ <1 <1 260 <1 < < <0.1 < < <0.05 < DW 29 OW DW 29 A 5/13/ <1.0 < < <1.0 UJ 7.7 DW 29 OW DW 29 A 12/14/ <3.0 < DW 29 OW DW 29 AF 5/13/ < DW 29 OW DW 29 AF 12/14/ < DW 31 DW 31 5/12/ <1 <1 400 < <0.1 < < <0.05 <1 43 < DW 31 OW DW 31 A 9/28/ <30 < DW 31 OW DW 31 A 12/14/ <30 < <1.0 DW 31 OW DW 31 AF 9/28/ < J 87 DW 31 OW DW 31 AF 12/14/ < DW 34 DW 34 5/3/ <1 <1 420 <1 < <0.1 < <0.05 < DW 34 OW DW 34 A 5/15/ <1.0 < < < DW 34 OW DW 34 A 12/13/ <3.0 < <1.0 UJ DW 34 OW DW 34 AF 5/15/ < < < DW 34 OW DW 34 AF 12/13/ < DW 38E OW DW 38E A 5/19/ < < < < DW 38E OW DW 38E AF 5/19/ DW 53 DW 53 5/6/ DW 53 DW 53 5/25/ <1 <1 140 <1 < < <0.1 < < <0.05 <1 17 < DW 53 OW DW 53 A 5/20/ <1.0 < < <1.0 UJ 2.4 DW 53 OW DW 53 A 7/29/ <1.0 < <1.0 DW 53 OW DW 53 A 12/13/ <3.0 < <1.0 UJ DW 53 OW DW 53 AF 5/20/ < < DW 53 OW DW 53 AF 7/29/ < DW 53 OW DW 53 AF 12/13/ < DW 58 DW 58 5/18/ <1 <1 470 <1 < <0.1 < < <0.05 <1 45 < DW 58 OW DW 58 A 5/19/ <1.0 < <2.0 UJ < Dissolved Manganese (mg/l) Dissolved Potassium (mg/l) Dissolved Sodium (mg/l) Hardness, Total (as CaCO3) (mg/l) Nitrate Nitrogen (mg/l) Nitrite as N (mg/l) ph (ph U) Phosphorus (mg/l) Solids, total dissolved (mg/l) Solids, total fixed dissolved (mg/l) Solids, total volatile dissolved (mg/l) Sulfate (mg/l) Sulfide (mg/l) Total Aluminum (mg/l) Total Arsenic (ug/l) Total Barium (ug/l) Total Boron (mg/l) Total Calcium (mg/l) Total Iron (mg/l) Total Kjeldahl Nitrogen (mg/l) Total Magnesium (mg/l) Total Manganese (mg/l) Total Organic Carbon (mg/l) Total Potassium (mg/l) Total Sodium (mg/l) Page 1 of 3
122 ATTACHMENT 3 SUMMARY OF HISTORICAL ANALYTICAL DATA 2010 Annual Supply Well Sampling Hilmar Cheese Company Hilmar, California Sample Location Sample ID Sample Date Alkalinity, Bicarbonate as CaC03 (mg/l) Alkalinity, Carbonate as CaCO3 (mg/l) Alkalinity, Hydroxide as CaCO3 (mg/l) Alkalinity, Total as CaC03 (mg/l) Ammonia as Nitrogen (mg/l) Chemical Oxygen Demand (mg O/L) Chloride (mg/l) Conductivity (umhos/cm) Dissolved Arsenic (mg/l) Dissolved Arsenic (ug/l) Dissolved Barium (mg/l) Dissolved Boron (mg/l) Dissolved Calcium (mg/l) Dissolved Iron (mg/l) Dissolved Magnesium (mg/l) DW 58 OW DW 58 A 12/14/ <3.0 < <1.0 DW 58 OW DW 58 AF 5/19/ < DW 58 OW DW 58 AF 12/14/2010 < < DW 60 DW 60 5/18/ <1 <1 220 < <0.1 < < <0.05 < DW 60 OW DW 60 A 5/15/ <1.0 < < <1.0 UJ 7.2 DW 60 OW DW 60 A 12/14/ <3.0 < <1.0 DW 60 OW DW 60 AF 5/15/ < DW 60 OW DW 60 AF 12/14/ < DW 69 DW 69 12/29/ < < DW 69 DW 69 5/3/ <1 <1 290 <1 < <0.1 < <0.05 < DW 69 OW DW 69 A 5/15/ <1.0 < < < DW 69 OW DW 69 A 12/13/ <30 < <1.0 UJ DW 69 OW DW 69 AF 5/15/ < < DW 69 OW DW 69 AF 12/13/ < DW 74 OW DW 74 A 6/2/ <1 <1 200 < DW 74 OW DW 74 A 12/14/ <3.0 < J <1.0 DW 74 OW DW 74 AF 6/2/ < < < DW 74 OW DW 74 AF 12/14/ < < DW 99 DW 99 5/5/ <1 <1 240 < <0.1 < < <0.05 < DW 99 OW DW 99 A 5/14/ <1.0 < < J < DW 99 OW DW 99 A 12/15/ <3.0 < <1.0 UJ DW 99 OW DW 99 AF 5/14/ < < DW 99 OW DW 99 AF 12/15/2010 < < < DW C DW C 6/24/ < < DW C DW C 5/4/ <1 <1 230 < <0.1 < <0.05 < DW C OW DW C A 5/14/ <1.0 < < J < DW C OW DW C A 12/15/ <3.0 < <1.0 UJ DW C OW DW C AF 5/14/ < < < DW C OW DW C AF 12/15/2010 < < < IN 04/ 04A IN 04/ 04A 5/18/ <1 <1 240 < <0.1 < < <0.05 < IN 04/ 04A OW IN 4 and IN 4A A 5/15/ <1.0 < < < IN 04/ 04A OW IN 4 and IN 4A A 12/14/ <3.0 < <1.0 UJ IN 04/ 04A OW IN 4 and IN 4A AF 5/15/ < IN 04/ 04A OW IN 4 and IN 4A AF 12/14/ < IW 04 IW 04 5/3/ <1 < < <5 Jo <0.1 < <0.05 < IW 04 OW IW 4 A 5/15/ <1.0 < < < < IW 04 OW IW 4 AF 5/15/2008 < IW 04B OW IW 04B A 12/15/ <30 < J IW 04B OW IW 04B AF 12/15/2010 < < IW 17 IW 17 6/1/ <1 <1 940 < < <0.1 < IW 20 IW 20 6/1/ <1 <1 580 < < <0.1 < < < IW 20 OW 1W 20 A 5/15/ <1.0 < < < IW 20 OW 1W 20 AF 5/15/ IW 20 OW IW 20 A 6/23/ <1.0 < <1.0 IW 20 OW IW 20 AF 6/23/ IW 21 IW 21 6/1/ <1 <1 140 <1 < < <0.1 < < <0.05 <1 16 < IW 21 OW IW 21 A 5/14/ <1.0 < < < Dissolved Manganese (mg/l) Dissolved Potassium (mg/l) Dissolved Sodium (mg/l) Hardness, Total (as CaCO3) (mg/l) Nitrate Nitrogen (mg/l) Nitrite as N (mg/l) ph (ph U) Phosphorus (mg/l) Solids, total dissolved (mg/l) Solids, total fixed dissolved (mg/l) Solids, total volatile dissolved (mg/l) Sulfate (mg/l) Sulfide (mg/l) Total Aluminum (mg/l) Total Arsenic (ug/l) Total Barium (ug/l) Total Boron (mg/l) Total Calcium (mg/l) Total Iron (mg/l) Total Kjeldahl Nitrogen (mg/l) Total Magnesium (mg/l) Total Manganese (mg/l) Total Organic Carbon (mg/l) Total Potassium (mg/l) Total Sodium (mg/l) Page 2 of 3
123 ATTACHMENT 3 SUMMARY OF HISTORICAL ANALYTICAL DATA 2010 Annual Supply Well Sampling Hilmar Cheese Company Hilmar, California Sample Location Sample ID Sample Date Alkalinity, Bicarbonate as CaC03 (mg/l) Alkalinity, Carbonate as CaCO3 (mg/l) Alkalinity, Hydroxide as CaCO3 (mg/l) Alkalinity, Total as CaC03 (mg/l) Ammonia as Nitrogen (mg/l) Chemical Oxygen Demand (mg O/L) Chloride (mg/l) Conductivity (umhos/cm) Dissolved Arsenic (mg/l) Dissolved Arsenic (ug/l) Dissolved Barium (mg/l) Dissolved Boron (mg/l) Dissolved Calcium (mg/l) Dissolved Iron (mg/l) Dissolved Magnesium (mg/l) Dissolved Manganese (mg/l) Dissolved Potassium (mg/l) Dissolved Sodium (mg/l) Hardness, Total (as CaCO3) (mg/l) Nitrate Nitrogen (mg/l) Nitrite as N (mg/l) ph (ph U) Phosphorus (mg/l) Solids, total dissolved (mg/l) Solids, total fixed dissolved (mg/l) Solids, total volatile dissolved (mg/l) Sulfate (mg/l) Sulfide (mg/l) Total Aluminum (mg/l) Total Arsenic (ug/l) Total Barium (ug/l) Total Boron (mg/l) Total Calcium (mg/l) Total Iron (mg/l) Total Kjeldahl Nitrogen (mg/l) Total Magnesium (mg/l) Total Manganese (mg/l) Total Organic Carbon (mg/l) Total Potassium (mg/l) Total Sodium (mg/l) IW 21 OW IW 21 A 6/23/ <1.0 < <1.0 IW 21 OW IW 21 AF 5/14/ < < < IW 21 OW IW 21 AF 6/23/ < < Notes: mg/l = milligrams per liter µg/l = micrograms per liter mg O/L = milligrams of oxygen per liter uhmhos/cm = microhms per centimeter Page 3 of 3
124 ATTACHMENT 4 HISTORICAL TREND GRAPHS
125 DW 23 HISTORICAL ANALYTICAL DATA 2010 Annual Supply Well Sampling Hilmar Cheese Company Hilmar, California Total Dissolved Solids (TDS) (milligrams per liter) Chloride and Sodium (milligrams per liter) Solids, total dissolved (mg/l) Chloride (mg/l) Dissolved Sodium (mg/l)
126 DW 24 HISTORICAL ANALYTICAL DATA 2010 Annual Supply Well Sampling Hilmar Cheese Company Hilmar, California Total Dissolved Solids (TDS) (milligrams per liter) Chloride and Sodium (milligrams per liter) /1/2005 1/1/2006 1/1/2007 1/1/2008 1/1/2009 1/1/2010 Solids, total dissolved (mg/l) Chloride (mg/l) Dissolved Sodium (mg/l) 0
127 DW 25 HISTORICAL ANALYTICAL DATA 2010 Annual Supply Well Sampling Hilmar Cheese Company Hilmar, California Total Dissolved Solids (TDS) (milligrams per liter) Chloride and Sodium (milligrams per liter) /1/2005 1/1/2006 1/1/2007 1/1/2008 1/1/2009 1/1/2010 Solids, total dissolved (mg/l) Chloride (mg/l) Dissolved Sodium (mg/l) 0
128 DW 27A HISTORICAL ANALYTICAL DATA 2010 Annual Supply Well Sampling Hilmar Cheese Company Hilmar, California Total Dissolved Solids (TDS) (milligrams per liter) Chloride and Sodium (milligrams per liter) /1/2008 1/1/2009 1/1/2010 Solids, total dissolved (mg/l) Chloride (mg/l) Dissolved Sodium (mg/l) 0
129 DW 29 HISTORICAL ANALYTICAL DATA 2010 Annual Supply Well Sampling Hilmar Cheese Company Hilmar, California Total Dissolved Solids (TDS) (milligrams per liter) Chloride and Sodium (milligrams per liter) /1/2005 1/1/2006 1/1/2007 1/1/2008 1/1/2009 1/1/2010 Solids, total dissolved (mg/l) Chloride (mg/l) Dissolved Sodium (mg/l) 0
130 Chloride and Sodium (milligrams per liter) DW 31 HISTORICAL ANALYTICAL DATA 2010 Annual Supply Well Sampling Hilmar Cheese Company Hilmar, California 0 11/1/2010 9/1/2010 7/1/ Total Dissolved Solids (TDS) (milligrams per liter) 5/1/2005 7/1/2005 9/1/ /1/2005 1/1/2006 3/1/2006 5/1/2006 7/1/2006 9/1/ /1/2006 1/1/2007 3/1/2007 5/1/2007 7/1/2007 9/1/ /1/2007 1/1/2008 3/1/2008 5/1/2008 7/1/2008 9/1/ /1/2008 1/1/2009 3/1/2009 5/1/2009 7/1/2009 9/1/ /1/2009 1/1/2010 3/1/2010 5/1/2010 Solids, total dissolved (mg/l) Chloride (mg/l) Dissolved Sodium (mg/l)
131 DW 34 HISTORICAL ANALYTICAL DATA 2010 Annual Supply Well Sampling Hilmar Cheese Company Hilmar, California Total Dissolved Solids (TDS) (milligrams per liter) Chloride and Sodium (milligrams per liter) /1/2005 1/1/2006 1/1/2007 1/1/2008 1/1/2009 1/1/2010 Solids, total dissolved (mg/l) Chloride (mg/l) Dissolved Sodium (mg/l) 0
132 DW 53 HISTORICAL ANALYTICAL DATA 2010 Annual Supply Well Sampling Hilmar Cheese Company Hilmar, California Total Dissolved Solids (TDS) (milligrams per liter) Chloride and Sodium (milligrams per liter) Solids, total dissolved (mg/l) Chloride (mg/l) Dissolved Sodium (mg/l)
133 DW 58 HISTORICAL ANALYTICAL DATA 2010 Annual Supply Well Sampling Hilmar Cheese Company Hilmar, California Total Dissolved Solids (TDS) (milligrams per liter) Chloride and Sodium (milligrams per liter) /1/2005 1/1/2006 1/1/2007 1/1/2008 1/1/2009 1/1/2010 Solids, total dissolved (mg/l) Chloride (mg/l) Dissolved Sodium (mg/l) 0
134 DW 60 HISTORICAL ANALYTICAL DATA 2010 Annual Supply Well Sampling Hilmar Cheese Company Hilmar, California Total Dissolved Solids (TDS) (milligrams per liter) Chloride and Sodium (milligrams per liter) /1/2005 1/1/2006 1/1/2007 1/1/2008 1/1/2009 1/1/2010 Solids, total dissolved (mg/l) Chloride (mg/l) Dissolved Sodium (mg/l) 0
135 DW 69 HISTORICAL ANALYTICAL DATA 2010 Annual Supply Well Sampling Hilmar Cheese Company Hilmar, California Total Dissolved Solids (TDS) (milligrams per liter) Chloride and Sodium (milligrams per liter) Solids, total dissolved (mg/l) Chloride (mg/l) Dissolved Sodium (mg/l)
136 DW 74 HISTORICAL ANALYTICAL DATA 2010 Annual Supply Well Sampling Hilmar Cheese Company Hilmar, California Total Dissolved Solids (TDS) (milligrams per liter) Chloride and Sodium (milligrams per liter) /1/2008 1/1/2009 1/1/2010 Solids, total dissolved (mg/l) Chloride (mg/l) Dissolved Sodium (mg/l) 0
137 DW 99 HISTORICAL ANALYTICAL DATA 2010 Annual Supply Well Sampling Hilmar Cheese Company Hilmar, California Total Dissolved Solids (TDS) (milligrams per liter) Chloride and Sodium (milligrams per liter) /1/2005 1/1/2006 1/1/2007 1/1/2008 1/1/2009 1/1/2010 Solids, total dissolved (mg/l) Chloride (mg/l) Dissolved Sodium (mg/l) 0
138 DW C HISTORICAL ANALYTICAL DATA 2010 Annual Supply Well Sampling Hilmar Cheese Company Hilmar, California Chloride and Sodium (milligrams per liter) /1/2010 9/1/2010 6/1/ Total Dissolved Solids (TDS) (milligrams per liter) 6/1/2004 9/1/ /1/2004 3/1/2005 6/1/2005 9/1/ /1/2005 3/1/2006 6/1/2006 9/1/ /1/2006 3/1/2007 6/1/2007 9/1/ /1/2007 3/1/2008 6/1/2008 9/1/ /1/2008 3/1/2009 6/1/2009 9/1/ /1/2009 3/1/2010 Solids, total dissolved (mg/l) Chloride (mg/l) Dissolved Sodium (mg/l)
139 DW 56/IN 04/IN 04A HISTORICAL ANALYTICAL DATA 2010 Annual Supply Well Sampling Hilmar Cheese Company Hilmar, California Total Dissolved Solids (TDS) (milligrams per liter) Chloride and Sodium (milligrams per liter) /1/2005 1/1/2006 1/1/2007 1/1/2008 1/1/2009 1/1/2010 Solids, total dissolved (mg/l) Chloride (mg/l) Dissolved Sodium (mg/l) 0
140 ATTACHMENT 5 DATA VALIDATION REPORT
141 Analytical Quality Assu rance Environmental & Chemistry Consulting Hilmar Cheese Company Hilmar, California Data Validation Report BSK Analytical Laboratories Work Order Numbers: AOL0875, AOL0996, AOLll 00 January 10,2011 Prepared for: Jacobson James & Associates, Inc Foothills Boulevard, Suite 370 Roseville, CA Prepared by: AQA Services 4005 Manzanita A venue, Suite 6, # 10 1 Carmichael, CA Manzanita Avenue, Suite 6 #101, Carmichael, CA fax: Printed on recycled paper
142 TABLE OF CONTENTS Introduction Table 1 Quality Assurance Review 1. Summary of Data Validation 2. Conclusions
143 Introduction This quality assurance review is based upon an examination of the data generated from the analyses of samples that were collected as part of the monitoring and sampling activities for the Hilmar Cheese Company Project located in Hilmar, California. The aqueous samples were collected on December 13, 14, and 15, 2010, by Jacobson James and Associates. The samples were submitted by Jacobson James and Associates to BSK Analytical Laboratories for analysis. This Level II review has been performed in accordance with the National Functional Guidelines for Inorganic Data Review (U.S. EPA, January 2010); and with guidance from the Region 9 Data Quality Indicator Tables for EPA Methods (U.S. EPA, November 1999), (U.S. EPA, March 2001), (U.S. EPA, March 2001), (U.S. EPA, August 1993), and (U.S. EPA, January 2000) and from the Region 9 Data Quality Indicator Tables for Standard Methods 2320 (U.S. EPA, November 1999). The Level II data deliverables were examined to determine the usability of the analytical results and compliance relative to requirements specified by the reported methodology. Where necessary, qualifier codes have been manually placed next to results in the database reports, so that the data user can quickly assess the qualitative and/or quantitative reliability of any result based on the criteria evaluated. This critical QA review identifies data quality issues for specific samples and specific evaluation criteria. The data qualifications allow the data end-user to best understand the usability of the analytical results. Data that have not been qualified in this report should be considered valid based on the QC criteria that have been applied.
144 TABLE 1 SAMPLES INCLUDED IN THIS QUALITY ASSURANCE REVIEW Sample Identification Laboratory Sample ID Laboratory Report Date Sampled Parameter(s) Examined OW-DW-53-A A0L A0L /13/2010 ALK, ANIONS, TDS, TKN OW-DW-53-A MS (Matrix Spike) OW-DW-53-AF MSD (Matrix Spike Duplicate) A0L MS A0L /13/2010 TKN A0L MSD A0L /13/2010 TKN OW-DW-53-AF A0L A0L /13/2010 As D, M D OW-DW-53-AF MS (Matrix Spike) OW-DW-53-AF MSD (Matrix Spike Duplicate) A0L MS A0L /13/2010 As D A0L MSD A0L /13/2010 As D OW-DW-69-A A0L A0L /13/2010 ALK, ANIONS, TDS, TKN OW-DW-69-A MS (Matrix Spike) OW-DW-69-A MSD (Matrix Spike Duplicate) A0L MS A0L /13/2010 ANIONS A0L MSD A0L /13/2010 ANIONS OW-DW-69-AF A0L A0L /13/2010 As D, M D OW-DW-34-A A0L A0L /13/2010 ALK, ANIONS, TDS, TKN OW-DW-34-AF A0L A0L /13/2010 As D, M D OW-DW-74-A A0L A0L /14/2010 ALK, ANIONS, TDS, TKN OW-DW-74-A (Laboratory Duplicate) A0L LD A0L /14/2010 TDS OW-DW-74-AF A0L A0L /14/2010 As D, M D OW-DW-74-AF MS (Matrix Spike) OW-DW-74-AF MSD (Matrix Spike Duplicate) OW-DW-74-B (Field Duplicate of OW-DW-74-A) OW-DW-74-BF (Field Duplicate of OW-DW-74-AF) A0L MS A0L /14/2010 As D, M D A0L MSD A0L /14/2010 As D, M D A0L A0L /14/2010 ALK, ANIONS, TDS, TKN A0L A0L /14/2010 As D, M D OW-DW-31-A A0L A0L /14/2010 ALK, ANIONS, TDS, TKN OW-DW-31-AF A0L A0L /14/2010 As D, M D OW-DW-29-A A0L A0L /14/2010 ALK, ANIONS, TDS, TKN OW-DW-29-AF A0L A0L /14/2010 As D, M D OW-DW-29-B (Field Duplicate of OW-DW-29-A) OW-DW-29-BF (Field Duplicate of OW-DW-29-AF) A0L A0L /14/2010 ALK, ANIONS, TDS, TKN A0L A0L /14/2010 As D, M D OW-DW-27A-A A0L A0L /14/2010 ALK, ANIONS, TDS, TKN OW-DW-27A-AF A0L A0L /14/2010 As D, M D OW-IN-4_and_ OW-IN-4A-A A0L A0L /14/2010 ALK, ANIONS, TDS, TKN
145 TABLE 1 (cont.) Sample Identification OW-IN-4_and_ OW-IN-4A-A LD (Laboratory Duplicate) OW-IN-4_and_ OW-IN-4A-A MS (Matrix Spike) OW-IN-4_and_ OW-IN-4A-A MSD (Matrix Spike Duplicate) Laboratory Sample ID Laboratory Report Date Sampled Parameter(s) Examined A0L LD A0L /14/2010 ALK A0L MS A0L /14/2010 TKN A0L MSD A0L /14/2010 TKN OW-IN-4_and_ OW-IN-4A-AF A0L A0L /14/2010 As D, M D OW-DW-58-A A0L A0L /14/2010 ALK, ANIONS, TDS, TKN OW-DW-58-AF A0L A0L /14/2010 As D, M D OW-DW-58-AF MS (Matrix Spike) OW-DW-58-AF MSD (Matrix Spike Duplicate) A0L MS A0L /14/2010 As D, M D A0L MSD A0L /14/2010 As D, M D OW-DW-60-A A0L A0L /14/2010 ALK, ANIONS, TDS, TKN OW-DW-60-AF A0L A0L /14/2010 As D, M D OW-DW-99-A A0L A0L /15/2010 ALK, ANIONS, TDS, TKN OW-DW-99-A MS (Matrix Spike) OW-DW-99-A MS (Matrix Spike Duplicate) A0L MS A0L /15/2010 TKN A0L MSD A0L /15/2010 TKN OW-DW-99-AF A0L A0L /15/2010 As D, M D OW-DW-25-A A0L A0L /15/2010 ALK, ANIONS, TDS, TKN OW-DW-25-A LD (Laboratory Duplicate) A0L LD A0L /15/2010 ALK, TDS OW-DW-25-AF A0L A0L /15/2010 As D, M D OW-DW-23-A A0L A0L /15/2010 ALK, ANIONS, TDS, TKN OW-DW-23-AF A0L A0L /15/2010 As D, M D OW-DW-24-A A0L A0L /15/2010 ALK, ANIONS, TDS, TKN OW-DW-24-AF A0L A0L /15/2010 As D, M D OW-DW-C-A A0L A0L /15/2010 ALK, ANIONS, TDS, TKN OW-DW-C-AF A0L A0L /15/2010 As D, M D OW-IW-04B-A A0L A0L /15/2010 ALK, ANIONS, TDS, TKN OW-IW-04B-AF A0L A0L /15/2010 As D, M D OW-DW-60-B (Field Duplicate of OW-DW-60-A) OW-DW-60-BF (Field Duplicate of OW-DW-60-AF) A0L A0L /14/2010 ALK, ANIONS, TDS, TKN A0L A0L /14/2010 As D, M D Notes: ALK - Alkalinity (Alkalinity, Bicarbonate, Carbonate, and Hydroxide) by Standard Method SM2320B. ANIONS - Chloride, Nitrate, and Sulfate by EPA Method As D - Dissolved Arsenic by EPA Method M D - Dissolved Metals (Ca, Fe, K, Mg, Mn, and Na) by EPA Method TDS - Total Dissolved Solids by Standard Method SM2540C. TKN - Total Kjeldahl Nitrogen by EPA Method
146 Quality Assurance Review This report summarizes the findings of the Level II data validation performed on the data for the fifty-four (54) samples (including field QC samples and laboratory QC performed on project samples) specified in Table 1. The samples were collected on December 13, 14, and 15, 2010, by Jacobson James and Associates as part of the monitoring and sampling activities for the Hilmar Cheese Company Project located in Hilmar, California. The samples were submitted to and analyzed by the BSK Analytical Laboratories in Fresno, California. The samples were collectively analyzed for Alkalinity (Total Alkalinity, Bicarbonate, Carbonate, and Hydroxide) by Standard Method SM2320B; Chloride, Nitrate, and Sulfate by EPA Method 300.0; Dissolved Arsenic by EPA Method 200.8; Dissolved Metals (Ca, Fe, K, Mg, Mn, and Na) by EPA Method 200.7; Total Dissolved Solids by Standard Method SM2540C; and Total Kjeldahl Nitrogen by EPA The parameters for the sample analyses are specified in Table 1. Each analytical method was reviewed in the following areas to determine any impact to data quality and usability. Data Completeness Analytical Holding Times and Sample Preservation Laboratory Blank Samples Laboratory Control Samples (LCS) Laboratory Duplicate Samples (LD) Matrix Spike/Matrix Spike Duplicate (MS/MSD) Samples Comparison of Field Duplicate Samples Compound Identification and Quantification Verification of EDD via Database Output 1.0 Summary of Data Validation This section presents results of the data validation of the aqueous samples with respect to each of the areas of data review listed above. Where appropriate, data have been qualified based on the guidance provided in the U.S. EPA National Functional Guidelines. These data qualifier flags indicate a bias in the reported data and should be considered during all project evaluations. 1.1 Data Completeness Thirty-eight (38) aqueous samples (including field duplicate sets) were submitted for analysis by Jacobson James and Associates. All sample analyses were performed as requested on the Chain-of-Custody Records (COCs) with the following notations. - As indicated in the Case Narrative of Laboratory Work Order A0L0875, the analyses for boron on samples OW-DW-53-AF, OW-DW-69-AF, and OW-DW-34-AF were canceled per the request of Jacobson James and Associates. Hillmar Cheese Company - DV Report #4 Page 1 AQA Services
147 - As documented by BSK personnel on the chain-of-custody in Laboratory Work Order A0L1100, samples OW-DW-60-B and OW-DW-60-BF were not recorded by the Jacobson James and Associates sampling team. According to the chain-of-custody, these samples and the associated analyses were added by laboratory personnel based on the sample containers received. Per request, the laboratory revised and reissued the report to document this in the Case Narrative. - For Laboratory Work Order A0L1100, the following issues were noted on the sample summary (page 30 of 36). Per request, the laboratory revised and reissued the report to correct these errors. For sample OW-DW-60-BF, the date sampled was reported as 12/15/2010 instead of 12/14/2010 as recorded on the associated chain-of-custody. For samples OW-DW-99-AF, OW-DW-25-AF, OW-DW-23-AF, OW-DW-24-AF, and OW-DW-C-AF, the date sampled was reported as 12/14/2010 instead of 12/15/2010 as recorded on the associated chain-of-custody. For samples OW-DW-60-B and OW-DW-60-BF, the Sample Descriptions were incorrectly recorded as OW-IW-60-B and OW-IW-60-BF. - For Laboratory Work Order A0L1100, BSK personnel did not indicate whether the samples were being received or relinquished on the chain-of-custody. For Laboratory Work Orders A0L0875 and A0L0996, BSK personnel did not indicate whether the samples were being received or relinquished on the chain-of-custody except on the final receipt by the laboratory. 1.2 Analytical Holding Times and Sample Preservation The samples submitted to the laboratory for analysis were properly preserved according to guidelines established by the U.S. EPA. All samples analyzed were analyzed within the recommended holding times for the applicable. 1.3 Laboratory Blank Samples Laboratory method blanks were analyzed with each batch of samples for all methods. All associated laboratory method blanks were free of contamination at or above the reporting limits. 1.4 Laboratory Control Samples/Laboratory Control Sample Duplicates (LCS/LCSD) LCS/LCSD were prepared and analyzed with each batch of samples for all appropriate methods. The LCS/LCD results (recoveries and RPDs) were within acceptance criteria for precision and accuracy established by the laboratory and the appropriate guidance documents. 1.5 Laboratory Duplicate (LD) Samples Project samples used for the LD analyses are delineated in Table 1. Acceptable precision was demonstrated by all project samples used for the LD analyses. Additional LD analyses were performed on non-project samples. Acceptable precision was demonstrated for all analytes by Hillmar Cheese Company - DV Report #4 Page 2 AQA Services
148 non-project samples used for LD analyses except one of the non-project samples used for the carbonate LD analyses. In the cases where non-project samples were used for the LD analyses, the assessment of precision was performed using the LCD/LCSD results. (See Section 1.4.) 1.6 Matrix Spike/Matrix Spike Duplicate (MS/MSD) Samples Project samples used for the MS/MSD analyses are delineated in Table 1. Since the source result exceeded 4-times the spike level, the MS/MSD analyses were not evaluated for the following analytes in the project samples listed below. Sample Laboratory Work Order Analyte OW-DW-74-AF A0L0996 Calcium Sodium OW-DW-58-AF A0L1100 Calcium Magnesium Sodium Acceptable precision and accuracy (Region 9 QC limits) were demonstrated by the project samples used for the MS/MSD analyses for all analytes except Total Kjeldahl Nitrogen in the MS/MSD analyses of samples OW-DW-53-A (51.5%), OW-IN-4_and_IN-4A-A (59.0%), and OW-DW-99-A (65.5%). The low average percent recoveries reported for Total Kjeldahl Nitrogen indicate a low bias. Consequently, the reported not-detected results for Total Kjeldahl Nitrogen in the associated samples (OW-DW-53-A, OW-DW-69-A, and OW-DW-34-A from Laboratory Work Order A0L0875; OW-IN-4_and_IN-4A-A from Laboratory Work Order A0L0996; and OW-DW-99-A, OW-DW-25-A, OW-DW-23-A, OW-DW-24-A, and OW-DW-C-A from Laboratory Work Order A0L1100) were qualified as estimated ( UJ - biased low). Similarly, the reported detection of Total Kjeldahl Nitrogen in sample OW-IW-04B-A from Laboratory Work Order A0L1100 was qualified as estimated with a low bias (J-). In addition, high relative percent differences were reported for Total Kjeldahl Nitrogen in the MS/MSD analyses of samples OW-IN-4_and_IN-4A-A (30%) and OW-DW-99-A (33%). Consequently, the reported detection of Total Kjeldahl Nitrogen in sample OW-IW-04B-A from Laboratory Work Order A0L1100 was qualified as estimated (J). Additional MS/MSD analyses were performed on non-project samples. Acceptable precision and accuracy were demonstrated for all analytes by all of the non-project samples used for MS/MSD analyses except for one of the non-project samples used for the chloride MS/MSD analyses and for one of the non-project samples used for the Total Kjeldahl Nitrogen MS/MSD analyses. In the cases where non-project samples were used for the MS/MSD analyses, the assessment of precision and accuracy were performed using the LCD/LCSD results. (See Section 1.4.) 1.7 Comparison of Field Duplicate Sample Results As delineated in Table 1, three sets of field duplicate samples were collected and submitted for Sample Points DW-74, DW-29, and DW-60. The results for the field duplicates are summarized in the following tables. The reported results for the field duplicate samples demonstrated acceptable Hillmar Cheese Company - DV Report #4 Page 3 AQA Services
149 precision (<20%) for all analytes except for nitrate in samples the field duplicate set for Sample Point DW-74; consequently, the reported results for nitrate in samples OW-DW-74-A and OW-DW-74-B were qualified as estimated (J) in accordance with data validation guidelines. Comparison of Field Duplicate Samples for Well DW-74 Analyte OW-DW-74-A//OW-DW-74-AF OW-DW-74-B//OW-DW-74-BF Alkalinity 220 mg/l 220 mg/l Bicarbonate 220 mg/l 220 mg/l Carbonate ND (3.0 mg/l) ND (3.0 mg/l) Hydroxide ND (3.0 mg/l) ND (3.0 mg/l) Chloride 92 mg/l 92 mg/l Nitrate 14 mg/l 18 mg/l Sulfate 53 mg/l 54 mg/l Total Dissolved Solids 600 mg/l 590 mg/l Total Kjeldahl Nitrogen ND (1.0 mg/l) ND (1.0 mg/l) Arsenic 3.7 µg/l 3.1 µg/l Calcium 83 mg/l 85 mg/l Iron ND (0.050 mg/l) ND (0.050 mg/l) Magnesium 24 mg/l 25 mg/l Manganese ND (0.010 mg/l) ND (0.010 mg/l) Potassium 3.7 mg/l 3.8 mg/l Sodium 69 mg/l 70 mg/l Comparison of Field Duplicate Samples for Well DW-29 Analyte OW-DW-29-A//OW-DW-29-AF OW-DW-29-B//OW-DW-29-BF Alkalinity 410 mg/l 440 mg/l Bicarbonate 410 mg/l 440 mg/l Carbonate ND (3.0 mg/l) ND (3.0 mg/l) Hydroxide ND (3.0 mg/l) ND (3.0 mg/l) Chloride 150 mg/l 160 mg/l Nitrate 36 mg/l 36 mg/l Sulfate 110 mg/l 120 mg/l Total Dissolved Solids 1,100 mg/l 1,100 mg/l Total Kjeldahl Nitrogen 1.1 mg/l 1.3 mg/l Arsenic 3.2 µg/l ND (2.0 µg/l) Calcium 180 mg/l 190 mg/l Iron ND (0.050 mg/l) ND (0.050 mg/l) Magnesium 49 mg/l 52 mg/l Manganese 0.53 mg/l 0.44 mg/l Potassium 3.0 mg/l 3.1 mg/l Sodium 96 mg/l 100 mg/l Hillmar Cheese Company - DV Report #4 Page 4 AQA Services