New Braunfels population growth ranks second in U.S. San Antonio Business Journal WHY ASR FOR NEW BRAUNFELS UTILITIES
|
|
|
- Jonah Burns
- 5 years ago
- Views:
Transcription

1

2 Discussion Outline Introduction Why ASR for NBU Phase 1 Feasibility Study TWDB Funding and Phase 2A Demonstration Program Coordination with EAA and Airport Conclusions Questions

3 New Braunfels population growth ranks second in U.S. San Antonio Business Journal WHY ASR FOR NEW BRAUNFELS UTILITIES 3
4 Water Demand, Supply and Variability Current Demand: Averages 11,000 12, 000 AFY (~10 mgd) New Braunfels: One of fastest growing cities in Texas/US Growth in Water Demand: Averages >4.5%/year Normal Year Supply: About 30,000 AFY (27 mgd) from 3 primary sources + Trinity Aquifer During Drought: Demand increases (14,000 AF in 2010/2011) Run of River supply is zero or nearly zero Canyon Lake supply is steady at 9,720 ac-ft/yr Canyon Lake supply can be reduced in drought worse than DOR Edwards Aquifer supply may be reduced to as low as 5,562 AFY with Stage IV restrictions Increase in demand due to growth reduces system reliability
5 NBU Water Supply Reliability During Extended Drought
6 NBU Monthly Water Demand Variability,


7 Water Available Even During Drought of Record Emphasizes the importance of storage to maximize system reliability

8 PHASE 1 FEASIBILITY STUDY 8

9 Scope of Work Task 1 ASR Workshop Task 2 Data Collection and Analysis Task 3 Feasibility Study Supply Alternatives, WQ and Demand Storage Requirements Hydrogeology in NBU Service Area Recharge Process and Potential Sites Conceptual Design and Cost Estimates Outline of Phase 2 Demonstration Program Regulatory/Legal/Environmental/Institutional Issues Final Report


10 ASR Applications from Workshop NBU s Ranking: Long-term supply during DOR conditions Deferring construction of second water treatment plant Meeting seasonal demands when EAA and TCEQ restrictions reduce supply; and meeting demands at the ends of distribution system (tie) Improving power efficiency by pumping at off-peak periods Emergency supply Kerrville, Texas San Antonio, Texas
11 System Stratigraphic Unit Hydrogeologic Unit Austin Chalk Upper Cretaceous Eagle Ford Group Buda Limestone Upper Confining Unit Del Rio Clay Georgetown Formation Person Formation Edwards Aquifer Basic Groundwater Kainer Formation Stratigraphy in New Braunfels Area Lower Cretaceous Upper Glen Rose Formation Lower Glen Rose Formation Hensel Sand Upper Trinity Aquifer Middle Trinity Aquifer Cow Creek Limestone Hammett Shale Sligo Formation Hosston Formation Lower Trinity Aquifer

12 Geologic Cross Section Through NBU Service Area
13 Important Hydrogeologic Characteristics for ASR Depth: Typically both construction and operational costs increase with depth Formation confinement: Well-confined zones improve containment of injected water Transmissivity: Higher transmissivity allows higher injection and recovery rates Water Quality: Fresh water means that native groundwater recovery is of less concern Storage in brackish aquifers is typically not a significant challenge if TDS < 5,000 mg/l
14 Summary of Storage Formation Characteristics in NBU Service Area Formation Approximate Well Depth (ft) Confinement Transmissivity Water Quality Brackish Edwards 1,000 Moderate Uncertain, likely high Brackish, ~4,000-5,000 mg/l Middle Trinity (Lower Glen Rose) 1,500 Moderate Moderate Typically Fresh, < 1,000 mg/l Lower Trinity (Lower Sligo) 2,000 High Uncertain, likely low to moderate Uncertain, likely brackish
15 Potential ASR Locations Selected at ASR Workshop
16 Feasibility Study Results With adequate ASR capacity and water volume stored, 100% system reliability can be achieved. ASR well capacity determined by recovery rate, not recharge rate. Increased peaking capacity (9 mgd) needed to meet repeat of the DOR Recharge capacity of approximately 4.0 mgd needed to meet projected demand
17 Feasibility Study Conclusions Adding WTP capacity (up to 10 mgd) does not significantly alter needed ASR recovery capacity Required storage volume to achieve 100% system reliability approximately 7,000 AF With buffer zone, TSV is approximately 14,000 AF A demonstration project in the brackish Edwards Aquifer near the New Braunfels Regional Airport is a logical next phase Additional model refinements are recommended in later phase so ASR capacity and storage volume can be confirmed

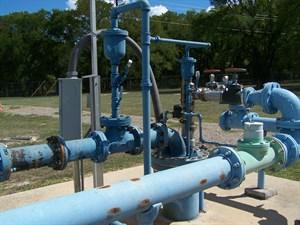
18 Brackish Edwards Aquifer

19 Why Brackish Edwards Aquifer? Most viable local aquifer In area of growing NBU demand Access to 18-inch and 12-inch treated water pipelines Top confining layer: 500 feet Estimated well depth: 1,000 feet Distance from Comal Springs No danger to ground surface Acceptable to Edwards Aquifer Authority (EAA) 19


20 TWDB FUNDING PROGRAM FOR PHASE 2A 20
21 TWDB Funding Background 84 th Texas Legislature, 2015, House Bill 1, Rider 25 $1,000,000 from the General Revenue Fund Demonstration projects or feasibility studies: Prove up aquifer storage and recovery Use of innovative storage approaches that improve operational efficiencies Provide cost-effective and regional water supplies Applicants and/or their partner organizations required to provide matching funds Applicants had to be groundwater conservation districts Request for application notice September 22, 2015 Application deadline November 3, 2015 Grant approval January 7, 2016
22 Six applications received Three grants awarded Application Summary Recipient Funding Total Requested Awarded Edwards Aquifer Authority/NBU $563,000 $281,500 $281,500 Victoria County Groundwater Conservation District/City of Victoria Corpus Christi Aquifer Storage and Recovery Conservation District $570,226 $285,112 $285,112 $1,000,000 $500,000 $433,388

23 Demo Project Scope of Work 1. Coordination with TCEQ 2. Coring design 3. Wireline coring and analysis 4. Monitor well design 5. Monitor well construction and data collection 6. Final reports and presentations


24 Core Hole and Monitor Well Wireline Coring Geotechnical analysis Stratigraphy confirmation 2 ¾ inch diameter cores Approx 1,000 ft deep Closed after completion Monitor Well No. 1 Water quality data 4 to 6 inch diameter Approx 1,000 ft deep 24
25 COORDINATION WITH NEW BRAUNFELS REGIONAL AIRPORT AND EAA 25
26 Coordination Steps New Braunfels Airport Approvals from City and Airport Advisory Committee Submittal of applications to TXDOT and FAA Approval from TXDOT Aviation and FAA Edwards Aquifer Authority Memorandum of Understanding Interlocal Agreement serves as permit for ASR Project in brackish Edwards Aquifer 26

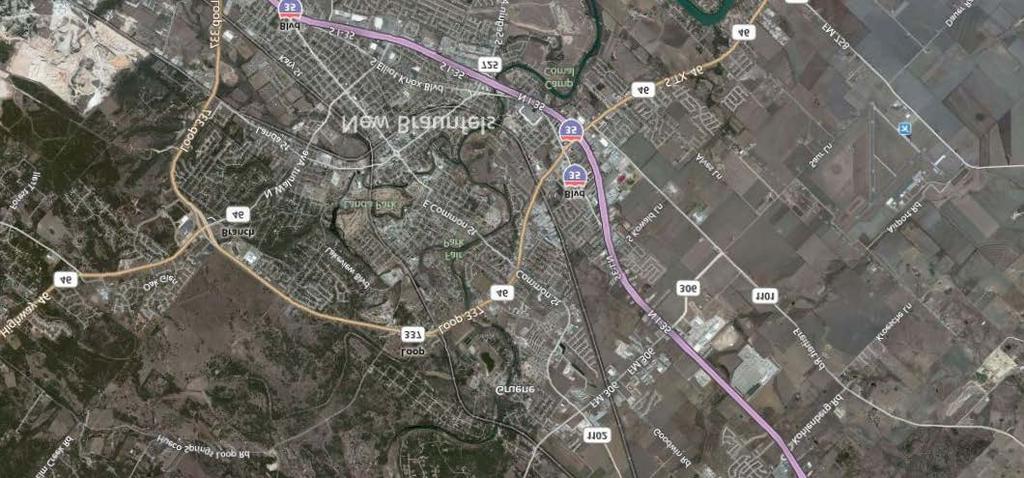
27 New Braunfels Regional Airport 27

28 ASR Well Layout at Airport 28


29 CONCLUSIONS 29
30 A Phased Approach for NBU Phase 1 Feasibility Study Phase 2 A ASR Demonstration Program Funding support from TWDB Major tasks: Wireline Coring Monitoring Well Phase 2 B ASR Demonstration Program TCEQ Class V permit Full scale ASR well with temporary facilities Cycle testing Phase 3 ASR Wellfield Expansion Full scale ASR well with permanent facilities Additional ASR wells Additional monitor wells 30
31 Estimated Capital Costs 3/27/2015 Cost Estimate Summary New Braunfels Utilities ASR Project Item Estimated Cost Connection Pipelines $432,000 ASR Wells ( 9 ASR and Monitoring) $14,850,000 Site Improvements $169,931 SCADA $180,000 Total Capital Cost $15,631,931 Contingency (25%) $3,907,983 Engineering and Permitting (15%) $2,344,790 Environmental and Archaeology $100,000 Land Acquisition and Access $156,600 Interest During Construction (1 year) $623,000 Total Project Cost $22,764,303


32 Marginal Costs for ASR Recharge Marginal costs: power, chemicals, residuals disposal Estimated cost for producing, treating and pumping water for ASR storage during off-peak periods: $0.19 per thousand gallons ($62/ac-ft) Cost of storing 7,000 ac-ft = $434,000


33 Questions?

34