CCS Strategy & Activities
|
|
|
- Wesley Reynold Charles
- 5 years ago
- Views:
Transcription

1 GeoCapacity project Conference Copenhagen October 2009 CCS Strategy & Activities Professor Niels Peter Christensen Chief geologist Vattenfall Vattenfall A/S

2 Why CCS? Fossil fuels today provide about 80% of the global energy consumption og 2/3 of the power generation. Renewable energy is projected to become increasingly important but must be supplemented by other measures to ensure early and sufficient CO2 reductions. Hydro 17% Global power generation (%) Nuclear 17% Wind & bio < 2% China installs 1700 MW coal power weekly Capacity for new-build wind is 400 MW per week Fossil 64% CCS is an important part of the portfolio of reduction measures required to keep global warming below 2 degrees. Vattenfall A/S

3 CCS delivers 1/5 of the lowest-cost GHG reduction solution in 2050 Vattenfall A/S
4 The Vattenfall CO 2 vision making electricity clean CO 2 neutral energy production Vattenfall Nordic by 2030 (Denmark, Sweden, Finland) Vattenfall Europe (Germany, Poland) - 50% reduction by CO2 neutral by 2050 Vattenfall Netherlands yet to be defined Current emissions of CO 2 are about 95 million tonnes p.a. Vattenfall A/S


5 Vattenfall CCS roll-out Pilot plant Schwarze Pumpe Target: Reducing energy penalty Technology commercial by 2020 Capture cost of 20 /t Demo plant Jänschwalde Magnum NJV3 Moorburg Polish PP Vattenfall A/S


6

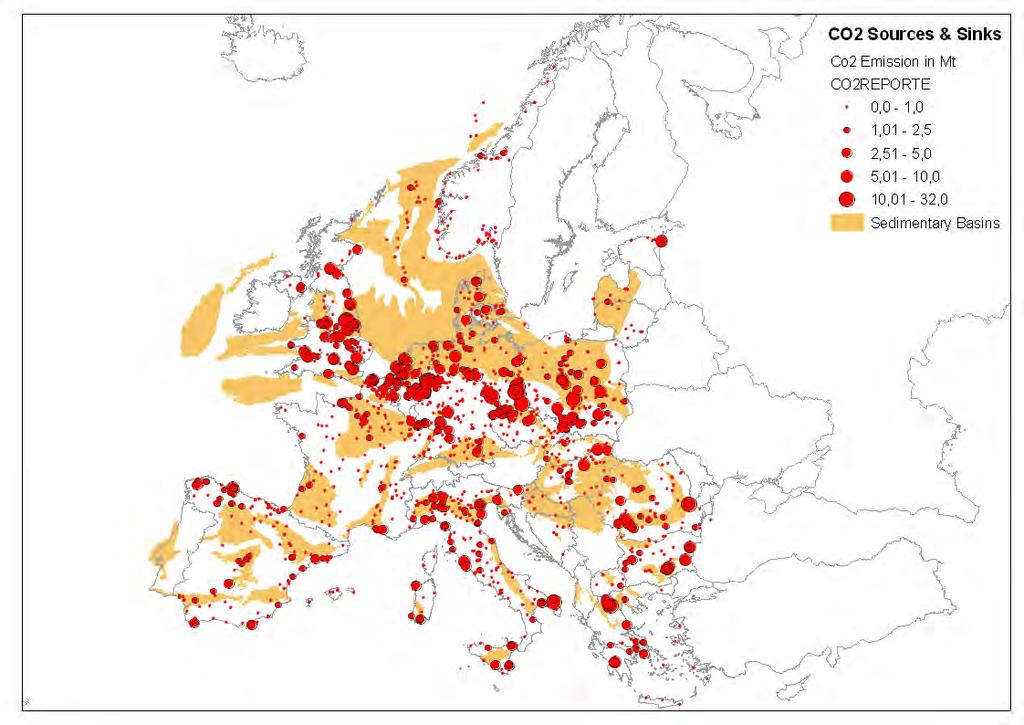
7 Assessing European Capacity for Geological Storage of Carbon Dioxide North East Europe 7


8 Ketzin pilot CO 2 storage project Start of injection on 30 June tonnes stored by 18 October 2009 Vattenfall A/S

9 CCS development projects The Norwegian Sea Power Plant CO 2 Storage Ketzin Pilot Aalborg Vedsted NJV3 Magnum? Moorburg Altmark Schwarze Pumpe Birkholz Neutrebbin?? Birkholz Jänschwalde Vattenfall A/S

10 Vattenfall A/S Oxyfuel combustion capture
 CO2 plant 2x180m³ CO2 tanks Vattenfall A/S 02.11.")
11 Oxyfuel pilot plant at Schwarze Pumpe ESP Boiler house Cooling tower FGD FG- Cond. Air separation unit (ASU) CO2 plant 2x180m³ CO2 tanks Vattenfall A/S fossil not fossils Wolfgang Dirschauer 11 Switchgear building

12 Jänschwalde Power Plant: oxyfuel demo Post Combustion New Oxyfuel Boiler with pre-dried Lignite Air Separation Unit Vattenfall A/S fossil not fossils Wolfgang Dirschauer 12


13 Aquifer storage options Demo Plant Jänschwalde Vattenfall A/S


14 Altmark Option: Storage in depleting gas field Estimated storage capacity at Altmark: 508 mega tonnes Distance: 300+ km Transport by tanker truck or pipeline PP Vattenfall A/S

15 Vattenfall A/S Power and Heat Plant Moorburg in Hamburg

16 Reinforcement Works for Bottom Plate Vattenfall A/S

17 Flood Protection at Residual Branch of Alte Süderelbe Vattenfall A/S


18 The CCS Denmark project Highly efficient coal-fired power block: 47% efficiency, 411 MW e Post-combustion capture 1.8 million tonnes of CO 2 per annum Nordjyllandsværket by the city of Aalborg Vattenfall A/S

19 Vattenfall A/S Post-combustion capture of CO 2

20 Meeting with GFZ Potsdam 11 June 2008 Investigation of the geological structure at Vedsted, North Jylland Denmark By: K. Zinck-Jørgensen Representing: GFZ, Shell, SLB and GEUS Niels Peter Christensen - chief geologist Vattenfall Nordic Professor in CO 2 storage at Heriot-Watt University Skotland


21 Depth-structure map of 2 potential storage reservoirs Figur fra GEUS Figur fra GEUS

22 Cross-section through the Vedsted geological structure Storage must be at least 700 meters deep to ensure CO 2 to be in supercritical state Vedsted-1, Oil exploration well from 1958 CO 2 in fluid form is pumped into the well Haldager-1, Oil exploration well from 1950 CO 2 is stored in porous Sandstones covered by thick sections of impermeable claystones -1 km Porous sandstone -2 km -3 km Cross section courtecy of GEUS


23 Vattenfall A/S Regional seismic mapping


24 Vattenfall A/S The storage structure
25 NJV3 today: Business-as-usual Fossil CO 2 : 1,8 million tonnes GWh Electricity t Coal TJ Heat Vattenfall A/S

 CO 2 : -0,5")


26 NJV3 by 2013: 30% biomass t Biomass Fossil (net) CO 2 : -0,5 million tonnes GWh Electricity 2,0 million t CO 2 storage ton Coal TJ Heat Vattenfall A/S

27 Vattenfall A/S Combining CO 2 storage with geothermal heat


28 Timeline Seismic exploration permit Regional mapping 2008 (2D seismic) Apply for appraisal permit 2010 Local mapping (2D & 3D seismic) Drill to test structure 2010 Decision to develop site 2014 Apply for development permit 2015 Build capture plant and pipeline Capture & store CO Vattenfall A/S
29 Thank you By: K. Zinck-Jørgensen Representing: GFZ, Shell, SLB and GEUS

30 CO 2 becoming immobilised over time Source: Vattenfall A/S UN special report on CCS