AAPL 2011 Texas Land institute September 13, Christopher B. McGill Managing Director, Policy Analysis
|
|
|
- Evan Hodges
- 5 years ago
- Views:
Transcription


1 AAPL 2011 Texas Land institute September 13, 2011 Christopher B. McGill Managing Director, Policy Analysis 0

2 Natural Gas Production Monthly
3 2011 Daily Dry Natural Gas Production (after extraction losses) Bcf per day Jan 2011 Jun 2011 Dec 2011 Source: Bentek Energy LLC, Energy Market Fundamentals, August 16, 2011.
4 Comparisons of January 2006 vs. January 2011 Residential Gas Bills and Prices Illinois Massachusetts 2006 Residential Price $13.64 $ Residential Price* $8.08 $ Gas Bill $ $ Gas Bill* $ $ *Estimated, based on regional EIA short term forecasts, historical data, and heating degree days. Source: Energy Information Administration 3
5 Comparisons of Residential Gas Bills Using January 2006 and January 2011 Prices and January 2011 Consumption Levels Illinois Massachusetts January 2011 Gas Bill Using $ $ January 2011 Residential Prices January 2011 Gas Bill Using $ $ January 2006 Residential Prices Savings Due to Lower Prices $ $
6 U. S. Natural Gas and Crude Oil Prices $ per MMBtu Natural Gas Henry Hub Spot Crude Oil WTI Spot Source: Energy Information Administration, U.S. DOE. 5
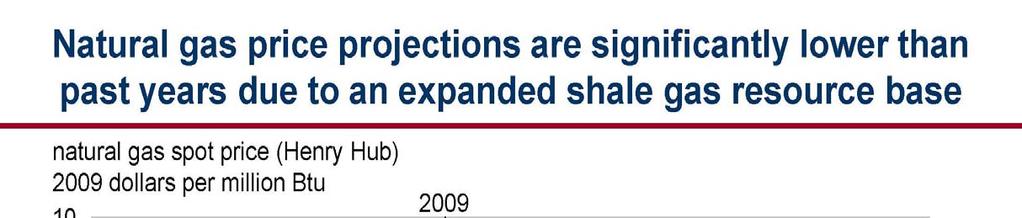
7 U. S. Natural Gas Prices dollars per thousand cubic Henry Hub spot price Composite wellhead price Forecast Jan 2007 Jan 2008 Jan 2009 Jan 2010 Jan 2011 Jan 2012 Source: Short-Term Energy Outlook, August

8 The Politics of Energy: Natural Gas Job Creation 200,000 Direct, Indirect and Induced Jobs Created by Natural Gas Extraction Growth since 2007 Source:Timothy Considine, Robert W. Watson and Nicholas B. Considine, The Economic Opportunities of Shale Gas Development, Manhattan Institute, May

9 WAVE, GOODBYE, TO WHERE WE HAVE BEEN Source: American Association of Petroleum Geologists.

10 WAVE, HELLO, TO WHERE WE ARE GOING Source:

11 Marketed Natural Gas Production Source: Energy Information Administration.

12 Hydraulic Fracturing Source: American Petroleum Institute. 11

13 Hydraulic Fracturing Treatment Woodford Shale, Canadian County, Oklahoma Source: JPTOnline, Society of Petroleum Engineers.
14 US Shale Gas Production Navigant Consulting Billion Cubic Feet per day est 13

")
15 U.S. Dry Natural Gas Reserves ( ) Trillion cubic Feet Source: Energy Information Administration. Data source: Potential Gas Committee (2009) 14

16 Energy Information Administration Reserves and Production of Dry Natural Gas in the United States (TCF) EIA Dry Gas Year Reserves Production

17 Shale Basins and the U.S. Pipeline Grid Source: American Clean Skies Foundation. 16


18 PGC Resource Assessments, Total Potential Gas Resources (mean values) Data source: Potential Gas Committee (2009)

19 Potential Gas Committee Determination of Future Supply of Natural Gas in the United States (TCF) DOE Traditional Coal Future Cumulative Ultimate Reserves + Resources + Gas = Supply + Production = Resource , , , , , , , , , , , , ,314 1,013 2, ,312 1,053 2, , ,532 1,091 2, , ,074 1,132 3, , ,170 1,176 3,347
 2008 EIA AEO 2,119 USA 347 2009 EIA AEO 2,620 USA 818 2009 ADV Res 13,231 World 6,622 Total World Production")
20 Additional Natural Gas Resource Assessments (Tcf) (including proved reserves) Total Year Source Resource Est. Area/Shale (Tcf) 2008 EIA AEO 2,119 USA EIA AEO 2,620 USA ADV Res 13,231 World 6,622 Total World Production about 107 Tcf Annually 19
21 Industry Critical Practices and Technology Opportunities Reduce Land Footprint Water Management Fugitive Air Emissions Well Integrity Best Practices Fracture Fluid Chemistry Incident Response Basin Specific Baseline Data Acquisition 20
22 NORTH AMERICA LNG IMPORT CAPACITY 2010 Everett, MA Bcfd Cove Point, MD Bcfd Elba Island, GA Bcfd Lake Charles, LA Bcfd Gulf Gateway, LA Bcfd Northeast Gateway, MA Bcfd GDF Suez-Neptune, MA Bcfd Freeport, TX Bcfd Sabine, LA Bcfd Hackberry, LA Bcfd ` Other North America Bcfd Total Bcfd Source: Federal Energy Regulatory Commission


23 Daily Natural Gas Consumption by Sector January 1 December 31, May Jul Sep Nov Jan Source: Bentek Energy LLC, Energy Market Fundamentals, December 31, Pwr Gen Industrial Res/Com Bcf per day Mar


24 Daily Natural Gas Consumption Power Genration January 1 July 22, Jan Apr Sep Source: Bentek Energy LLC, Energy Market Fundamentals, July 22, Bcf per day Feb Mar Apr May Jun Jul Aug Sep Oct Nov Dec


25 Other nations are realizing the potential of natural gas vehicles and moving forward. North America 120,000 NGVs Europe 1,300,000 NGVs Asia 1,300,000 NGVs South America 4,200,000 NGVs Africa 122,000 NGVs There are over 12 million natural gas vehicles on the road worldwide but less than 120,000 are in the United States. 24
26 Infrastructure: Refueling stations Natural Gas Refueling Stations (in operation as of 12/31/2010) RI 5 MA 22 CT 15 DE 1 DC 2 MD stations Source: 50 or more 25
27 Building Blocks to a National Strategy: Natural Gas as a Transportation Fuel Rail Marine Passenger vehicles Off-road and Non-road Diesel Long Haul Trucking Medium and Heavy Duty Refueling Infrastructure Return to Base Fleets Light, Medium, and Heavy Duty e.g. city buses, refuse trucks, private delivery fleets, taxis Today Near-term Midterm Longterm 26
28 OEM Outreach Committee On going conversations with automakers including Honda, Ford, GM, Chrysler, and Mercedes about natural gas vehicles and opportunities in the North American market. Completing a survey of participating AGA and ANGA member companies on anticipated fleet purchases that could be filled by natural gas offerings. Negotiating an agreement with an automotive contractor, the Car Lab, to complete four conversions to bi fuel CNG/gasoline vehicles and complete initial testing of the vehicles. Continuing discussions with Mercedes to direct a demonstration program of thirty E Class bi fuel vehicles. 27


29 Natural gas vs conventional gasoline Seattle CNG - $1.60 Gas - $3.79 On average, CNG costs 47% less than gasoline San Francisco CNG - $2.44 Gas - $3.89 Los Angeles CNG - $2.74 Gas - $3.81 Salt Lake City CNG - $1.26 Gas - $3.37 Denver CNG - $2.50 Gas - $3.45 Omaha CNG - $1.93 Gas - $3.68 Nashville CNG - $1.63 Gas - $3.59 Detroit CNG - $1.94 Gas - $3.78 New York CNG - $2.70 Gas - $4.03 Wash., DC CNG - $2.40 Gas - $3.94 San Diego CNG - $2.89 Gas - $3.80 Dallas CNG - $2.49 Gas - $3.65 Atlanta CNG - $2.34 Gas - $3.72 Ft. Lauderdale CNG - $2.19 Gas - $3.77 Source: CNG prices captured in July 2011 by CNGPrices.com Gas prices reflect city average on July 20 from GasBuddy.com 28
30 Recurring Natural Gas Energy Themes Market Stability Resource Abundance with Development Challenges Seasonal, Peak Month and Peak Day Reliability Political, Policy and Regulatory Uncertainty 29
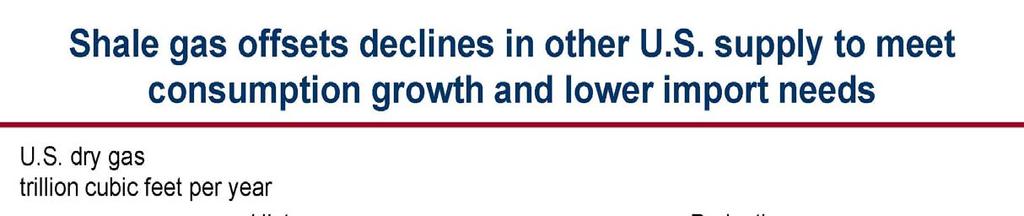
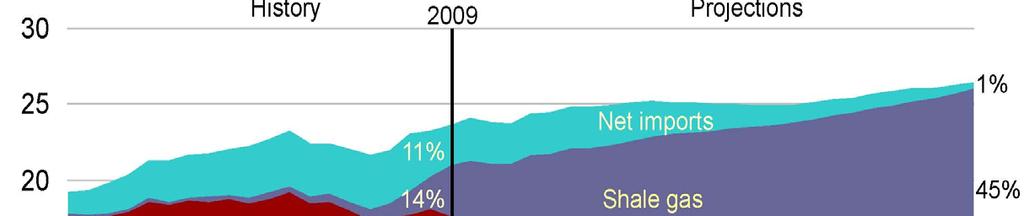
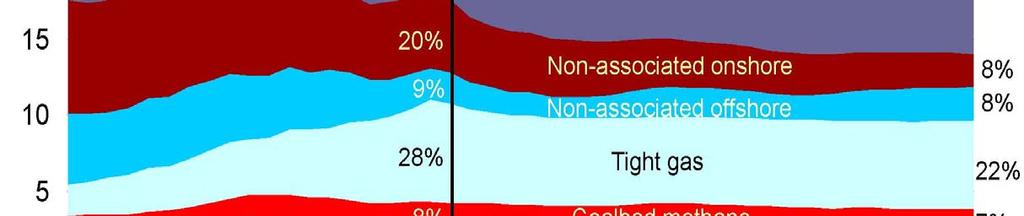
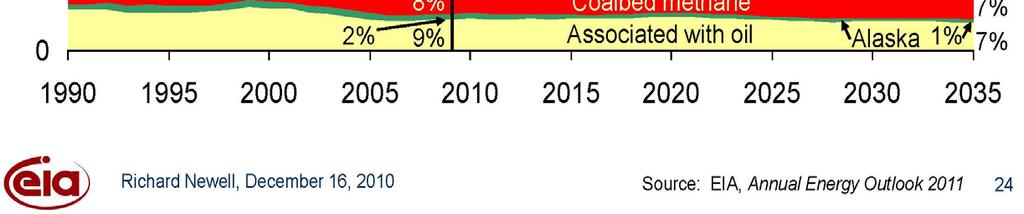
31 Natural Gas Production Outlook EIA/Annual Energy Outlook
32 31
33 32
34 Christopher B. McGill Managing Director, Policy Analysis 33