SERVICING AND STORM WATER MANAGEMENT REPORT
|
|
|
- Bennett Gaines
- 5 years ago
- Views:
Transcription

1 The Odan/Detech Group Inc. P: (905) F: (905) SOUTH SERVICE ROAD, UNIT 107 BURLINGTON, ONTARIO, L7L 5K2 PROPOSED BANK PLACE D ORLEANS MALL OTTAWA, ONTARIO SERVICING AND STORM WATER MANAGEMENT REPORT Prepared For: PRIMARIS MANAGEMENT INC. June 2016 REVISED September 14 th, 2016
2 PROPOSED BANK PLACE D ORLEANS, OTTAWA SERVICING & STORM WATER MANAGEMENT REPORT i TABLE OF CONTENTS DESCRIPTION page 1.0 BACKGROUND SCOPE OF WORK DESIGN CONSIDERATIONS... 2 A) Sanitary Waste Water Disposal... 2 B) Water Distribution... 5 C) Stormwater Management CONCLUSIONS Note: This report should be read in conjunction with the Site Servicing & Grading Plans prepared by The Odan/Detech Group Inc. APPENDIX A Aerial Photo of Site Site Plan prepared by SMV Architects Inc. APPENDIX B Sanitary Flow Calculation from Site Fire flow calculation City of Ottawa Water Boundary Conditions Proposed Sanitary Sewer Design Sheet APPENDIX C Pre-Development Storm Drainage Plan Post-Development Storm Drainage Plan Pre-Development Visual OTTHYMO Model Output Post-Development Visual OTTHYMO Model Output Detailed Stage/Storage/Discharge relationship for proposed 75mm orifice Place D Orleans existing Site Servicing Plan
3 PROPOSED BANK PLACE D ORLEANS, OTTAWA SERVICING & STORM WATER MANAGEMENT REPORT BACKGROUND The property under study is a portion of the existing Place D Orleans Shopping Mall located at the south west corner of the Mall nearest the intersection of the Place D Orleans and St. Joseph Blvd. It is proposed to add a CRU to this section of existing parking area. Refer to the Architectural site plan (Appendix A) for further information regarding the proposed layout of the site including building location, asphalt and concrete curbing etc. This report will evaluate the serviceability of the site with respect to sanitary, water and storm services and also evaluate the stormwater management (SWM) strategy that will be implemented to meet the City standards. 2.0 SCOPE OF WORK The Odan/Detech Group Inc. was retained by the Owner, Primaris Management Inc., to review the site, collect data, evaluate the site for the proposed land use and present the findings in a servicing and stormwater management report. The scope of work in brief involves the following: a) Field work to establish existing features and elevations on the site. b) Review a soils report to establish the suitability of the proposed development. c) Collecting existing servicing drawings from the City of Ottawa and governing agencies in order to establish availability and feasibility of site servicing. d) Meetings/conversations with the City of Ottawa and RVCA. e) Evaluation of the data. If suitable, make recommendations on how to best utilize the site. f) Prepare a design brief and final design drawings.
4 PROPOSED BANK PLACE D ORLEANS, OTTAWA SERVICING & STORM WATER MANAGEMENT REPORT DESIGN CONSIDERATIONS A) SANITARY WASTE WATER DISPOSAL There are multiple sanitary sewer outlets for the existing Place D Orleans Mall. Currently the site has an existing sanitary sewer outlet that discharges to the west of the existing Mall at Place D Orleans Drive which continues easterly to Rocque Street. An additional outlet for the Mall is located at the north east corner of the development. This discharges to Place D Orleans and continues to the north where it crosses Regional Road 174. As discussed with the City of Ottawa, the proposed new Retail Bank will not connect to either of the existing systems internally. This is due to the length of service required from the Bank to the existing internal sanitary sewer located on the west side of the site. As discussed with Engineering the proposed Bank will be serviced from St. Joseph s Blvd. to the south. Significant sanitary flows are not expected to be generated from the Bank. The sanitary sewer located on St. Joseph s Blvd. is a 250mm dia. sanitary sewer flowing westerly. Expected sanitary flows from the proposed Bank are shown as follows in Table 1. Refer to the following page for detailed sanitary calculations. Detailed sanitary unit flow statistics are provided in Appendix 4-A of the City of Ottawa s Sewer Design Guidelines (2012). Appendix 4-A.3 states that places of employment (which the proposed bank is most characteristic of) generate 75 L/day/employee. The City s Sewer Design Guidelines, Figure 4.3, states that the peaking factor to use for all commercial land uses is 1.5. It was assumed in calculations that the bank s population will be 24 people. Figure 4.3 of Ottawa s Sewer Design Guidelines manual further states that the infiltration allowance should be 0.28 L/s/ha for areas with separated sewer systems. The site area for infiltration is taken as the limits of construction within the existing mall (Refer to the Site Servicing Plan), which is Ha. Table 1 Calculated Sanitary Sewage Flows for Commercial Development From Land Use (L/s) Proposed From Infiltration (L/s) Total (L/s) Proposed Bank It is proposed to construct a new internal 150mm and 200mm sanitary sewer to connect to the existing 250mm municipal sanitary sewer beneath St. Joseph Boulevard to the south. Refer to the Site Servicing Plan for the layout. A sanitary sewer design sheet is provided in Appendix B. It is apparent that the proposed sewer will be flowing well within it s capacity based on the proposed flows.

5 PROPOSED BANK PLACE D ORLEANS, OTTAWA SERVICING & STORM WATER MANAGEMENT REPORT 3

6 PROPOSED BANK PLACE D ORLEANS, OTTAWA SERVICING & STORM WATER MANAGEMENT REPORT 4 The above sanitary flows can be closely compared to the flows below which are derived from the Ontario Building Code section B based on type of use. The total flow calculated using the O.B.C. is 0.07 l/sec. Both methodologies derive similar results for sanitary discharge rates.
7 PROPOSED BANK PLACE D ORLEANS, OTTAWA SERVICING & STORM WATER MANAGEMENT REPORT 5 B) WATER DISTRIBUTION There is an internal looped water main which services the existing Place D Orleans Mall. This water main is serviced from Place D Orleans west side and from St. Joseph s Blvd. to the south east. It is proposed to provide a new domestic water service to the proposed Bank from the water main located within the City R.O.W. on Place D Orleans. The building will not be sprinklered. Fire service will be provided by an existing hydrant to the northwest of the proposed bank. The pressures and volumes must be sufficient for Peak hour conditions and under fire conditions as established by the Ministry of Environment and the Fire Underwriters Survey booklet (1999). The minimal residual pressure under fire conditions is 140 kpa (20.3 psi). According to the MOEE criteria the allowable pressures are as follows: Condition Allowable Pressures (kpa) min. max. 1) Min. Hour 275 (40psi) 700 (101psi) 2) Peak Hour 275 (40 psi) 700 (101 psi) 3) Peak Day + Fire Flow 140 (20 psi) 700 (101 psi) The domestic water demand of the proposed Bank is as follows: a) Average Day domestic demand 0.03 L/s b) Peak day demand x daily demand 0.05 L/s c) Peak hour demand x daily demand 0.05 L/s d) Fire flow for retail space as per FUS 1999 manual 50 L/s The fire flow demand calculation can be found in Appendix B. Table 2 is a summary of the total water demand for the proposed Bank. Table 2 Total Water Demand for Proposed Bank L/s USGM Peak Day Demand Fire Flow Demand Total Water Demand
8 PROPOSED BANK PLACE D ORLEANS, OTTAWA SERVICING & STORM WATER MANAGEMENT REPORT 6 The water boundary conditions were provided by the City of Ottawa using the water demand and fire flow demand of the proposed Bank. The head at the connection point of the analysis using the maximum day and fire flow demand of the proposed store is 108.5m at a pressure of 60.9 psi. The water boundary report is found in Appendix B.
9 PROPOSED BANK PLACE D ORLEANS, OTTAWA SERVICING & STORM WATER MANAGEMENT REPORT 7 C) STORM WATER MANGEMENT: The larger commercial development (Place D Orleans Mall) of which the proposed commercial building (RBC Bank) is part presently drains via two storm service connections. The subject proposed bank building is located within the tributary catchment area of an existing 1050mm at 0.52% storm service connection near the site s western border. This existing storm sewer connection drains to an existing municipal storm sewer which commences at the discharge point of the subject storm sewer connection, crosses beneath Promenade Place D Orleans Drive to the west and flows westerly beneath Rocque Street to the west. TABLE 3 Existing Site Storm Service Connections Subject Development Catchment ID EX-A (Existing) A, B, C (Proposed) Location Downstream of EX CBMH 1 Ex Controls None Existing Specifications 1050mm at 0.52% Capacity 1969 L/s Receiving Municipal Storm Sewer Ex STM Sewer Promenade Place D Orleans/Rocque St There are no existing stormwater management controls implemented in the existing storm drainage system. It is not within the scope of the proposed retail pad construction to implement stormwater management controls for the entire development, however controls will be provided as practical where modifications to the existing system are proposed such that controls are provided for a 5-year storm event. Beyond a 5-year storm, runoff will overflow to the Right of Way by the major overland flow route shown on the Grading Plan. The existing internal storm sewer network, storm service connection and receiving municipal storm sewer appear on the Site Servicing Plan (drawing 1 of 2). Also refer to the Place D Orleans Centre Site Servicing Plan in Appendix C. The proposed development falls within the tributary catchment area of one upstream branch of this existing storm service connection, referred to here as EX-A. The differential impact of the proposed development on this tributary catchment area by the proposed stormwater controls is quantified as follows. Design storm data for the City of Ottawa 5-year and 100-year storms are shown below. I 5 = / ( t) I 100 = / ( t) When time of concentration, t, is 10 minutes, the 5-year and 100-year rainfall intensities are as follows. I 5 =104.4 mm/hr I 100 = mm/hr
10 PROPOSED BANK PLACE D ORLEANS, OTTAWA SERVICING & STORM WATER MANAGEMENT REPORT 8 i) Pre-Development Release Rate The proposed bank and it s associated parking lot reconstruction is located within existing catchment area EX-A, which currently drains to EX CB 4. There are no existing quality or quantity controls. Refer to the Pre-Development Storm Drainage Plan in Appendix C for the extents of the existing catchment area, which is described as follows. TABLE 4 Existing Catchment Area Existing Catchment ID Proposed Catchment ID Ex. Area (ha) Catchment Surface Receiving Structure Ex. SWM Controls EX-A A,B,C Asphalt Ex CB 4 None Downstream Outlet Ex. 1050mm STM Service to west The existing peak runoff rate in 5-year and 100-year storms from the catchment area impacted by the proposed development is calculated as follows. Refer to the Pre-Development Storm Drainage Plan in Appendix C for the catchment areas. TABLE 5 Pre-Development Runoff Rate (Q=2.78CiA) Intensity (mm/hr) (t = 10 min) Q = 2.78 CiA ( l/s ) Existing Catchment Proposed Catchment Ex. Area (ha) C 5-Year 100-Year 5-Year 100-Year EX-A A,B,C Total Area (C=1.00 in 100Y STM) L/s L/s Further, the 5-year and 100-year pre-development runoff rates are calculated as follows using a Visual OTTHYMO Model. Refer to the pre-development model (below) and output in Appendix B. TABLE 6 Pre-Development Runoff Rate (Visual OTTHYMO) Existing Catchment Proposed Catchment Ex. Area (ha) Method % imperv % imperv directly connected Q ( l/s ) 5-Year 100-Year EX-A A,B,C StandHYD 90% 90% 77 L/s 135 L/s 1 Catchmt EX-A AREA = Y Disch Rate PeakFlow = 0.077
11 PROPOSED BANK PLACE D ORLEANS, OTTAWA SERVICING & STORM WATER MANAGEMENT REPORT 9 ii) Post-Development Catchment Areas The post-development catchment areas into which the existing catchment area (EX-A) will be divided are as follows. Refer to the Post-Development Storm Drainage Plan in Appendix C for the catchment areas. Tables 7 and 8 provide the detailed statistics and drainage conveyances and stormwater management controls applied to each of the proposed catchment areas. TABLE 7 Post-Development Catchment Areas and Descriptions Watershed Description Area (ha) % imperv % imperv directly connected Imperv Length(m) perv imperv Losses perv Catchment A Parking SEE INPUT STANDHYD SCS Catchment B Prop Bank Roof SEE INPUT STANDHYD SCS Catchment C Parking SEE INPUT STANDHYD SCS Total Site Catchment Area The above catchment area statistics appear in the Visual OTTHYMO Model, below, and postdevelopment output in Appendix C. The downstream conveyances, controls and storage associated with each catchment area are as follows. TABLE 8 Post-Development Catchment Areas and Conveyances Watershed Description Ex. Area (ha) Prop. Area (ha) Drainage Conveyances, Controls & Storage Catchment A Prop CBMH 2; EX STM CBMH Catchment B Controlling Roof drains; Prop CBMH 2 (EX-A) Catchment C Prop STM CB 2 (Prop 75mm orifice); CBMH 2 Total Site Catchment Area 0.285
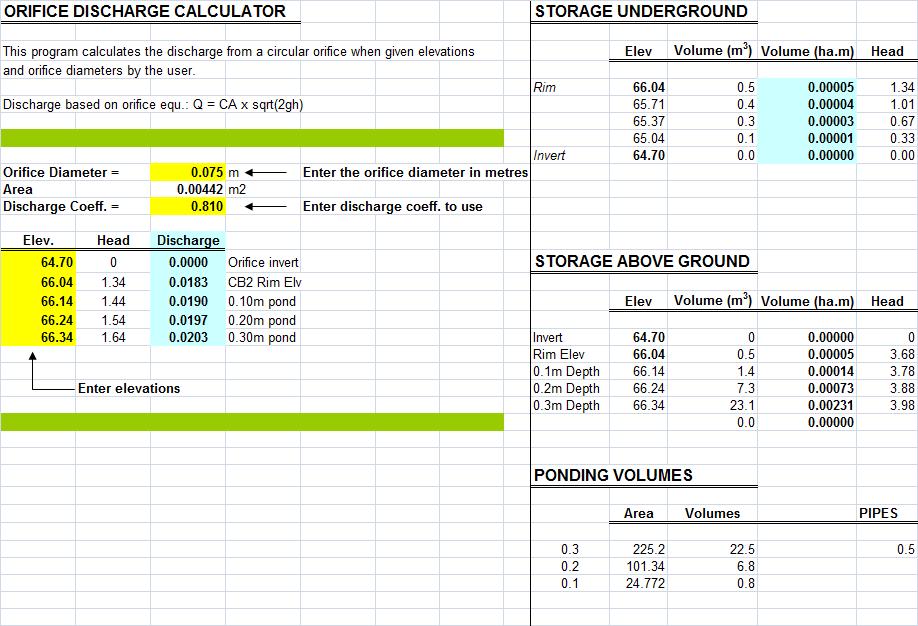
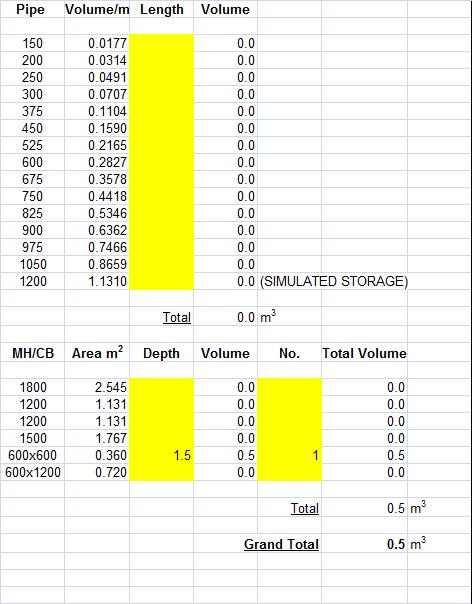
12 PROPOSED BANK PLACE D ORLEANS, OTTAWA SERVICING & STORM WATER MANAGEMENT REPORT 10 iii) Controlled Discharge Rate It is evident that, by the proposed rooftop controls and proposed 75mm orifice pipe at PROP CB 2, the release rate from the subject component of the site (Catchment areas A, B, C) is reduced to 66 L/s in a 5- year storm. The post-development Visual OTTHYMO Model is as follows, showing flows in a 5-year storm. Refer to the output in Appendix C. 1 Catchment B AREA = PeakFlow = Catchment C AREA = PeakFlow = Catchment A AREA = PeakFlow = Catchmt B Contrld Rf Dr PeakFlow = Catchmt C 75mm Orifice PeakFlow = Site Discharge PeakFlow = It is noted that it is not practical to provide attenuation and ponding storage for the runoff falling on Catchment A because the grading and configuration of the existing storm sewers and PROP CBMH 2 do not lend themselves to it. The grading falls to the west away from CBMH 2 and generally does not lend itself to ponding above CBMH 2. CBMH 2, further, is located on an existing sewer and the proposed location is thus the best. The Stage/Storage/Discharge relationship for the proposed 75mm orifice pipe at PROP CB 2 is as follows. Refer to the detailed relationship in Appendix C, and the ponding area on the Grading Plan. In a 5-year storm, 1.0m 3 of ponding storage will be used. Refer to the Visual OTTHYMO output in Appendix C. In a 100-year storm, 9m 3 of surface storage ponding (of the available 23.1m 3 ) will be used. TABLE 9 Proposed Catchment C/ PROP CB 2 Stage / Storage / Discharge Relationship for Prop. 75mm dia. PVC orifice tube Head (m) Elevation (m) Provided Volume (m 3 ) Discharge (l/s) Description Invert of Orifice Pipe Prop CB 2 rim elevation m pond depth m pond depth m pond depth Total Discharge: 5 Year = 19 l/s
13 PROPOSED BANK PLACE D ORLEANS, OTTAWA SERVICING & STORM WATER MANAGEMENT REPORT 11 The Stage/Storage/Discharge relationship for the proposed bank roof is as follows. By the foregoing stormwater quantity controls, the site (Catchment Areas A, B and C) discharge rate in a 5-year storm is reduced from 77 L/s (Table 6) to 66 L/s (OTTHYMO Output). Beyond a 5-year storm, to a 100-year storm, the system will be surcharged and runoff will flow via overland flow off the site to the Right of Way. The discharge rate of the site in the 5-year and 100-year storms is summarized as follows. TABLE 10 Post-Development Discharge/Release Rate (Visual OTTHYMO) Existing Catchment EX-A Proposed Catchment Prop. Area (ha) Method % imperv % imperv directly connected 5-Year Discharge Rate A StandHYD L/s B StandHYD L/s C StandHYD L/s Total Site 66 L/s 100-Year Discharge Rate Overland Flow
14 PROPOSED BANK PLACE D ORLEANS, OTTAWA SERVICING & STORM WATER MANAGEMENT REPORT CONCLUSIONS Our investigation has determined that the site is serviceable utilizing existing sanitary sewers, and existing storm and water main infrastructure adjacent to the site. The storm water management for the existing site will be improved for both quantity and quality. Water quantity objectives been achieved, maintained and improved upon. Respectfully Submitted; The Odan Detech Group Inc. September 14th, 2016 Daniel Bancroft, EIT JOHN KRPAN, M.S.C.E., P.Eng. DATE
15 APPENDIX A Aerial Photo of Existing Site Site Plan by SMV Architects Inc.

16 Aerial Photo of Existing Site Full Mall - EXTENTS OF PLACE D ORLEANS MALL PROPOSED BUILDING

17 Aerial Photo of Existing Site South West Corner Bank - PROPOSED BUILDING
18 Site Plan
19 APPENDIX B Sanitary Flow Calculation from Site Sanitary OBC Calculation Fire Flow Calculation City of Ottawa Water Boundary Conditions Proposed Sanitary Sewer Design Sheet
20
21 Sanitary OBC Calculation PROJECT: Proposed Bank CLIENT: SMV Archtiects Place D'Orleans DATE: June Ottawa, Ontario PROJECT No.: DRAWING REF.: SET C A B C D E F G H I J Floor Area (sq.ft.) Floor Area (sq.m.) Establishment Type (OBC B.) Based on Floor Area Volume (litres) Total Volume (litres) (B x E) Volume (litres) Establishment Type (OBC B.) Based on Employees/Service Chairs/Patrons (ea.) Volume (litres) (G x I) Office Office Building per 9.m2 floor area per Employee 8 Hour Shift Total Floor Area Total Based on Floor Area 4320 Total Based on Person/Hours/Service Chairs 1800 Total Volume (Average per day) 6120 Total (l/sec) 0.07
22 FIRE FLOW CALCULATION WATER SUPPLY FOR PUBLIC FIRE PROTECTION, FIRE UNDERWRITERS SURVEY GUIDE FOR DETERMINATION OF REQUIRED FIRE FLOWS F = 220 x C x A Where: F = required fire flow in liters per minute C= Coefficient related to the type of construction A = the total floor area in square meters (excluding basements) in the building considered LOCATION: Proposed Bank Place D'Orleans PROJECT: Proposed Bank Place D'Orleans OBC OCCUPANCY: Commercial Retail PROJECT No BUILDING FOOT PRINT (m2): 464 Contents Charge # OF STOREYS 1 Non Combustible 25% limited Combustible 15% Combustible 0% CONSTRUCTION CLASS: FIRE RESISTIVE Free Burning 15% AUTOMATED SPRINKLER PROTECTION Credit Total NFPA 13 sprinkler standard no 0% Standard Water Supply no 0% 0% Fully Supervised System no 0% 0% CONTENTS FACTOR: Combustible CHARGE: 0% ` Rapid Buring 25% Separation Charge EXPOSURE 1 (south) Distance to Exposure Building (m) > m 25% 0% Length Height m 20% EXPOSURE 2 (east) Distance to Exposure Building (m) > m 15% 0% Length Height m 10% EXPOSURE 3 (west) Distance to Exposure Building (m) > % 0% Length Height > 45 m 0% Total: EXPOSURE 4 (north) Distance to Exposure Building (m) >45 Length Height 0% 0% no more than 75% ARE BUILDINGS CONTIGUOUS: FIRE RESISTANT BUILDING No Are vertical openings and exterior vertical communications protected with a minimum one (1) h No CALCULATIONS C = 0.6 Fire Resistive A = 464 m2 (2 largest floor + 50% of 8 above floors) STOREY AREAS m2 F = 2843 L/min 464 Round to Nearest 1000 L/min F = 3000 L/min must be > 2000 L/min CORRECTION FACTORS: OCCUPANCY 0 L/min FIRE FLOW ADJUSTED FOR OCCUPANCY 3000 L/min REDUCTION FOR SPRINKLER 0 L/min EXPOSURE CHARGE 0 L/min REQUIRED FIRE FLOW F = 3000 L/min Round to Nearest 1000 L/min F = 3000 L/min 793 usgm F = 50 L/sec

23 Boundary Conditions at Place De Orleans Mall Information Provided: Date provided: 02 June 2015 Criteria Demand (L/s) Average Daily Demand 0.07 Maximum Daily Demand 0.11 Peak Hourly Demand 0.13 Fire Flow Demand 50 Max Day + Fire Flow Demand Location:
24 Results: Connection 1: Existing Conditions Criteria Head (m) Pressure (psi) Max HGL PKHR MXDY + Fire Flow (50 L/s) Disclaimer The boundary condition information is based on current operation of the city water distribution system. The computer model simulation is based on the best information available at the time. The operation of the water distribution system can change on a regular basis, resulting in a variation in boundary conditions. The physical properties of watermains deteriorate over time, as such must be assumed in the absence of actual field test data. The variation in physical watermain properties can therefore alter the results of the computer model simulation. Fire Flow analysis is a reflection of available flow in the water main; there may be additional restrictions that occur between the watermain and the hydrant that the model cannot take into account.
25 APPENDIX C Pre-Development Storm Drainage Plan Post-Development Storm Drainage Plan Pre-Development Visual OTTHYMO Model Output Post-Development Visual OTTHYMO Model Output Detailed Stage/Storage/Discharge relationship for proposed 75mm orifice Place D Orleans existing Site Servicing Plan
26 The Odan/Detech Group Inc. P: (905) F: (905) SOUTH SERVICE ROAD, BURLINGTON, ONTARIO, L7L 5K2
27 The Odan/Detech Group Inc. P: (905) F: (905) SOUTH SERVICE ROAD, BURLINGTON, ONTARIO, L7L 5K2
28 Pre-Development Visual OTTHYMO Model Output =========================================================================================================== V V I SSSSS U U A L V V I SS U U A A L V V I SS U U AAAAA L V V I SS U U A A L VV I SSSSS UUUUU A A LLLLL OOO TTTTT TTTTT H H Y Y M M OOO O O T T H H Y Y MM MM O O O O T T H H Y M M O O OOO T T H H Y M M OOO Developed and Distributed by Clarifica Inc. Copyright 1996, 2007 Clarifica Inc. All rights reserved. ***** D E T A I L E D O U T P U T ***** Input filename: C:\Program Files (x86)\visual OTTHYMO 2.3.3\voin.dat Output filename: P:\2015\15253\Word\ODAN Report\Servicing\Rev 1 (RBC)\OTTHYMO Model\Pre Development.out Summary filename: P:\2015\15253\Word\ODAN Report\Servicing\Rev 1 (RBC)\OTTHYMO Model\Pre Development.sum DATE: 9/13/2016 TIME: 2:32:20 PM USER: COMMENTS: **************************** ** SIMULATION NUMBER: 1 ** **************************** CHICAGO STORM IDF curve parameters: A= Ptotal= mm B= C=.814 used in: INTENSITY = A / (t + B)^C Duration of storm = 4.00 hrs Storm time step = min Time to peak ratio =.33 TIME RAIN TIME RAIN TIME RAIN TIME RAIN hrs mm/hr hrs mm/hr hrs mm/hr hrs mm/hr CALIB STANDHYD (0001) Area (ha)=.28 ID= 1 DT= 5.0 min Total Imp(%)= Dir. Conn.(%)= IMPERVIOUS PERVIOUS (i) Surface Area (ha)= Dep. Storage (mm)= Average Slope (%)= Length (m)= Mannings n = NOTE: RAINFALL WAS TRANSFORMED TO 5.0 MIN. TIME STEP TRANSFORMED HYETOGRAPH ---- TIME RAIN TIME RAIN TIME RAIN TIME RAIN hrs mm/hr hrs mm/hr hrs mm/hr hrs mm/hr
29 Max.Eff.Inten.(mm/hr)= over (min) Storage Coeff. (min)= 1.52 (ii) 4.41 (ii) Unit Hyd. Tpeak (min)= Unit Hyd. peak (cms)= *TOTALS* PEAK FLOW (cms)= (iii) TIME TO PEAK (hrs)= RUNOFF VOLUME (mm)= TOTAL RAINFALL (mm)= RUNOFF COEFFICIENT = ***** WARNING: STORAGE COEFF. IS SMALLER THAN TIME STEP! (i) CN PROCEDURE SELECTED FOR PERVIOUS LOSSES: CN* = 85.0 Ia = Dep. Storage (Above) (ii) TIME STEP (DT) SHOULD BE SMALLER OR EQUAL THAN THE STORAGE COEFFICIENT. (iii) PEAK FLOW DOES NOT INCLUDE BASEFLOW IF ANY **************************** ** SIMULATION NUMBER: 2 ** **************************** CHICAGO STORM IDF curve parameters: A= Ptotal= mm B= C=.820 used in: INTENSITY = A / (t + B)^C Duration of storm = 4.00 hrs Storm time step = min Time to peak ratio =.33 TIME RAIN TIME RAIN TIME RAIN TIME RAIN hrs mm/hr hrs mm/hr hrs mm/hr hrs mm/hr CALIB STANDHYD (0001) Area (ha)=.28 ID= 1 DT= 5.0 min Total Imp(%)= Dir. Conn.(%)= IMPERVIOUS PERVIOUS (i) Surface Area (ha)= Dep. Storage (mm)= Average Slope (%)= Length (m)= Mannings n = NOTE: RAINFALL WAS TRANSFORMED TO 5.0 MIN. TIME STEP TRANSFORMED HYETOGRAPH ---- TIME RAIN TIME RAIN TIME RAIN TIME RAIN hrs mm/hr hrs mm/hr hrs mm/hr hrs mm/hr
30 Max.Eff.Inten.(mm/hr)= over (min) Storage Coeff. (min)= 1.23 (ii) 3.55 (ii) Unit Hyd. Tpeak (min)= Unit Hyd. peak (cms)= *TOTALS* PEAK FLOW (cms)= (iii) TIME TO PEAK (hrs)= RUNOFF VOLUME (mm)= TOTAL RAINFALL (mm)= RUNOFF COEFFICIENT = ***** WARNING: STORAGE COEFF. IS SMALLER THAN TIME STEP! (i) CN PROCEDURE SELECTED FOR PERVIOUS LOSSES: CN* = 85.0 Ia = Dep. Storage (Above) (ii) TIME STEP (DT) SHOULD BE SMALLER OR EQUAL THAN THE STORAGE COEFFICIENT. (iii) PEAK FLOW DOES NOT INCLUDE BASEFLOW IF ANY FINISH ===========================================================================================================
31 Post-Development Visual OTTHYMO Model Output =========================================================================================================== V V I SSSSS U U A L V V I SS U U A A L V V I SS U U AAAAA L V V I SS U U A A L VV I SSSSS UUUUU A A LLLLL OOO TTTTT TTTTT H H Y Y M M OOO O O T T H H Y Y MM MM O O O O T T H H Y M M O O OOO T T H H Y M M OOO Developed and Distributed by Clarifica Inc. Copyright 1996, 2007 Clarifica Inc. All rights reserved. ***** D E T A I L E D O U T P U T ***** Input filename: C:\Program Files (x86)\visual OTTHYMO 2.3.3\voin.dat Output filename: P:\2015\15253\Word\ODAN Report\Servicing\Rev 1 (RBC)\OTTHYMO Model\Post Development.out Summary filename: P:\2015\15253\Word\ODAN Report\Servicing\Rev 1 (RBC)\OTTHYMO Model\Post Development.sum DATE: 9/13/2016 TIME: 2:33:24 PM USER: COMMENTS: **************************** ** SIMULATION NUMBER: 1 ** **************************** CHICAGO STORM IDF curve parameters: A= Ptotal= mm B= C=.814 used in: INTENSITY = A / (t + B)^C Duration of storm = 4.00 hrs Storm time step = min Time to peak ratio =.33 TIME RAIN TIME RAIN TIME RAIN TIME RAIN hrs mm/hr hrs mm/hr hrs mm/hr hrs mm/hr CALIB STANDHYD (0003) Area (ha)=.17 ID= 1 DT= 5.0 min Total Imp(%)= Dir. Conn.(%)= IMPERVIOUS PERVIOUS (i) Surface Area (ha)= Dep. Storage (mm)= Average Slope (%)= Length (m)= Mannings n = NOTE: RAINFALL WAS TRANSFORMED TO 5.0 MIN. TIME STEP TRANSFORMED HYETOGRAPH ---- TIME RAIN TIME RAIN TIME RAIN TIME RAIN hrs mm/hr hrs mm/hr hrs mm/hr hrs mm/hr
32 Max.Eff.Inten.(mm/hr)= over (min) Storage Coeff. (min)= 1.30 (ii) 4.18 (ii) Unit Hyd. Tpeak (min)= Unit Hyd. peak (cms)= *TOTALS* PEAK FLOW (cms)= (iii) TIME TO PEAK (hrs)= RUNOFF VOLUME (mm)= TOTAL RAINFALL (mm)= RUNOFF COEFFICIENT = ***** WARNING: STORAGE COEFF. IS SMALLER THAN TIME STEP! (i) CN PROCEDURE SELECTED FOR PERVIOUS LOSSES: CN* = 85.0 Ia = Dep. Storage (Above) (ii) TIME STEP (DT) SHOULD BE SMALLER OR EQUAL THAN THE STORAGE COEFFICIENT. (iii) PEAK FLOW DOES NOT INCLUDE BASEFLOW IF ANY CALIB STANDHYD (0002) Area (ha)=.07 ID= 1 DT= 5.0 min Total Imp(%)= Dir. Conn.(%)= IMPERVIOUS PERVIOUS (i) Surface Area (ha)= Dep. Storage (mm)= Average Slope (%)= Length (m)= Mannings n = Max.Eff.Inten.(mm/hr)= over (min) Storage Coeff. (min)= 1.02 (ii) 3.90 (ii) Unit Hyd. Tpeak (min)= Unit Hyd. peak (cms)= *TOTALS* PEAK FLOW (cms)= (iii) TIME TO PEAK (hrs)= RUNOFF VOLUME (mm)= TOTAL RAINFALL (mm)= RUNOFF COEFFICIENT = ***** WARNING: STORAGE COEFF. IS SMALLER THAN TIME STEP! (i) CN PROCEDURE SELECTED FOR PERVIOUS LOSSES: CN* = 85.0 Ia = Dep. Storage (Above) (ii) TIME STEP (DT) SHOULD BE SMALLER OR EQUAL THAN THE STORAGE COEFFICIENT. (iii) PEAK FLOW DOES NOT INCLUDE BASEFLOW IF ANY CALIB STANDHYD (0001) Area (ha)=.04 ID= 1 DT= 5.0 min Total Imp(%)= Dir. Conn.(%)= IMPERVIOUS PERVIOUS (i) Surface Area (ha)= Dep. Storage (mm)= Average Slope (%)= Length (m)= Mannings n = Max.Eff.Inten.(mm/hr)= over (min) Storage Coeff. (min)=.87 (ii) 2.33 (ii)
33 Unit Hyd. Tpeak (min)= Unit Hyd. peak (cms)= *TOTALS* PEAK FLOW (cms)= (iii) TIME TO PEAK (hrs)= RUNOFF VOLUME (mm)= TOTAL RAINFALL (mm)= RUNOFF COEFFICIENT = ***** WARNING: STORAGE COEFF. IS SMALLER THAN TIME STEP! (i) CN PROCEDURE SELECTED FOR PERVIOUS LOSSES: CN* = 85.0 Ia = Dep. Storage (Above) (ii) TIME STEP (DT) SHOULD BE SMALLER OR EQUAL THAN THE STORAGE COEFFICIENT. (iii) PEAK FLOW DOES NOT INCLUDE BASEFLOW IF ANY RESERVOIR (0005) IN= 2---> OUT= 1 DT= 5.0 min OUTFLOW STORAGE OUTFLOW STORAGE (cms) (ha.m.) (cms) (ha.m.) AREA QPEAK TPEAK R.V. (ha) (cms) (hrs) (mm) INFLOW : ID= 2 (0002) OUTFLOW: ID= 1 (0005) PEAK FLOW REDUCTION [Qout/Qin](%)= TIME SHIFT OF PEAK FLOW (min)=.00 MAXIMUM STORAGE USED (ha.m.)= RESERVOIR (0004) IN= 2---> OUT= 1 DT= 5.0 min OUTFLOW STORAGE OUTFLOW STORAGE (cms) (ha.m.) (cms) (ha.m.) AREA QPEAK TPEAK R.V. (ha) (cms) (hrs) (mm) INFLOW : ID= 2 (0001) OUTFLOW: ID= 1 (0004) PEAK FLOW REDUCTION [Qout/Qin](%)= TIME SHIFT OF PEAK FLOW (min)= MAXIMUM STORAGE USED (ha.m.)= ADD HYD (0006) = 3 AREA QPEAK TPEAK R.V. (ha) (cms) (hrs) (mm) ID1= 1 (0005): ID2= 2 (0004): ================================================== ID = 3 (0006): NOTE: PEAK FLOWS DO NOT INCLUDE BASEFLOWS IF ANY ADD HYD (0007) = 3 AREA QPEAK TPEAK R.V. (ha) (cms) (hrs) (mm) ID1= 1 (0003): ID2= 2 (0006): ================================================== ID = 3 (0007): NOTE: PEAK FLOWS DO NOT INCLUDE BASEFLOWS IF ANY.
34 **************************** ** SIMULATION NUMBER: 2 ** **************************** CHICAGO STORM IDF curve parameters: A= Ptotal= mm B= C=.820 used in: INTENSITY = A / (t + B)^C Duration of storm = 4.00 hrs Storm time step = min Time to peak ratio =.33 TIME RAIN TIME RAIN TIME RAIN TIME RAIN hrs mm/hr hrs mm/hr hrs mm/hr hrs mm/hr CALIB STANDHYD (0003) Area (ha)=.17 ID= 1 DT= 5.0 min Total Imp(%)= Dir. Conn.(%)= IMPERVIOUS PERVIOUS (i) Surface Area (ha)= Dep. Storage (mm)= Average Slope (%)= Length (m)= Mannings n = NOTE: RAINFALL WAS TRANSFORMED TO 5.0 MIN. TIME STEP TRANSFORMED HYETOGRAPH ---- TIME RAIN TIME RAIN TIME RAIN TIME RAIN hrs mm/hr hrs mm/hr hrs mm/hr hrs mm/hr Max.Eff.Inten.(mm/hr)= over (min) Storage Coeff. (min)= 1.05 (ii) 3.37 (ii) Unit Hyd. Tpeak (min)= Unit Hyd. peak (cms)= *TOTALS* PEAK FLOW (cms)= (iii) TIME TO PEAK (hrs)= RUNOFF VOLUME (mm)= TOTAL RAINFALL (mm)= RUNOFF COEFFICIENT = ***** WARNING: STORAGE COEFF. IS SMALLER THAN TIME STEP! (i) CN PROCEDURE SELECTED FOR PERVIOUS LOSSES: CN* = 85.0 Ia = Dep. Storage (Above) (ii) TIME STEP (DT) SHOULD BE SMALLER OR EQUAL THAN THE STORAGE COEFFICIENT. (iii) PEAK FLOW DOES NOT INCLUDE BASEFLOW IF ANY CALIB STANDHYD (0002) Area (ha)=.07
35 ID= 1 DT= 5.0 min Total Imp(%)= Dir. Conn.(%)= IMPERVIOUS PERVIOUS (i) Surface Area (ha)= Dep. Storage (mm)= Average Slope (%)= Length (m)= Mannings n = Max.Eff.Inten.(mm/hr)= over (min) Storage Coeff. (min)=.82 (ii) 3.15 (ii) Unit Hyd. Tpeak (min)= Unit Hyd. peak (cms)= *TOTALS* PEAK FLOW (cms)= (iii) TIME TO PEAK (hrs)= RUNOFF VOLUME (mm)= TOTAL RAINFALL (mm)= RUNOFF COEFFICIENT = ***** WARNING: STORAGE COEFF. IS SMALLER THAN TIME STEP! (i) CN PROCEDURE SELECTED FOR PERVIOUS LOSSES: CN* = 85.0 Ia = Dep. Storage (Above) (ii) TIME STEP (DT) SHOULD BE SMALLER OR EQUAL THAN THE STORAGE COEFFICIENT. (iii) PEAK FLOW DOES NOT INCLUDE BASEFLOW IF ANY CALIB STANDHYD (0001) Area (ha)=.04 ID= 1 DT= 5.0 min Total Imp(%)= Dir. Conn.(%)= IMPERVIOUS PERVIOUS (i) Surface Area (ha)= Dep. Storage (mm)= Average Slope (%)= Length (m)= Mannings n = Max.Eff.Inten.(mm/hr)= over (min) Storage Coeff. (min)=.70 (ii) 1.88 (ii) Unit Hyd. Tpeak (min)= Unit Hyd. peak (cms)= *TOTALS* PEAK FLOW (cms)= (iii) TIME TO PEAK (hrs)= RUNOFF VOLUME (mm)= TOTAL RAINFALL (mm)= RUNOFF COEFFICIENT = ***** WARNING: STORAGE COEFF. IS SMALLER THAN TIME STEP! (i) CN PROCEDURE SELECTED FOR PERVIOUS LOSSES: CN* = 85.0 Ia = Dep. Storage (Above) (ii) TIME STEP (DT) SHOULD BE SMALLER OR EQUAL THAN THE STORAGE COEFFICIENT. (iii) PEAK FLOW DOES NOT INCLUDE BASEFLOW IF ANY RESERVOIR (0005) IN= 2---> OUT= 1 DT= 5.0 min OUTFLOW STORAGE OUTFLOW STORAGE (cms) (ha.m.) (cms) (ha.m.) AREA QPEAK TPEAK R.V. (ha) (cms) (hrs) (mm) INFLOW : ID= 2 (0002) OUTFLOW: ID= 1 (0005) PEAK FLOW REDUCTION [Qout/Qin](%)= TIME SHIFT OF PEAK FLOW (min)= 5.00 MAXIMUM STORAGE USED (ha.m.)=.0009
36 RESERVOIR (0004) IN= 2---> OUT= 1 DT= 5.0 min OUTFLOW STORAGE OUTFLOW STORAGE (cms) (ha.m.) (cms) (ha.m.) AREA QPEAK TPEAK R.V. (ha) (cms) (hrs) (mm) INFLOW : ID= 2 (0001) OUTFLOW: ID= 1 (0004) PEAK FLOW REDUCTION [Qout/Qin](%)= TIME SHIFT OF PEAK FLOW (min)= MAXIMUM STORAGE USED (ha.m.)= ADD HYD (0006) = 3 AREA QPEAK TPEAK R.V. (ha) (cms) (hrs) (mm) ID1= 1 (0005): ID2= 2 (0004): ================================================== ID = 3 (0006): NOTE: PEAK FLOWS DO NOT INCLUDE BASEFLOWS IF ANY ADD HYD (0007) = 3 AREA QPEAK TPEAK R.V. (ha) (cms) (hrs) (mm) ID1= 1 (0003): ID2= 2 (0006): ================================================== ID = 3 (0007): NOTE: PEAK FLOWS DO NOT INCLUDE BASEFLOWS IF ANY FINISH ===========================================================================================================
37
38
39