Global LNG-based natural gas trade: The role of the US and Louisiana
|
|
|
- Blaze Reed
- 5 years ago
- Views:
Transcription

1 Global LNG-based natural gas trade: The role of the US and Louisiana Energy Summit 2018 Louisiana s Place in the Global Energy Economy LSU Center for Energy Studies Baton Rouge, Louisiana October 24, 2018 Ronald D. Ripple, PhD Mervin Bovaird Professor of Energy Business and Finance ron-ripple@utulsa.edu
2 Outline Confusion - What is LNG; What is LNG not? Where have we come from? Where may we be going? What are the competitive challenges? Uncertainties? 2
3 Confusion What is LNG; What is LNG not? LNG is NOT a fuel. LNG is NOT a commodity. LNG is NOT distinct from natural gas. LNG does NOT compete with natural gas. NO process uses the -162 C (-260 F) liquid as an input. LNG is a transportation and/or storage phase for natural gas. LNG is always re-gasified for use. Natural gas is the fuel/commodity. The markets are for natural gas. 3
4 Confusion What is LNG; What is LNG not? Why does this matter? The confusion can lead to bad policy and regulation. Indeed, this has occurred! The WTO found against a claim by Russia, with the WTO saying that LNG is distinct from natural gas in the gaseous form, and therefore differences in treatment could not be claimed to be discriminatory. See, WTO, EU Energy Package (Panel Report), WT/DS476/R, 10 August 2018; See, A False Dichotomy Between LNG and Natural Gas? A Comment on Recent Practices at the World Trade Organization, by M. Wüstenberg, K. Talus and R.D. Ripple, OGEL, October 2018; 4
5 Where have we come from? 5

6 Year-onyear Growth global LNG trade Natural gas imports and exports [Source: BP Statistical Review of World Energy ] % % US LNG exports accounted for 25% of the global increase % of increase 6


7 2018 Sabine Pass 23 countries 87.5% Cove Point 13 countries Number of countries % 7
8 China LNG-based imports from the US: 2017 vs total imports of 130,409,855 Mcf Imports through August 2017 amounted to 24,461,696 Mcf, or just 24% of the total for the year. There were just 7 cargoes through the first 8 months. There were 23 cargoes during September through December total imports, through August, amounted to 76,155,297 Mcf, on 21 cargoes, or over 3 times the 2017 import volumes for the same period. 8
9 Where are we going? 9
10 10
. 7 projects 13.09 Bcf/d implies ~99.")
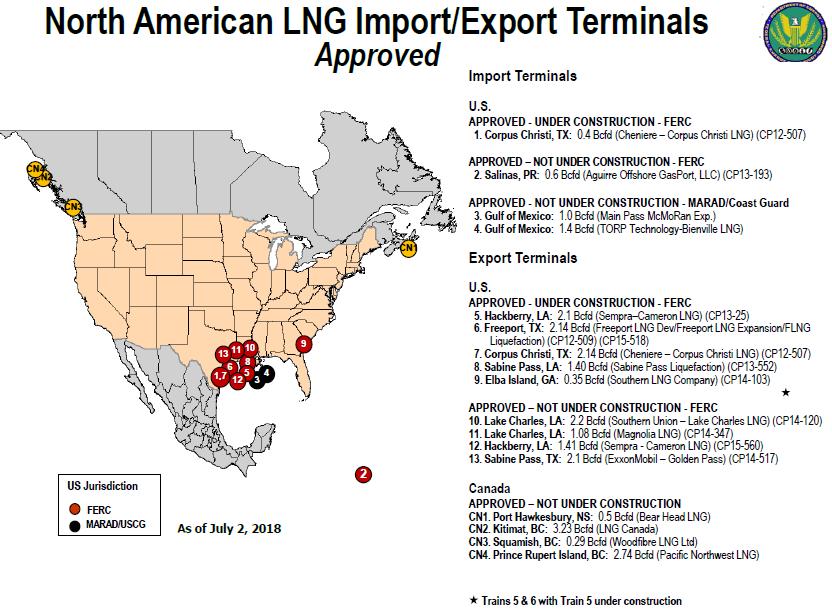
11 US LNG export projects - FERC Louisiana accounts for 54% of liquefaction capacity operating and under construction, and 70% of the approved (operating, under construction, and not under construction). 7 projects Bcf/d implies ~99.5 mtpy 11
12 BP Outlook Outlook Natural gas Consumption, production, and balance For context, the 45.7 Mtoe surplus represents about 5 Bcf/d; this is about 1% of production. Note that while Europe is expected to have a larger shortfall than the Asia-Pacific, the expected surplus in CIS is sufficient to meet it. The Mtoe deficit implies about 39 Bcf/d 403 Bcm/y 297 mtpa

13 BP Outlook Outlook Natural gas Consumption, production, and balance Note that Australia is already accounted for within the Asia-Pacific, so the shortfall must be met from outside the region. For context, the 45.7 Mtoe surplus represents about 5 Bcf/d; this is about 1% of production. Note that while Europe is expected to have a larger shortfall than the Asia-Pacific, the expected surplus in CIS is sufficient to meet it. The Mtoe deficit implies about 39 Bcf/d 403 Bcm/y 297 mtpa

14 IEA Gas Market Report-2018, p
15 Liquefaction capacity - [GIIGNL] At the end of 2017, nameplate capacity was 365 mtpa (48.0 Bcf/d or Bcm) At the end of 2017, about 89 mtpa (11.7 Bcf/d) of new capacity was under construction, with 49 mtpa (6.4 Bcf/d) in the US and 17 mtpa (2.2 Bcf/d) in Australia. During 2018, about 38 mtpa (5.0 Bcf/d) of new capacity will come on line, with 13 mtpa (1.7 Bcf/d) being in the US. Given exports of Bcm (38.1 Bcf/d) in 2017, this implies a 79.3% capacity utilization rate. 15

16 Roughly in line with US projects currently under construction IEA Gas Market Report-2018, p

17 IEA LNG liquefaction capacity outlook IEA Gas Market Report-2018, p

18 Approximately 8 Bcf/d IEA Gas Market Report-2018, p

19 Note that the IEA did not include Canada as an exporter by 2023 IEA Gas Market Report-2018, p. 115 (Bcm) 19
20 Regasification capacity - [GIIGNL] At the end of 2017 nameplate capacity 850 mtpa (111.8 Bcf/d or 1,156 Bcm) At the end of 2017, about mtpa (13.6 Bcf/d) of new capacity was under construction, with 54.1 mtpa (7.1 Bcf/d) in the Asia. In addition, several FSRU projects were proposed, including in Australia. Given exports of Bcm (38.1 Bcf/d) in 2017, this implies a 46.3% capacity utilization rate. Europe tends to be below 30% utilization. China, at the end of 2017, had 17 LNG regasification terminals, with 76 Bcm/y (>7 Bcf/d) sendout capacity, with expansions and additional terminals under construction. China, during 2017, imported 52.6 Bcm of LNG-sourced gas, implying a utilization rate of 74%. 20
21 Pricing Different business models Evolution toward more spot and short-term trade 21

22 Note that Cheniere is NOT a tolling operation. IEA Gas Market Report-2018, p


23 Pricing terms are evolving; increased spot and short-term trading GIIGNL

24 IEA, Global Gas Security Review,
25 Shipping costs LNG tanker rates are variable and based on complex supply and demand conditions Supply is impacted by observations and expectations for future demand These observations and expectations are affected by investment decisions for liquefaction capacity. Delays in liquefaction FIDs and construction lead to delays in new tanker orders, which impact available tanker supply/capacity. 25
26 LNG tanker rates ( ) 26
27 LNG tanker rates (2018) 27 Fearnleys Weekly Reports
28 IEA, Global Gas Security Review,
29 LNG shipping cost estimates A month ago For tanker day rates of +/- $20,000 around the $70,000 Zeebrugge $ $1.16 Shanghai (Panama) $ $
30 LNG shipping cost estimates This week 30
31 Netback values based on a Cheniere-type business model Breakeven netbacks Northern Europe pence per therm and euros per MWh ($7.64/MMBtu) Japan/Asia - $8.44 per MMBtu 31
32 Japan s nuclear restart Uncertainties China s domestic production and pipeline imports 2017 production was 14.4 Bcf/d; up from 9.3 Bcf/d in 2010, and an 8.5% increase over 2016 Production projections for 2030 range from Bcf/d 2017 pipeline imports were 3.8 Bcf/d; only slightly higher than was the first time in several years that LNG-based imports exceeded pipeline imports, and this occurred while there was excess import pipeline capacity (the 2017 utilization rate was about 75%) FLNG success China s import tariffs 32
33 Summary Global natural gas has been affected by the evolution of the energy price environment. Asia-Pacific is expected to be in production-consumption deficit for the foreseeable future, as is Europe. Substantial supplies of natural gas from LNG and pipeline sources will be available, keeping downward pressure on prices. Australia maintains an advantage over the US for Asia-Pacific natural gas markets due to geographic location, large capacity, and sunk costs. BUT, Asia-Pacific remains in consumption-production deficit even with Australia s contribution. Japan s nuclear re-start uncertainty clouds it s level of demand. China s role as an LNG-based natural gas importer is unclear, with potential competition from pipeline imports and domestic production. At current relative prices, and expected LNG shipping costs, margins from the 33 US to Asia are likely to remain superior to those for Europe.
34 Thank you! Questions - Comments Ronald D. Ripple, PhD ron-ripple@utulsa.edu 34