Requirements-driven global ocean observing system for Ocean Acidification
|
|
|
- Gabriella Gibbs
- 5 years ago
- Views:
Transcription


1 Requirements-driven global ocean observing system for Ocean Acidification Maciej Telszewski Masao Ishii, Kim Currie, Artur Palacz and Albert Fischer Biogeochemistry Panel Institute of Oceanology of Polish Academy of Sciences, ul. Powstańców Warszawy 55, Sopot, Poland Phone: / Fax: , Biogeochemistry Panel


2 Societal benefit value chain Adapted from G7 Think Piece on Ocean Observations


3 System A broad schematic of a sustained ocean acidification information flow chart, including the full value chain End user societal benefit [governing / acting] Governments, communities, industry Climate and Weather Food security Assessments and management of ecosystem services Emission policies Real-time services Services [informing] Early warning, forecasts Predicting / Modeling Ocean forecast systems Assessing Policy-relevant scientific assessments Understanding Scientific analysis, indicators Data systems Assembly and dissemination System requirements Applications/products, knowledge challenges, phenomena, EOVs, network design Observations Coordination In situ and satellite observations Global networks and global approaches The Effects of Climate Change on the World Oceans 4 th International Symposium, 4-8 June 2018, Washington, DC, USA Biogeochemistry Panel
4 Framework for Ocean Observing Requirements for GOOS Biogeochemistry The role of ocean biogeochemistry in climate Q1.1 How is the ocean carbon content changing? Q1.2 How does the ocean influence cycles of non-co 2 greenhouse gases? Human impacts on ocean biogeochemistry Q2.1. How large are the ocean s dead zones and how fast are they changing? Q2.2 What are rates and impacts of ocean acidification? Ocean ecosystem health Q3.1 Is the biomass of the ocean changing? Q3.2 How does eutrophication and pollution impact ocean productivity and water quality? The Effects of Climate Change on the World Oceans 4 th International Symposium, 4-8 June 2018, Washington, DC, USA Biogeochemistry Panel
5 GOOS Phenomena - Biogeochemistry ANTHROPOGENIC CARBON SEQUESTRATION AIR-SEA FLUXES LAND-SEA FLUXES VENTILLATION OCEAN ACIDIFICATION EUTROPHICATION CIRCULATION DEOXYGENATION CONTAMINATION /POLLUTION PRIMARY PRODUCTION UPWELLING BENTHIC FLUXES REMINERALI- ZATION STORAGE / INVENTORY EXPORT FLUXES CALCIFICATION The Effects of Climate Change on the World Oceans 4 th International Symposium, 4-8 June 2018, Washington, DC, USA Biogeochemistry Panel
6 GOOS Essential Ocean Variables Physics & Climate Biogeochemistry Biology & Ecosystems Sea State Oxygen Phytoplankton Biomass & Diversity Ocean Surface Stress Nutrients Zooplankton Biomass & Diversity Sea Ice Inorganic Carbon Fish Abundance & Distribution Sea Surface Height Transient Tracers Marine Turtles, Birds, Mammals Abundance & Distribution Sea Surface Temperature Particulate Matter Hard Coral Cover & Composition Subsurface Temperature Nitrous Oxide Seagrass Cover Surface Currents Stable Carbon Isotopes Macroalgal Canopy Subsurface Currents Dissolved Organic Carbon Mangrove Cover Sea Surface Salinity Subsurface Salinity Ocean Surface Heat Flux Ocean Colour Microbe Biomass & Diversity Benthic Invertebrate Abundance & Distribution Emerging EOVs EOV Specification Sheets:


7 The rationale, design, and locations of components for an international ocean acidification observing network, taking into account existing activities A minimum suite of measurement parameters Implementation Strategy A strategy for data quality assurance and for data distribution 2018? The requirements for international programme integration
8 The Essential Ocean Variables Specification Sheets EOV Specification Sheets: Essential Ocean Variable (EOV): Inorganic Carbon Name of EOV Sub-Variables Derived Products Supporting Variables Responsible GOOS Panel Inorganic Carbon Dissolved Inorganic Carbon (DIC), Total Alkalinity (TA), Partial pressure of carbon dioxide (pco 2 ) and ph. [At least two of the four Sub-Variables are needed.] Saturation state (aragonite, calcite), Dissolved carbonate ion concentration, Air-sea flux of CO 2, Anthropogenic carbon, Change in total carbon Surface and subsurface Temperature, Surface and subsurface Salinity, Ocean vector stress (wind speed), Atmospheric column-averaged dry-air mole fraction of CO2 (xco 2 ), Barometric pressure, Oxygen, Calcium concentration, Transient tracers, Oxygen to argon ratio (O 2 /Ar) GOOS Biogeochemistry Panel Contact: ioccp@ioccp.org The Effects of Climate Change on the World Oceans 4 th International Symposium, 4-8 June 2018, Washington, DC, USA Biogeochemistry Panel
9 Table 2: Requirements Setting (Inorganic Carbon) Societal Drivers 1. The role of ocean biogeochemistry in climate 2. Human impacts on ocean biogeochemistry 3. Ocean ecosystem health Scientific Application(s) Readiness Level [as defined in the FOO] Q 1.1. How is the ocean carbon content changing? Q 2.1. How large are the ocean s dead zones and how fast are they growing? Q 2.2. What are rates and impacts of ocean acidification? Q 3.1. Is the biomass of the oceans changing? Mature Phenomena to Capture 1 Air-Sea Fluxes 2 Storage / inventory 3 Ocean Acidification 4 Primary production Temporal Scales of the Phenomena Monthly Annual Coastal Daily Open Ocean Seasonal Seasonal to decadal Spatial Scales of the Phenomena km km Coastal km Open Ocean km Coastal km Open Ocean km Magnitudes/Range of the Signal to Capture Current Uncertainty Relative to the Signal Target Uncertainty Relative to the Signal 2 Pg C yr Pg C decade -1 Saturation states 0.1 decade -1 ph 0.01 decade -1 ±10% ±10% ±20% 0.5 Pg C yr -1 decade -1 (net community production)
10 Table 3: Current Observing Networks (Inorganic Carbon) Observing Approach Ship-based Underway Observations Ship-based Repeat Hydrography Moored Fixed- Point Observatories Drifters Ship-based Fixed- Point Observatories Profiling floats Readiness Level of the Observing Approach for this EOV Mature Mature Mature Mature Mature ph: Pilot pco 2: Concept DIC: Concept TA: Concept Leading Obs. Network SOOP-CO 2 GO-SHIP OceanSITES Biogeochemical Argo Network Readiness Level Concept Mature Pilot Pilot Phenomena Addressed 1,3 2,3 1,3,4 1,3 1,3,4,5 2,3,4,5 Spatial Scales Currently Captured by the Observing Network Horizontal coverage: global, every 10, denser in the coastal domain Vertical coverage: surface Horizontal coverage: global, every 20 Vertical coverage: full depth Horizontal coverage: Vertical coverage: Horizontal coverage: Vertical coverage: Horizontal coverage: Vertical coverage: Horizontal coverage: every 10, denser in the coastal domain Vertical coverage: Typical Obs. Frequency Weekly to decadal Decadal Sub-daily to seasonal and annual Hourly to annual Weekly to decadal Weekly to annual Supporting Variables Measured Atmospheric / ocean pco 2, Surface temperature and salinity Surface and subsurface temperature and salinity, Wind speed, Atmospheric CO 2 Surface and subsurface temperature Wind speed, Atmospheric and ocean pco 2 Sensor(s)/Technique Equilibrator, Permeable membrane, IR, CRDS Benchtop instruments Equilibrator, Permeable membrane Spectrophotometric Titration, equilibrator Spectro-photometry; variety of sensors are being developed Accuracy/Uncertainty Estimate (units) pco 2: ±2 μatm TA/DIC: ±2 μmol kg -1 ph: ±0.005 pco 2: ±2 μatm pco 2 ±5 μatm pco 2: ±5 μatm ph: ±0.005 TA/DIC: ±2 μmol kg -1 ph: ±0.005 pco 2: ±2 μatm pco 2: ±5 µatm ph: ±0.005 Reporting Mechanisms(s) Individual Networks Annual Reports; IOCCP Annual Report
11 Table 4: Future Observing Capacity (Inorganic Carbon) Observing Approach Novel aspect of the observing approach How does this novel aspect impact our observing capacity? Readiness Level of the Observing Network Spatial Scales Captured by the Observing Network Surface Autonomous Vehicles Novel observing approach and network (OceanGliders)for ph and pco 2. ph: Pilot pco 2: Concept DIC: Concept TA: Concept 20, surface Moored Fixedpoint Observatories Resolving full water column measurement of ph and pco 2. pco 2 (surface) Mature pco 2 (interior): Concept ph: Concept Autonomous Underwater Vehicles Novel observing approach resolving water column measurements of ph and pco 2. Concept Ship-based Underway Observations New sub-variables measured (DIC/TA) using new sensors/techniques. underway pco 2: Mature underway DIC/TA: underway ph: 1 km km, full depth Every 10, Denser in the coastal domain, Surface Typical Observing Frequency Daily to monthly Sub-daily to seasonal and annual Time-Scale Until Part of Observing System Supporting Variables Measured Sensor(s)/Technique Spectro-photometry & Equilibrator Permeable membrane Daily to monthly Spectro-photometry Weekly to annual DIC: NDIR (?CRDS) Very dynamic field, variety of sensors are being developed Very dynamic field, variety of sensors are being developed Very dynamic field, variety of sensors are being developed pco 2: Equilibrator ph: Permeable membrane TA: Titration Accuracy/Uncertainty Estimate (units) pco 2: ±5 µatm ph: ±0.005 pco 2: ±10 µatm ph: ±0.005 pco 2: ±5 µatm ph: ±0.005 ph: ±0.005 TA: ±2 µatm DIC: ±4 µatm

12

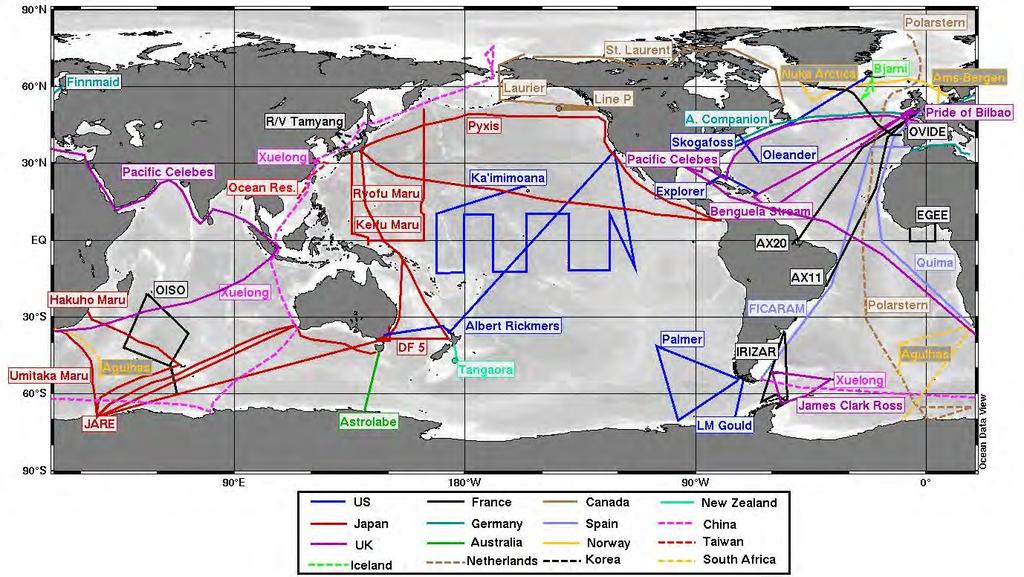
13 Interior Ocean Observations (GO-SHIP, The Global Ocean Ship-based Hydrographic Investigations Program) GODAE OceanView International School: New Frontiers in Operational Oceanography 2-13 October 2017, Mallorca, Spain


14 Biogeochemical Time Series All OceanSITES Dec 2017 BGC OceanSITES (Henson et al. (2016)) MapCO 2 sites (Sutton et al. 2014)
15 Biogeochemical Argo


16 Carbon Data Management The Effects of Climate Change on the World Oceans 4 th International Symposium, 4-8 June 2018, Washington, DC, USA Biogeochemistry Panel

17 Global Data Assembly Centre for Marine Biogeochemistry The Effects of Climate Change on the World Oceans 4 th International Symposium, 4-8 June 2018, Washington, DC, USA Biogeochemistry Panel

18 The GOA-ON interactive data portal Featuring global OA data, asset inventory, metadata, data synthesis products, etc.

; Documented in ESSD articles; Community")
19 Data synthesis products Surface Ocean CO 2 Atlas (µatm) A-E, V5 Global synthesis and gridded products of surface ocean fco 2 in uniform format with quality control; V5: 21.5 million fco 2 values from , accuracy < 5 μatm (flags A-D); Plus calibrated sensor data (< 10 μatm, flag of E); Interactive online viewers; Online viewers, downloadable (text, NetCDF, ODV, Matlab); Documented in ESSD articles; Community activity with >100 contributors worldwide.


20 Data synthesis products Global Ocean Data Analysis Project v2 A global collection of Sal., O 2, Nitr., Sil., Phos., DIC, Talk, ph data stations (724 cruises) sampling depths GEOSECS TTO WOCE - CLIVAR Corrected for biases Extensively documented
![System A broad schematic of a sustained ocean acidification information flow chart, including the full value chain End user societal benefit [governing / acting] Governments, communities,](/docs-images/93/112918430/images/21-0.jpg "industry Services [informing] Early warning, forecasts Predicting / Modeling Ocean forecast systems Assessing Policy-relevant scientific assessments Understanding Scientific analysis,")

21 System A broad schematic of a sustained ocean acidification information flow chart, including the full value chain End user societal benefit [governing / acting] Governments, communities, industry Services [informing] Early warning, forecasts Predicting / Modeling Ocean forecast systems Assessing Policy-relevant scientific assessments Understanding Scientific analysis, indicators Data systems Assembly and dissemination System requirements Applications/products, knowledge challenges, phenomena, EOVs, network design Observations Coordination In situ and satellite observations Global networks and global approaches Pilot Mature Concept The Effects of Climate Change on the World Oceans 4 th International Symposium, 4-8 June 2018, Washington, DC, USA Biogeochemistry Panel
22 Biogeochemistry Panel A communication and coordination service for marine biogeochemistry Institute of Oceanology of Polish Academy of Sciences, ul. Powstańców Warszawy 55, Sopot, Poland Phone: / Fax: , Biogeochemistry Panel