MOBILITY 2025: THE METROPOLITAN TRANSPORTATION PLAN 2004 UPDATE
|
|
|
- Kathryn Harrington
- 5 years ago
- Views:
Transcription
1 MOBILITY 2025: THE METROPOLITAN TRANSPORTATION PLAN 2004 UPDATE Summary Presentation January 2004 North Central Texas Council of Governments Transportation Department
2 WHAT IS THE METROPOLITAN TRANSPORTATION PLAN? Represents Blueprint for Multimodal Transportation System Responds to Adopted Goals Mobility Quality of Life Financial/Air Quality Identifies Policies, Programs, and Projects for Continued Development Guides Expenditures of Federal and State Funds
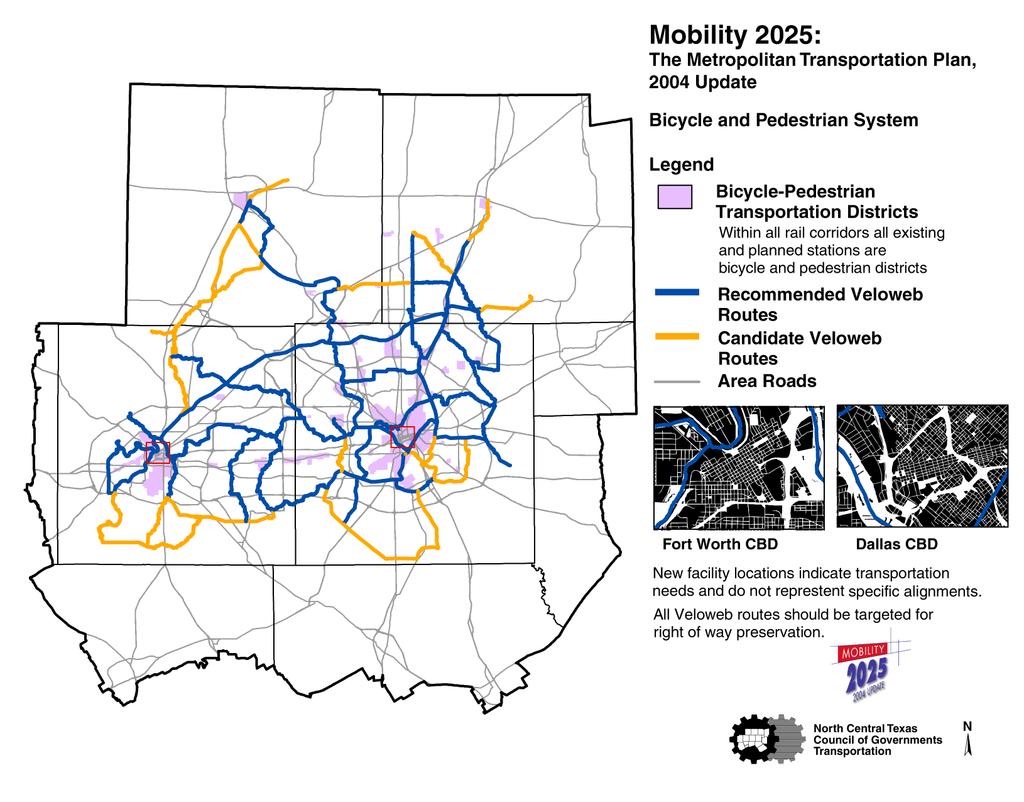
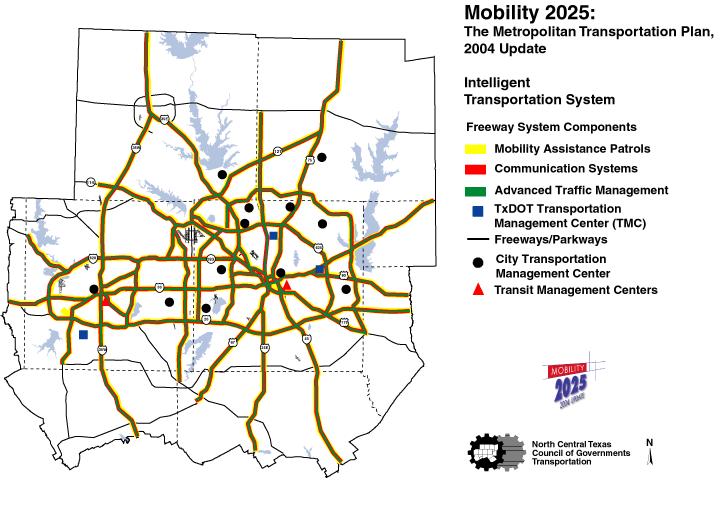
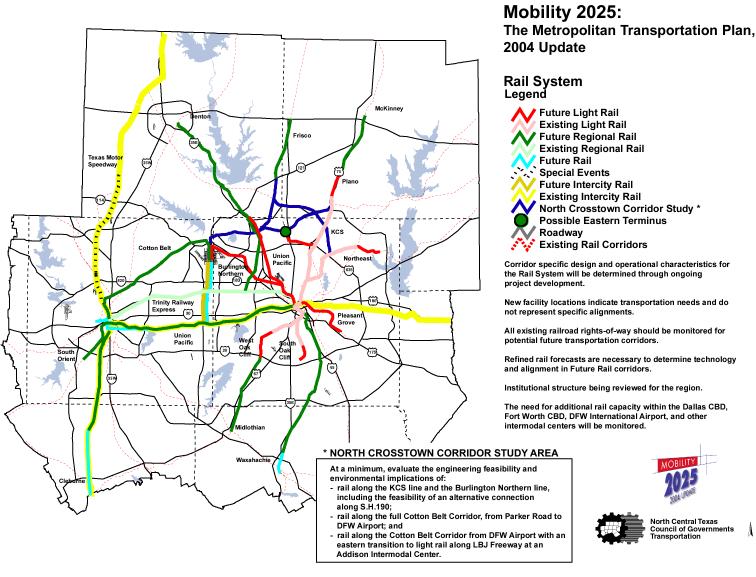
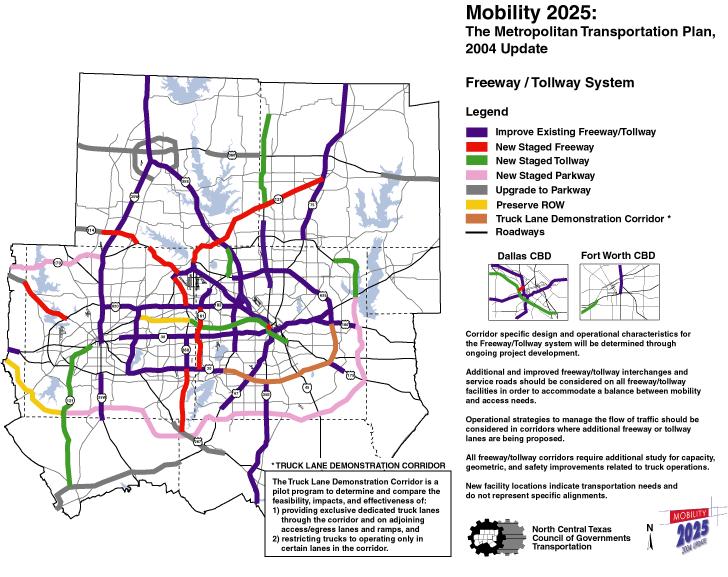
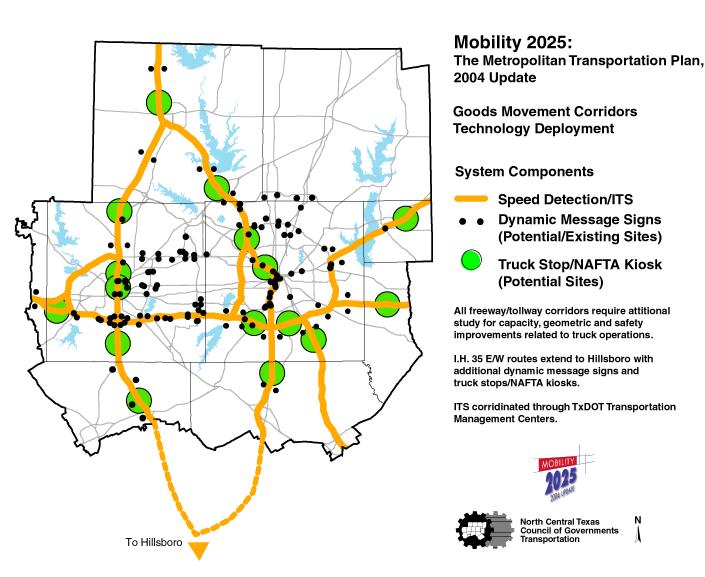
3 MOBILITY UPDATE Adopted January 2004 Identifies $45 Billion of Policies, Programs, and Projects Multimodal System Light Rail/Commuter Rail HOV/Managed Facilities Freeways/Tollways Management and Operations Transportation System Management Intelligent Transportation System Travel Demand Management Bike/Pedestrian Facilities Major Programs/Policies Sustainable Development Transportation Enhancements Air Quality Initiatives Elderly and Persons with Disabilities Public Transportation Intermodal/Freight
4 MOBILITY UPDATE Goal Summary Transportation Accommodate Expected Demographic Growth Reduce Traffic Congestion Provide Multimodal Options Improve Travel Efficiency Quality of Life Provide for Continued Economic Development Provide Increased Transportation Accessibility Reduce Environmental and Community Impacts Financial Pursue Stable, Long-Term Revenue Options Reduce Transportation System Costs Mobility 2025 Identifies Projects and Programs Which Balance These Goals
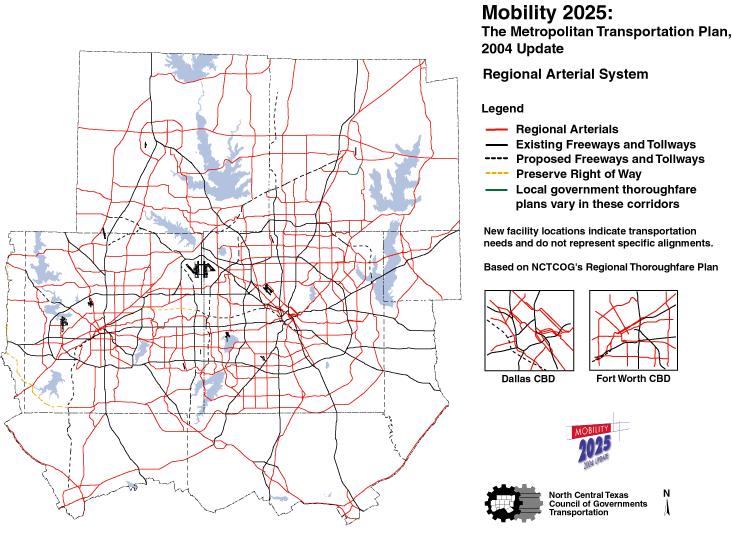
5 MOBILITY UPDATE Cost Summary Metropolitan Transportation System Components Cost (Millions/2004$) % TOTAL Operation & Maintenance $14,097 31% Congestion Mitigation Strategies $1,925 4% Bicycle & Pedestrian Facilities and Transportation Enhancements $966 2% Rail and Bus Transit System $8,875 20% HOV and Managed Facilities $1,448 3% Freeway and Toll Road System $11,925 27% Regional Arterial and Local Thoroughfare System $5,811 13% TOTAL $45, %
6
7
8
9
10
11 RTC Toll Road Policy Summary Adopted Policy - All New Freeways on New Rights-of-Way Should be Studied as Potential Toll Roads (February 1993 Policy Position) Adopted Short List of New Freeways on New ROW and Express Lanes for Toll Road Consideration (March 1994, R94-03) Agreement with NTTA to Consider Value Pricing (May 1994) and Adopted Managed HOV/Integrated Toll Road Concept as Contained in Mobility 2020 (January 1998) RTC Does Not Support Converting Existing Free Non- HOV/Managed Lanes to Toll Roads (October 2003)
12
13
14
15

 % Roadways Congested 1999 2025 % Change")
16 % Change Population 4.5 M 8.0 M 75% Employment 2.7 M 4.9 M 84% Vehicle Miles Traveled Roadway Capacity (Lane Miles) Total Delay (Veh Hrs) % Roadways Congested % Change 125 M 235 M 87% 23.2 M 34.8 M 50% 1.3 M 2.9 M 120% 38% 54% 42%
17 MOBILITY UPDATE Financial Constraint Summary (Millions, 2004 $) Metropolitan Transportation System Components System Cost Traditional Revenue Revenue Initiative Program Mobility Needs Not Met Roadway Infrastructure $5,699 $5,699 $0 - Transit Operations $8,398 $8,398 $0 - Congestion Mitigation Strategies $1,925 $1,925 $0 - Bicycle & Pedestrian Facilities & Transportation Enhancements $966 $966 $0 Rail and Bus Transit System $8,875 $5,888 $2,987 - HOV and Managed Facilities $1,448 $1,448 $0 - Freeway and Toll Road System $11,925 $9,935 $1,990 $17,230 Regional Arterial and Local Thoroughfare System $5,811 $5,811 $0 - $3,316 TOTAL $45,047 $40,070 $4,977 $20,546
18 MOBILITY UPDATE Revenue Initiative Program Continue Regional Transportation Council (RTC)/Transportation Commission Partnership Program to Leverage Available Funding Pursue Innovative Project Financing Using Tools Made Available by State Legislature, Including the Texas Mobility Fund and Bonding Authority Pursue Value Pricing Opportunities Through Managed Facilities in Specific Corridors Identified Through Feasibility Studies Decrease Project Costs Through Streamlining the Project Development Process and Value Engineering Initiatives Continue to Pursue Legislative Actions Aimed at Increasing Revenue Through Additional Initiatives Identified by the RTC Mobility Plan Finance Subcommittee
 2000 + + + + + + Over 65 Years Old 2000 + + + + + +")
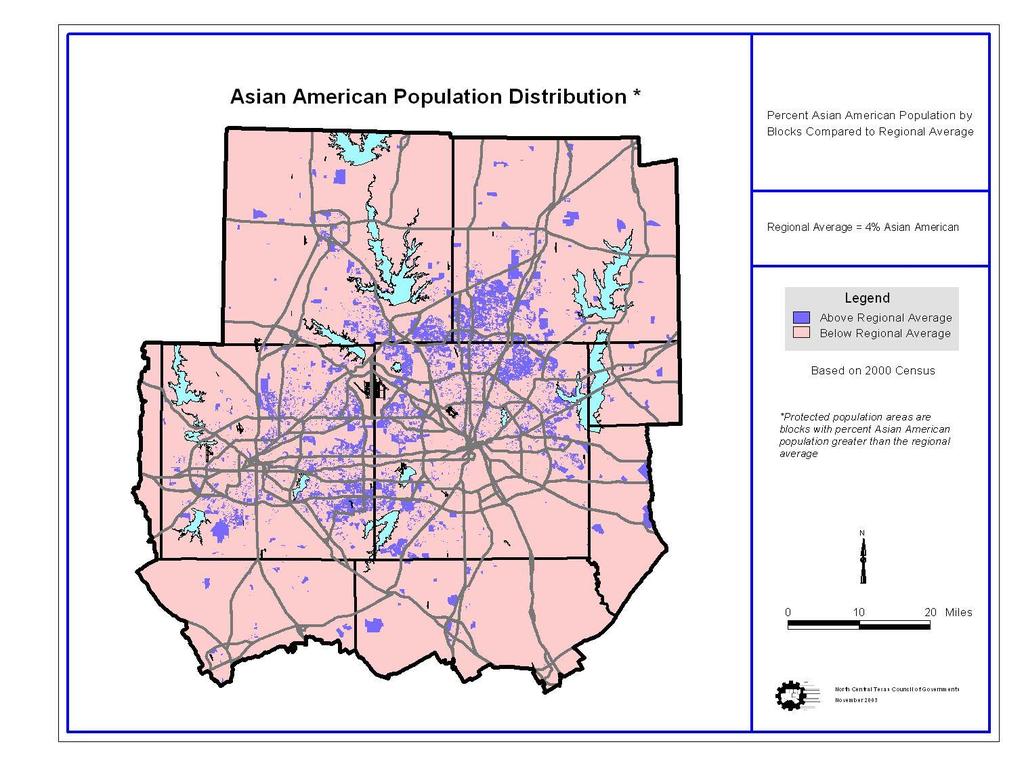
19 MOBILITY UPDATE Title VI Environmental Justice Analysis Populations Census Year Job Accessability Roadway By Auto By Transit Level of Service Black Hispanic Asian American O American Indian/Alaskan Native 2000 O O + O + O Under Poverty Line (Low Income) Over 65 Years Old Under 14 Years Old O - Persons with Disabilities Females (Head of Household) = Protected Population is Five Percent Less Relative To Unprotected Population O = Protected Population is Within Five Percent of Unprotected Population + = Protected Population is Five Percent Greater Relative To Unprotected Population
20
21
22
23
24
25
26
27
28 VOC Emissions (tons/day) TRANSPORTATION CONFORMITY 2004 CONFORMITY ANALYSIS Vehicle Emission Charts Volatile Organic Compound (VOC) Emissions 350 Attainment Demonstration SIP VOC Emission Budget = tons/day Regional Transportation Council Initiatives 14.1 tons/day Analysis Year 1 revised 12/18/03
29 NOx Emissions (tons/day) TRANSPORTATION CONFORMITY 2004 CONFORMITY ANALYSIS Vehicle Emission Charts Nitrogen Oxide (NOx) Emissions Attainment Demonstration SIP NOx Emission Budget = tons/day Regional Transportation Council Initiatives 16.6 tons/day Analysis Year 2 revised 12/18/03