Making Sense of Irrigation Scheduling: Scheduling with Moisture Sensors
|
|
|
- Flora Cook
- 5 years ago
- Views:
Transcription
1 Using Seors to Schedule Irrigation Making See of Irrigation Scheduling: Scheduling with Moisture Seors Department of Hor1culture Why? What? How? Benefits Why Use Moisture Seors? llows more effec1ve scheduling of irriga1on Directly measures the amount of water in the substrate, thus the amount available to plants Easiest method of determining plant water status Seor reliability is now very good Seor cost is down Wireless automated systems available Water Quality Issues with Improper Irrigation Bicarbonates: more irriga1on = greater change in ph Soluble salts: Too high = decreased plant quality Pes1cides: Phytotoxicity (recycled water, surface water, shallow wells) Residues: Calcium and iron deposits Fer1lizer or similar contaminants: increase soluble salts, offsite movement in runoff Pathoge & other pests: Increase inoculum, increase spread 1


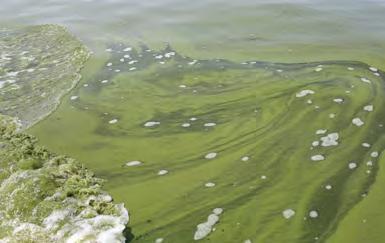
2 lkalinity (CaCO 3 ) becomes a problem when over 65 ppm Figure from US Geological Survey Figure from US Geological Survey Salt Water Intrusion Salts not just an input problem lgal bloom on Lake Erie Figures from US Geological Survey 2


3 Iron deposit on leaves Irrigation- related Management Strategies Bicarbonates: eliminate irriga1on greater than plant needs Soluble salts: apply leaching irriga1on only when necessary Pes1cides: less irriga1on = less movement and less phytotoxicity Residues: less irriga1on = less residue Fer1lizer or similar contaminants: fer1lizer remai where it s needed Pathoge & other pests: less inoculum and less movement What? Types of Moisture Seors 3


4 Wireless seor networks Volumetric Water Content Sept 3 1:18 Sept 3 7:50 Sept 3 14:22 Sept 3 20:54 Sept 4 3:26 Sept 4 9:57 Sept 4 16:29 Sept 4 23:01 Sept 5 5:33 Sept 5 12:05 Sept 5 18:37 Sept 6 1:09 Courtesy Dr. John Lea-Cox University of Maryland 4

 Treatments: 0.")

5 How? How we ve used seors How others have used seors Irrigation Hypotheses Irriga1ng based on plant use would coerve water versus a tradi1onal rate. Lower irriga1on rates would result in less nutrient loss in runoff. To a point, deficit irriga1on would have minimal nega1ve impact on plant growth or quality. pplying pes1cides followed by mul1ple days of deficit irriga1on would reduce pes1cide movement in runoff. Irrigation management projects Irriga1on rates based on plant daily water use (DWU) Treatments: 0.75 acre- inches per day (control) 0DWU: replace 0% DWU each day 0-75: replace 0% Day 1, 75% Day 2 in two- day cycle : 0% Day 1, 75% Days 2 & 3 in three- day cycle In dropped the 0.75 acre- inch irriga1on and added a ll plants in 3 gallon containers with 26 g 19 N P 7.5 K control released fer1lizer Daily Water Use Determination (DWU) Moisture measured with Theta- probe 1 Hour and 24 Hour Measurements New measurements taken ~2 weeks 5


6 20 - Present % Substrate Moisture Hydrangea arboresce 'betwo' Incrediball TM SVWC% Substrate volumetric moisture content determined with Decagon HS seors via a Campbell datalogger programmed to calculate DWU and apply irriga1on by controlling solenoid valves. Irriga1on applied based on the highest plant DWU Day Day % Substrate Moisture H. Incrediball TM Control lower than other treatments 0.32 SVWC% Hours fter Irrigation Day 6
 20 Season Plant Growth Index and Water Use 0 90 Hydrangea arboresce")

 Water (mm)")


 EC (ds m -1 ) Daily Precipitation June 1")

7 Plant Growth Plant Index Growth (cm) Index (cm) Plant Growth Index (cm) 20 Season Plant Growth Index and Water Use 0 90 Hydrangea arboresce 'Incrediball' Hydrangea paniculata 'Limelight' B ug. Oct. Jun. Jul. Sept. DWU PET Control 0 DWU Day of Treatment Water (mm) Water (mm) Water (mm) Growth Index- Hydrangea paniculata Limelight Control 0DWU cm 61.5 cm 7/29/ 62.3cm Hydrangea paniculata Limelight ; Limelight Hydrangea; 29 July cm Mea in each group showing the same letters are not signiticantly different from each other (p 0.05). Mea separated by Tukey s Test. Daily Precipitation (inches) EC (ds m -1 ) Daily Precipitation June 1 through September 30, Jun Jul ug Sep Oct Electroconductivity of Hydrangea arboresce 'Dardom' 1.2 Control 0% DWR 1.0 0a75% DWR 0a75a75% DWR cm 88.4 cm 9// 88.8 cm 80.5 cm B Jun 20 Jul 25 ug 21 Sep 21 7
 mount recovered based on 0% land use with #3 containers spaced 1.")
 recovered recovered Treatment")
 7.2 (6%) 1.7 (11%) 0-75% DWU 1.4 million 0.29 million (29%) 5.")
8 Runoff Nutrient Content Irrigation and Runoff pplica1on Rates: N = 123 lb/ac, P = 15 lb/ac (35 lb P2O5) mount recovered based on 0% land use with #3 containers spaced 1.5 j on- center over 4 months. Irriga,on Runoff volume Nitrate Phosphate pplied (gal/acre) recovered recovered Treatment (gal/acre) (lb/acre) (lb/acre) Control 2.4 million 1.04 million (43%) 12 (%) 3.1 (21%) 0% DWU 1.6 million 0.48 million (31%) 7.2 (6%) 1.7 (11%) 0-75% DWU 1.4 million 0.29 million (29%) 5.9 (5%) 1.2 (8%) % DWU 1.3 million 0.37 million (29%) 5.7 (5%) 1.2 (8%) Jun. ug. Sept. Jun. ug. Sept. 8


.")


9 Daily Water Use (acre- inch) Summary Very High High Medium Low YES- Irriga1ng based on plant use would coerve water versus a tradi1onal grower rate. YES- 30% to 70% reduc1on in water applied LSO developing groupings for plants based on water use Lower irriga1on rates would result in less nutrient loss in effluent. YES for load, NO for concentra1on Deficit irriga1on would have minimal nega1ve impact on plant growth or quality. YES- most plants similar or larger in size to control, very few smaller (4 out of 54). QULITY pplying pes1cides followed by mul1ple days of deficit irriga1on would reduce pes1cide movement in effluent.? Cost of Water McCorkle Nursery, G For 160 irriga1on events per year = $0.032 per plant Reduce water use by 30% = $0.022 per plant Reduce water use by 70% = $0.009 per plant Reduce fer1lizer leaching by 6% = $0.005 per plant Saving $ $0.028 per plant, Whoopee!! bout $225- $420 per acre Water is cheap!..at least east of the Mississippi Gardenia crop: 20,000 sq j area with 23,400 plants Reduced produc1on 1me from to 8-11 months Improved survival from % loss to zero loss Van Iersel, Chappell, Ruter, Lichtenberg, Majsztrik, U s of G and MD 9
10 Economic Impact Costs Control node $6,75 Seors $90) $3,60 Rain gauge $3,00 Base sta1on, computer & sojware $1,000 Italla1on $1,500 Total Cost $3,835 Fewer plant losses Savings/Profit $13,000 ($6.50 per plant) Time/interest (avg 6 months shorter produc1on 8%) $500 Less fer1lizer, pes1cides, maintenance, labor $7,700 Total Savings/Profit $21,200 ($0.90 per plant) Net $17,365 Van Iersel, Lea- Cox,Chappell, Ruter, Lichtenberg, Majsztrik, Belayneh; U s of G and MD Cost of Water Cheap! But not the coequences of over- irriga1on For 1 acre- inch (27,154 gallo) = $3.03 For 160 irriga1on events per year = $0.032 per plant Less shrinkage, shorter produc1on cycle, less fer1lizer applied, less fer1lizer lost, less labor, less pes1cides used = up to $0.90 per plant (remember this example is with a problem crop) Less off- site movement of water and contaminants If scheduling done properly Funding partners Use water more efficiently Retai fer1lizer where it s needed Reduces certain problems with low quality water Reduces plant losses Improves plant growth/quality Shorte produc1on cycle (greatest cost benefit) Reduces runoff volume Reduces nutrient loss in runoff