Using Long-term Estuarine Monitoring to Address Upland Land-Use Impacts
|
|
|
- Caroline Barker
- 5 years ago
- Views:
Transcription

1 Using Long-term Estuarine Monitoring to Address Upland Land-Use Impacts Derk C. Bergquist, Jordan Felber, and Robert Van Dolah Marine Resources Research Institute South Carolina Department of Natural Resources David Chestnut Bureau of Water Water Quality Monitoring Section South Carolina Department of Health & Environmental Control
2 Population Size Population Growth in SC Coastal 1,500,000 Counties 1,400,000 1,300,000 1,200,000 1,100,000 35% Increase ,000, , , Year * SC Budget and Control Board, 2005

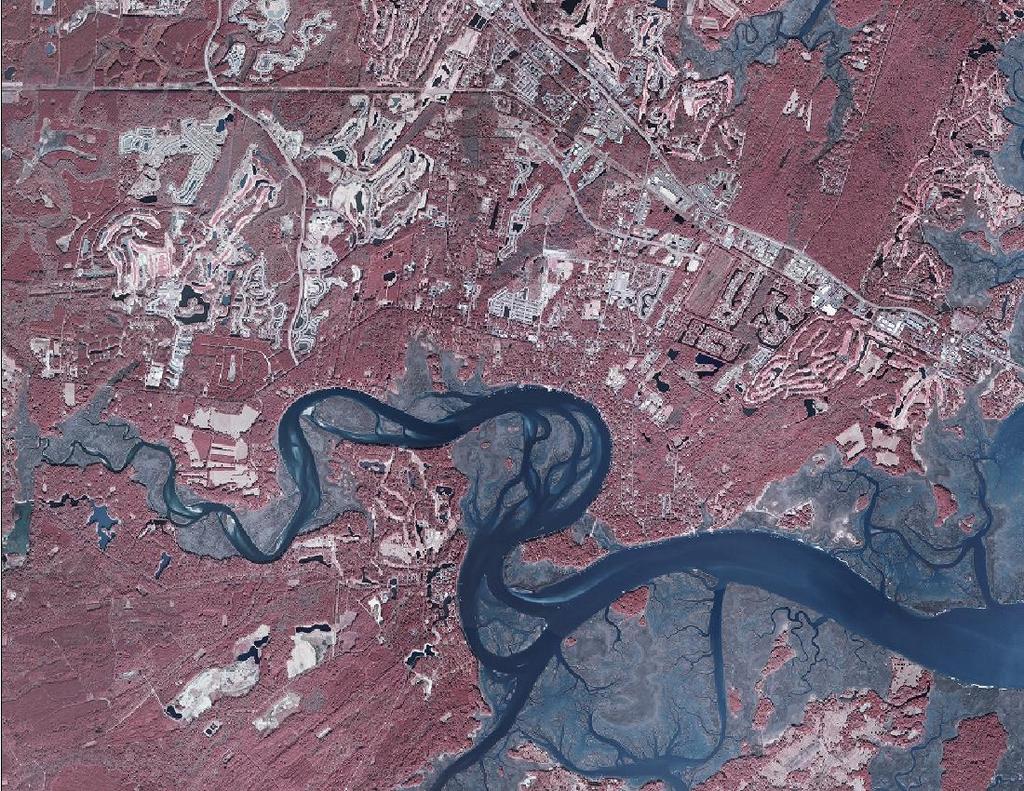
3 Land Use Change

4 SCECAP Approach Targets two major habitat types Tidal creeks, larger open water bodies Stations chosen randomly statewide Historically sampled stations / year
5 Key Parameters Water Quality Physical/Chemical --Temp, Salinity, DO, ph Nutrients --TN, TP, Chl-a Fecal Coliforms Sediment Quality Physical/Chemical --Silt/Clay, TAN, TOC Contaminants (160 analytes) Toxicity (Bioassays) Integrated Water Quality Integrated Sediment Quality Biological Condition Invertebrates (B-IBI) Phytoplankton composition Finfish and crustaceans B-IBI Integrated Habitat Quality
6 Broad Scale Land Use Effects? Georgetown Charleston Beaufort


7 Land Use and Habitat Quality at Large Spatial Scales Coastal South Carolina 14-Digit HUCs Van Dolah et al Sci. Tot. Environ. 390:

8 Water & Sediment Quality and Urban Cover Sediment Contaminants Water Land Cover Category Scrub shrub & forested wetlands Bare land Grassland & pasture & scrub shrub Deciduous & mixed forest Evergreen forest Cultivated land Urban low density Urban high density Urban combined Percent imperviousness ERM-Q PAHs PCBs Pest. Metals Fecals P < 0.05 P < 0.10 Van Dolah et al, 2008

9 A Surprise Georgetown Charleston Beaufort ACE Basin

10 Source of Degraded Habitat Quality Score ACE Basin NERR South Carolina 42% 70% Water Quality 17% 32% 26% 83% 6% 11% 24% 89% Creeks Open ACE Basin NERR South Carolina ACE Basin NERR South Carolina Sediment Quality 68% 71% 74% 75% Creeks 5% Creeks 32% 29% 21% 93% 75% B-IBI 5% 67% 20% 80% 7% 1% 24% Open 3% 4% 16% Open 30%


11 Chl-a TP TN ph Fecal Coliform Dissolved Oxygen Degraded Water Quality in the ACE Basin

12 Degraded Water Quality in the ACE Basin

13 Land Use and Habitat Quality in a Long-term Dataset Watershed vs. distance? Optimum scale for detecting land use/cover impacts? Effect of estuary characteristics?


14 Land Use and Habitat Quality in a Long-term Dataset
15 How well do methods and scales represent surrounding upland? Water bodies < 100 m wide 100 Water bodies > 100 m wide Any Upland Any Upland >10% Upland >25% Upland >50% Upland >10% Upland >25% Upland >50% Upland Buffer Radius (m) Buffer Radius (m) --Small scales miss upland -->1km similar to watersheds --Large % upland unrealistic --One scale may not fit all water bodies
16 Scale of Land Use Detection Correlation between parameters measured at station and % upland represented by urban land use Fecal Coliform Bacteria Tidal Creek Open Water Optimum scale: ~ km Buffers better than EDNA watersheds in larger water bodies Buffer Radius (m)
17 r: ERM-Q vs Med/Hi Dev. Effect of Upland Proportion Relationship between correlation strength, buffer radius, and percent of buffer area as upland Tidal Creeks (<100m) All Present >10% Upland >25% Upland >50% Radius m Radius 1000 m Radius EDNA All Stations Present >10% >25% >50% Amount of Upland --Upland improves correlations --More upland not always better --Radius often better than EDNA watershed approach
18 Summary SCECAP detecting land use impacts --Broad spatial patterns Detecting similar patterns at smaller spatial scales --Buffers ( m) --EDNA watershed scales

19 Summary Finer spatial scales are where management actions are more likely to be effective --Suburban tidal creeks --Farms and buffers SCECAP continues to collect data --Increasing spatial coverage --Long-term data set


20 Many Thanks Funding USEPA USFWS DHEC-OCRM Morgan Island SCDNR George Riekerk Marty Levisen Stacie Crowe Steve Burns Leona Forbes Collaborators William McDermott Mike Fulton Edward Wirth Jim Harvey many others.
21 How well do methods and scales represent surrounding upland? Any Upland >10% Upland >25% Upland >50% Upland Buffer Radius (m) **Lines--EDNA Watersheds
22 Scale of Land Use Detection Correlation between parameters measured at station and % upland represented by developed land cover Effects Range Median Quotient (ERM-Q) Tidal Creek Open Water Optimum scale: ~ km Buffers better than EDNA watersheds in larger water bodies Buffer Radius (m)