Modeling Infiltration BMPs
|
|
|
- Randell Smith
- 5 years ago
- Views:
Transcription
1 Modeling Infiltration BMPs CAHILL ASSOCIATES Environmental Consultants West Chester, PA (610) Design Goals for Calculations 1. Mitigate Peak Rates 2-Year to 100-Year 2. No Volume Increase for 2-Year Event 3. Maintain Groundwater Infiltration Provide Calculations for Municipal Approval 1


2 Dry Channels Eroded Streambanks Bankfull Flow Forms and Maintains Channel Recurrence Interval 1.5 Years Higher Flows Exceed Channel Capacity More Frequent Bankfull more important than large floods in shaping channel. The Channel is shaped by the Bankfull Flow 2

3 Three (Real Life) Case Studies 1. Institutional LID Penn State Visitor Center 2. Commercial Small Retail Shopping Center 3. Residential High Density Townhouse, Quad, and Singles 3
4 Proposed Development 1: Penn State Visitor Center 4.5 Acre Site 1.4 acres Impervious (31%) 15,500 Square Foot Building 2,100 Square Feet Paths 44,250 Square Feet Parking, Roads 28% for People, 72% for Cars! Penn State Case Study Existing (CN = 74): 4.55-acre meadow on HSG C soils SCS Lag Time of 18 minutes Proposed (CN = 81): Commercial Site 1.1-acres pavement & building 3.1-acres lawn 0.32-acres porous parking (CN 98 used for calcs) SCS Lag Time of 12 minutes Note: No adjustment in CN or Lag for LID design! 4

5 2-Year Volume Increase Design Storm Rainfall Existing Runoff* Future Runoff* Net Increase in Runoff Volume (in) (in) (in) (in) (ft 3 )** 1-Year ,748 2-Year ,765 5-Year , Year , Year , Year , Year ,671 * Based on Q = (P - 0.2S) 2 S= 1000/CN - 10 (P + 0.8S) ** Based in 4.55 acres 5
6 Storage Available Volume of Stone Below Invert Storage Volume* Bottom Area (min) (ft 3 ) (ft 3 ) (ft 2 ) Upper Parking Bay 4,955 1,982 3,750 Lower Parking Bay 11,374 4,550 5,225 Bioretention Infiltration Trench 1, Porous Sidewalk 0 1,500 TOTAL: 17,749 6,532 12,425 * Based on 40% void space in stone bed Design Rules of Thumb Retain 2-Year Net Increase in Volume Net Increase: 5,765 CF Available Storage before Overflow: 6,532 CF Infiltrate at a Maximum 5:1 Ratio Impervious:Infiltration Area Impervious Area: 61,000 SF Infiltration Area: 12, 425 SF Ratio 5:1 6
7 Catch Basin Control Structure in Porous Pavement For the purposes of routing, the two Storage/Infiltration Beds beneath the Porous Parking have been combined into one basin. The storage of the infiltration trench is not included. Infiltration Overflow Combined Elev Volume Discharge Discharge Discharge (ft) (ft3) (cfs) (cfs) (cfs) Infiltration Discharge is calculated assuming a conservative soil infiltration rate of 2 inches per hour over the entire bed bottom. Measured infiltration is in excess of 12 in/hr. Infil. Q = Bottom Area x 2 in/hr 12,425 SF x 2in/hr = 0.57 cfs 7
8 Time Q After Infiltration (Uncontrolled) Rate Volume into Beds Volume Infiltrated Total Storage Volume Overflow Discharge From Beds Overflow Discharge Volume hr (cfs) (cfs) CF CF CF (cfs) , , , , , , , , , , Year Storm Peak Period Summary Result 100 Year Peak Rate Before Q p = 9.8 cfs After Q p = 13.7 cfs With BMPs Q p = 7.2 cfs 8
9 Proposed Development 2: Commercial Shopping Center 3.0 Acre Site 1.5 acres Impervious (50%) 17,000 Square Foot Building 48,340 Square Feet Parking, Roads 26% for People, 74% for Cars! 9
10 Existing (CN = 58): Case Study 3.0-acre meadow on HSG B soils SCS Lag Time of 12 minutes Proposed (CN = 79): Commercial Site 1.5-acres pavement & building 1-acre lawn 0.5-acre undisturbed meadow SCS Lag Time of 6 minutes Design/Calculation Approach Size Infiltration System for Net increase in Volume for 2-year storm Mitigate Peak Rate for larger storms Compare to Typical Detention Basin Paradigm 10
11 Net increase in Volume for 2-year storm Condition Area Weighted Runoff Runoff S I a CN Q Volume (ac) (in) (in) (in) (cf) EXISTING ,341 Post-Development Pervious ,015 Impervious ,616 TOTAL POST-DEV ,631 NET CHANGE IN RUNOFF VOLUME (CF): 14,290 Stormwater Management Techniques Innovative Design 0.4 ac (17,500 SF) Porous Asphalt w/ Infiltration Beds (2 foot storage depth) Storage Volume = 14,000 CF (0.32 ac-ft) Steady-state Infiltration Rate = 2 inches/hour Modeled in HEC-HMS as a Diversion Infiltration Rate included in Stage-Storage- Discharge Table Conventional Design Detention Basin instead of undisturbed meadow (2 foot storage depth) Storage Volume = 20,000 CF (0.46 ac-ft) 11
12 Hydrologic Calculations USDA-NRCS Cover-Complex Method (TR-55) US Army Corp of Engineers Hydrologic Engineering Center Hydrologic Modeling System (HEC-HMS), Version (28 May 2003) 12
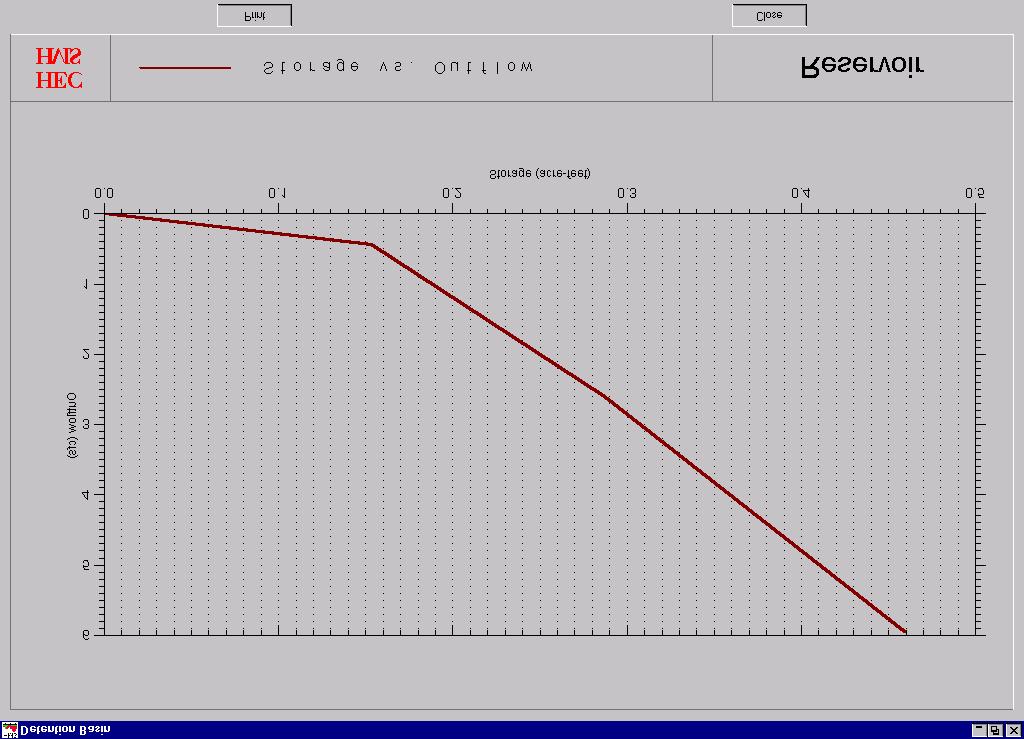
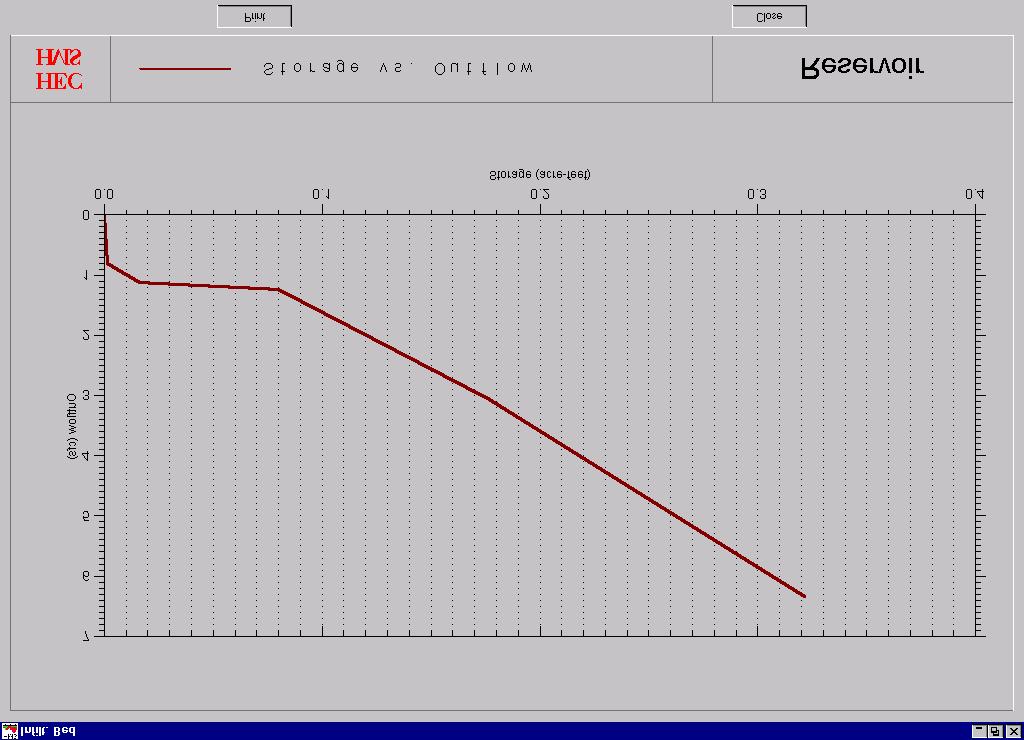
13 Stage-Storage- Discharge Curves 13

14 2-yr Storm Hydrographs (3.1 /24 hr) Flow (cfs) Post-Dev. Inflow Infiltration Bed Discharge Pre-Development Runoff Detention Basin Discharge Time 14
15 2-yr Storm Peak Rates Infiltration Bed Discharge Pre-Development Runoff Detention Basin Discharge Flow (cfs) Time yr Storm Hydrographs (4.9 /24 hr) 4 3 Post-Dev. Inflow Infiltration Bed Discharge Pre-Development Runoff Detention Basin Discharge Flow (cfs) Time 15
16 10-yr Storm Peak Rates 3 2 Infiltration Bed Discharge Pre-Development Runoff Detention Basin Discharge Flow (cfs) Time yr Storm Hydrographs (6.9 /24 hr) 8 6 Post-Dev. Inflow Infiltration Bed Discharge Pre-Development Runoff Detention Basin Discharge Flow (cfs) Time 16
17 100-yr Storm Peak Rates Flow (cfs) Infiltration Bed Discharge Pre-Development Runoff Detention Basin Discharge Time Summary Results Peak Rates Storm Frequency (year) Existing Runoff Rate (cfs) Unmitigated Post-Dev. Runoff Rate (cfs) Infiltration Bed Discharge (cfs) Detention Basin Discharge (cfs)
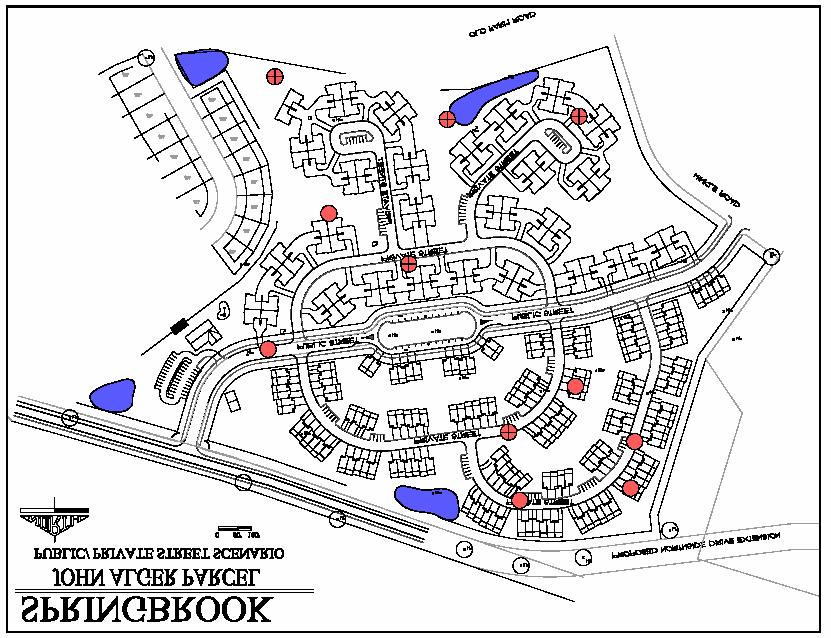
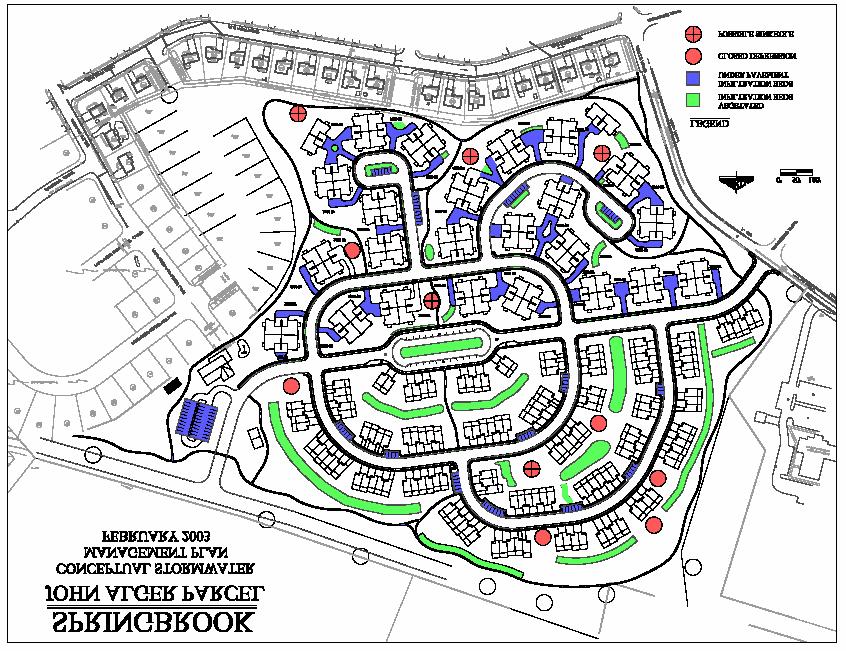
18 Storm Frequency (year) Summary Results Infiltration Existing Runoff Depth (in) Unmitigated Post-Dev. Runoff Depth (in) Total Infiltration (in) Infiltration Bed Discharge (in) Percentage of Existing Volume % % % % Storm Frequency (year) Detention Existing Runoff Depth (in) Post-Dev. Runoff Depth (in) Percentage of Existing Volume % % % % Stormwater Management for The Village at Springbrook Farms Site marked by closed depressions and some sinkholes Proposed plan consists of: Revised layout with setbacks from depressions and sinkholes Distributed infiltration system, heavily vegetated 18
19 19
20 20
21 Example Drainage Area Existing (CN = 70.6): 24 acres of Row Crops Because of Closed Depressions, only 7.5 acres discharge offsite!!! Proposed (CN = 81.3): 24 acres of townhouse development To avoid collecting stormwater in existing Closed Depressions, all 24 acres discharge offsite!!! Storm Frequency (year) Summary Results Infiltration Existing Runoff Depth (in) Unmitigated Post-Dev. Runoff Depth (in) Total Infiltration (in) Detention Infiltration Bed Discharge (in) Percentage of Existing Volume % % % % Storm Frequency (year) Existing Runoff Depth (in) Post-Dev. Runoff Depth (in) Percentage of Existing Volume % % % % 21

22 TR-55 To Estimate Peak Rate Reduction Based on Storage Volume TR-55 To Estimate Peak Rate Reduction Based on Storage Volume 22
 Unmitigated Post-Dev.")
 2 10 42.7 1 10 10 14 56.")
23 TR-55 Results Summary Results Peak Rates Storm Frequency (year) Existing Runoff Rate (cfs) Unmitigated Post-Dev. Runoff Rate (cfs) Estimated Infiltration Bed Discharge (cfs) Typical Detention Basin Discharge (cfs)

24 How we Manage Stormwater on a Site-by-Site Basis affects the entire Watershed Designing Infiltration Systems 24

25 Site Criteria Soil Permeability greater than 0.25 in./hr Minimum Bedrock Separation of 2 feet Infiltration device at least 3 feet above seasonally high water table 25
26 Spread It Out! Design Criteria 5:1 Impervious to Recharge Area Minimize excavation / maximize soil buffer Pre-treatment for hot-spots Construction oversight!! Level Bed Bottoms Keep it Clean E&S Control Construction Criteria Protect infiltration BMPs from sediment until drainage area is completely stabilized Do not compact soil under infiltration areas Protect infiltration BMPs from sediment Do not compact soil 26