A WEAP Model of the Kinneret Basin
|
|
|
- Constance Lloyd
- 5 years ago
- Views:
Transcription
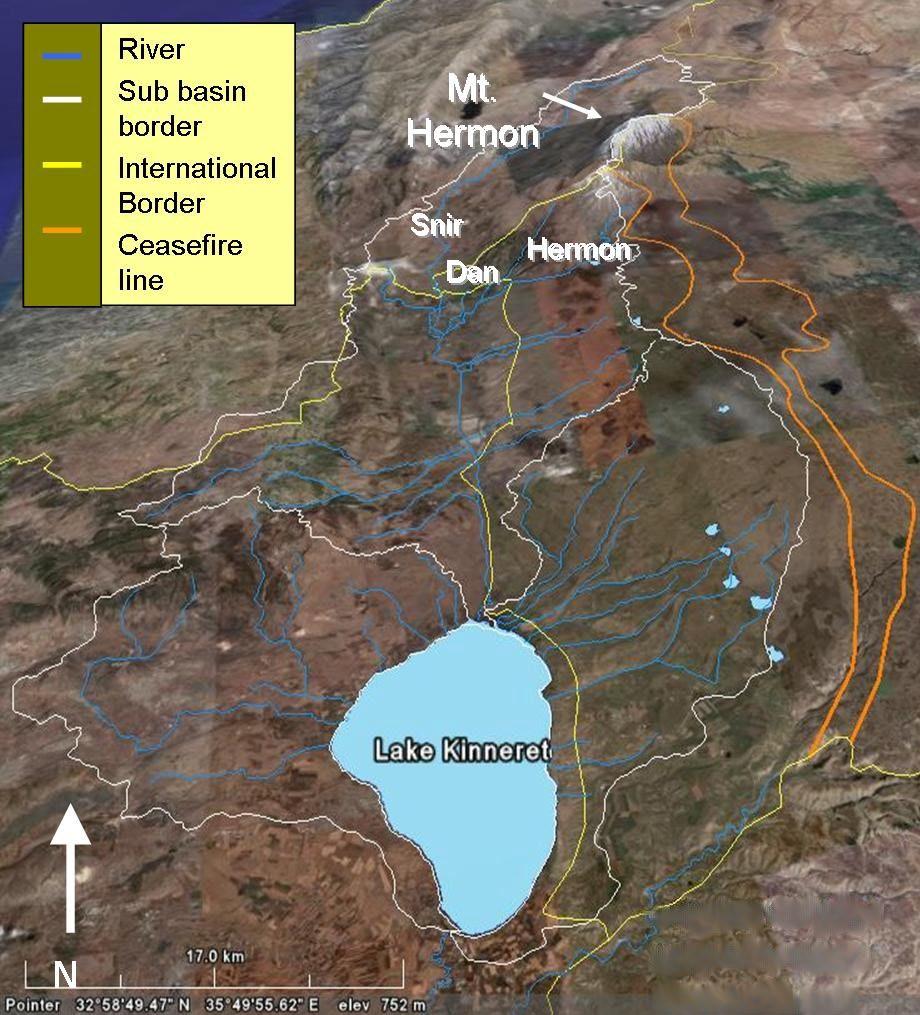
1 A WEAP Model of the Kinneret Basin Illy Sivan 1, Yigal Salingar 1 and Alon Rimmer 2 This is an English translation of the article that originally appeared in Sivan, I., Y. Salingar, and A. Rimmer, A WEAP model for the Sea of Galilee (Lake Kinneret) Basin Water resources and consumers by sub-basins, Water Engineering 53; 50-58, 2007 (in Hebrew). Introduction The Kinneret Basin is located in the north of Israel (Fig. 1). The basin marks the northern end of the Syrian African Fault. The fault forced a long and narrow basin, divided in its middle by the Jordan River (JR) with height differences of nearly 3,000 m from Mt. Hermon (peak at 2,814 m) to Lake Kinneret (LK, Lake Tiberias / Sea of Galilee; water surface at -208 m). The elevated areas receive high precipitation (1,200 mm) whereas the lower areas are semi arid (400 mm). The Kinneret Basin's total area is 2,713 km 2. In the northeast, Mt. Hermon range is the major water resource of the JR three main tributaries (Fig. 3): Snir (Hatsbani) mostly in Lebanon, Dan and Hermon (Banias). In the east, the basin's border is the Golan Heights, in the west the Eastern Lower Galilee, and in the south the lake. The basin is divided into three major sub basins: 1. The Upper Jordan Basin (UJB) the streams converge into the Upper Jordan River (UJR) and the river then flows into LK. 2. Eastern Lower Galilee comprises of several long and narrow sub basins. 3. Golan Heights its volcanic bedrock formed a plateau drained by gorges flowing west into LK. Lake Kinneret, Israel's biggest fresh water reservoir, supplying about 30% of the national water consumption, is fed by the UJR and drained southwards by the Lower JR (Fig. 2). Dganya Dam, built in 1932, controls the flow downstream south towards the Dead Sea. The UJB is the main water resource of LK (about 500 Mm 3 annually). The Hula Valley (Fig. 3) located in the center of the UJB, has most of the agriculture areas in the Kinneret Basin. Streams in east and west sub basins flow directly into LK, and their basins are referred to as "direct watersheds." Water Management The Kinneret Basin and the lake yield about 750 Mm 3 of water annually, of which 400 Mm 3 are transferred by the National Water Carrier (NWC) southwards to the center of the country and the Negev (add ref to NWC). Water resourses include, beside the lake and streams, reservoirs, springs, groundwater and, in recent years, effluents. Most of the natural water resourses in the basin are exploited. In order to maintain water quality and sustainable ecosystem, there is a great need for an accurate monitoring of water use (domestic, agriculture, municipal, etc). LK water balance is systematically monitored. Pumping restrictions do not permit pumping when water level drops below 213 m ("Lower Red Line"). The "Upper Red Line", set at m, prevents coastal flooding by allowing discharge at Dganya Dam. In other parts of the basin, data are collected for streamflow, springs discharge and consumption, but the water potential is based on estimates (Ingerman and Zonennshain, 1994; Minitzker, 1993; TAHAL 1993, 1994 and 1997). No calibration scheme has yet been formed for the local water balances throughout the basin. A scheme, based on elaborated database, will assist in planning water allocation Kinneret Limnological Laboratory, Israel Oceanographic and Limnological Research,
2 A WEAP Model of the Kinneret Basin WEAP Water Evaluation And Planning Tool operates on the basic principal of water balance (Yates et al., 2005). Closing a water balance on a monthly and yearly basis is essential for understanding the water system in the basin. WEAP is an integrative tool designed to show an overall picture of a water system (Fig.4) both in its current state and in predicted future scenarios. The main goal of a WEAP model is to serve as a decision support tool. This WEAP model was created as part of the GLOWA UJRC - an interdisciplinary project that addresses the vulnerability of water resources in the JR Basin under global climate change. An elaborated database that includes all water resources, consumptions, hydrology and physical data of the basin (topography, geology, lythology, land use, etc.) is crucial for an accurate WEAP model. The following data were compiled in the database: 1. Monthly flows, measured in 14 gauges of the major streams. 2. Monthly consumption at all consumption sites. 3. Measured and calculated data of the LK water balance on a monthly basis. 4. Monthly water volume of all major springs. A GIS was used to create a thematic database with the above layers, streams network, and the major water resources and consumers. Water Resources and Consumption LK's annual operational volume is about 680 Mm 3 - between the Upper and Lower Red Lines. The JR's estimated flow into LK is approximately 500 Mm 3. The east and west direct watersheds contribute about 90 Mm 3, and the rest is mainly winter rain and runoff. An average of 400 Mm 3 is pumped out of the lake annually, 250 Mm 3 evaporates and the rest of the water is stored in the lake or flows downstream. The UJR provides about 90 Mm 3 annually to various local water consumers along its flow. The Dan River is the UJR's biggest water contributor with an annual flow of approximately 245 Mm 3. Hermon and Snir Rivers contribute 125 and 115 Mm 3 annually. Many streams flow into the UJR, providing 70 Mm 3 annually. Other water resources are reservoirs of the Golan Heights and about 100 active springs. The biggest consumer in the basin is the NWC. Most of the water are used for agriculture in the Hula Valley. Model Assumptions This model represents a simplified and adjusted water system for the Kinneret Basin and as such, excludes some of the water system components. The model has few basic assumptions: Water resources include: streams, reservoirs and springs. Reservoirs, other than LK, were entered in the model as streams. Water is consumed in a sub basin at which a pump is located. Rain and evaporation were calculated as separate components only in reference to Lake Kinneret. For the rest of the basin, they are a part of the measured water resources. Effluents are used for irrigation, but at this stage they were not taken into account.
3 Closing a Water Balance Model calibration for streamflow at each sub basin involves a comparison of flow measurement to calculated model results. The water balance equation is: Eq. 1 ( H + S C) G = 0 Where, H is the stream's headflow volume; S stands for all spring flow in the sub basin; C represents all consumption, and G is the measured streamflow by gauges. In most cases stream headflow is calculated from the water balance. If stream head is measured, the water balance is used for calibration. In most cases the water balance does not add up, hence elements are added in order to close the water balance: Eq. 2 ( H + S C) Cadd + Neger G = 0 Where, Cadd is the additional consumptions element and Neger is runoff. Additional consumptions are added when the H value is less than zero. When the water balance equation's left side is greater than zero, Runoff is added. The use of the Cadd and Neger elements helps to differentiate measured and calculated values in the model. Their volume reflects the accuracy of measured values, such as S and C. WEAP implementation for the Upper Jordan Basin Water resources in the basin consist of 9 monitored streams and 96 monitored springs. There are accurate monthly data from the mid 1980's, and therefore the model's time frame was set for period. Water consumption includes 137 pumping stations. The WEAP model is based on the water balance Equations 1 and 2. The UJB was divided into 49 sub basin, of which 33 sub basins include consumption sites. In each sub basin, a main stream drains the surface water and springs. All consumption sites in a sub basin were combined into a single consumption node located on the main stream. The main stream in the UJB is the JR. All the collecting streams of the UJ sub basins flow to the JR. The water resources were clustered into each sub basin by placing the spring and stream nodes on top of the sub basin polygons using GIS. All spring nodes attributed to a sub basin polygon were combined into a single node, and their monthly water volume was summed by S in Equation 1. A similar method was used to combine consumptions, and the value C in Equation 1 depicts their summed monthly volumes. In cases of sub basins with a measured main stream monthly volume, the main stream's volume is represented in Equation 1 as the value G. First, water balances were calculated for sub basins where G value exists, then downstream flows of these sub basins were used as headflows in the sequential sub basins. This method was possible due to the location of gauges on the three main tributaries of the JR as well as on the JR itself (5 altogether) and an additional 4 gauges were located on the biggest secondary tributaries in the basin. When a sub basin had no G value, the calculation and calibration of its monthly stream volume was summed by using Equation 2. WEAP implementation for the Eastern Lower Galilee and Golan Heights Basins As an accurate water balance already exists for LK, it was imperative to integrate it into the WEAP model. This desire led to a generalized water balance for each of the direct watersheds. Each of their sub basins drains directly to LK, as opposed to the more linear flow of sub basins into the JR in the UJB. A generalized water balance equation for the direct watersheds is: Eq. 3 H RC + ( S SC) Cadd G = 0
4 RC stands for reservoir consumption and SC for spring and stream water consumption. G is divided into GoG for the Golan Heights and GaG for Eastern Lower Galilee. Reservoir consumption, mainly in the Golan Heights Basin, occurs upstream, as oppose to the spring and stream water consumption. Dividing the consumption into two components improves the water balance accuracy. WEAP implementation for Lake Kinneret First, it is important to define the lake's physical structure and then, the volume of the inflows and outflows. The physical structure of the lake is defined by a volume / elevation curve. Water volume in the lake V L includes a portion of water available for pumping (according to pumping restrictions specified) and a portion of a constant volume. Upper and lower red lines, set on the volume / elevation curve, determine when water is discharged. The volume / elevation curve cannot determine the rate of evaporation, E. Evaporation can cause water volume to drop below the Lower Red Line. Apart from the three main basins, water also enters LK through direct flow, D F. Direct flow can be divided into direct rainfall on LK, R (measured by 7 rain gauges), springs located on the coast of the lake, S pm (measured), springs inside the lake, S um calculated from LK water balance (Asuline, 1993), and runoff of unmonitored streams in the Golan Heights and Eastern Lower Galilee Basins, Neger. The Direct flow equation is: Eq. 4 Neger + R + S + S = D pm um F Other inflows to the lake: JR, J F (Eq. 2), Yarmuck River, Y F, Golan Heights and Lower Eastern Galilee inflows (Eqs. 3, 4). Outflows include: evaporation, water consumed by the NWC and local consumers located on the lake's coastline, C, and outflows southward through Dganya Dam, D. LK water equation is: Eq. 5 V = ( J + D + Y + GaG + GoG) ( C + E D) L F F F + Lake level is calculated by the model, and consequently how much water can be released in a given month. Calculated model results are compared to measured lake levels for calibration and evaluating the model accuracy. Create and Run Scenarios The scenarios created refer to available water and pumping potential. They are tested and compared to the model results over the same time period ( ). Some of the tested scenarios decrease stream volume in one of the Jordan tributaries, and some evaluate pumping decreases or increases in the NWC and depict its impact on the lake. Results and Discussion WEAP supports a wide range of result types, and therefore, it facilitates evaluation and comparison of a number of queries. It can test and compare both calculated results to measured data and scenario outcomes. Model Result Verification: Lake Kinneret Water Level Water level in LK, being accurate and the most comprehensive of all measured results, is the best comparison tool in the model. Model results are in good agreement with measured water level (Fig. 5). The two curves are different possible scenarios for low water level: One scenario places no pumping restriction when water levels drop below the Lower Red Line. Water levels drop because of pumping and evaporation. In the second scenario, the Lower Red Line pumping restriction is
5 kept and water level drop below it (-213 m) only due to evaporation. The second scenario causes unmet demand for water consumers (Fig. 6). A drought during the years and a shortage of drinking water caused the Lower Red Line to drop from -213 m to -214 m in the year 2000 and again to m in If the Lower Red Line was lowered it would have resulted in unmet demand of consumers pumping directly from LK. For example, up to 25 Mm 3 unmet demand in the NWC in August 2001 (Fig.6). Model Result Verification: Calculated Results of Streamflow in the Jordan River A WEAP model can track flow changes throughout a stream (Fig. 8), water volume in a reservoir, and consumption. This is useful when trying to find errors and to calibrate the model. The model's results were tested by comparing them to measured volume at two points along the JR: first, at Joseph Bridge, located downstream from the three tributaries confluence point, and second, the Pkak Bridge located downstream of the Hula Valley (Fig. 3). Streamflow, measured at the Pkak Bridge, includes surface water volume that enters the river from many tributaries and springs in the Hula Valley area. Many of the UJB pumping stations are located in the valley. The components Neger and Cadd (Eq. 2) were used to close the water balance at the Pkak Bridge. By setting them to zero, the model's quality can be evaluated. Better comparison of calculated to measured data were obtained during than during , because pumping data for the years was only partial. Neger and Cadd add only a little volume at Pkak Bridge (Fig. 7). Neger contributes more water than Cadd. The model's accuracy is diminished when water volume is higher or lower than the average. It was concluded from the model that Neger represents the water addition of unmonitored tributaries, and has a more significant addition in rainy periods. Cadd, which represents surplus consumption, is significant in times of drought, when water allocations for farmers are diminished and some may take more water then they are allowed. Scenario Analysis Scenarios refer to either water consumption or water sources. All scenarios are based on the model's time frame. The NWC is the biggest water consumer in the basin. Changing its consumption amount has a dramatic effect on water levels in LK (Fig. 9). Water levels determine the amount of water that can be discharged into the Lower Jordan through Dganya Dam. If the NWC's water demand is diminished, then more water can be released downstream, even in drought years (the dam is opened when the lake elevation reaches m). Volume reduction in each of the three tributaries can lead to water shortage throughout the basin (Fig. 10). The Dan River, the biggest resource (in terms of water volume) relies mainly on the Dan Spring. The Snir River, on the other hand, is 10 times longer than the Dan and has many tributaries and springs along its path. The effect of a small flow reduction (10%) in the Dan Spring is more significant to consumers than a bigger reduction (50%) in the Snir River flows (Fig. 10). Unmet demands were created in the time period of In those years there was a severe drought. The Dan Spring has a bigger influence on the water system than the Snir River. Conclusions The presented model of the Kinneret Basin, built with the aid of WEAP, depicts monthly and yearly streamflows and water levels in the lake accurately. The model offers an overall view of the basin and its water system, combined with an ability to identify and isolate the system's aggregated components.
6 The model can serve as a decision support tool, once it includes all the accurate measured data required, for the water management of the Kinneret Basin. Based on this model, the water system can be altered, via scenarios, to depict both present and future status. A scenario for the model's time frame can assist in detecting weak points in the system and suggest solutions. When referring to future scenarios, the model is able to predict water shortages or a change in consumptions, both locally and in the entire basin.
7 Figures Fig.1: A general view of Israel and surrounding countries. The Kinneret Basin is marks by square.
8 Fig. 2: The main water resources of Kinneret Basin.
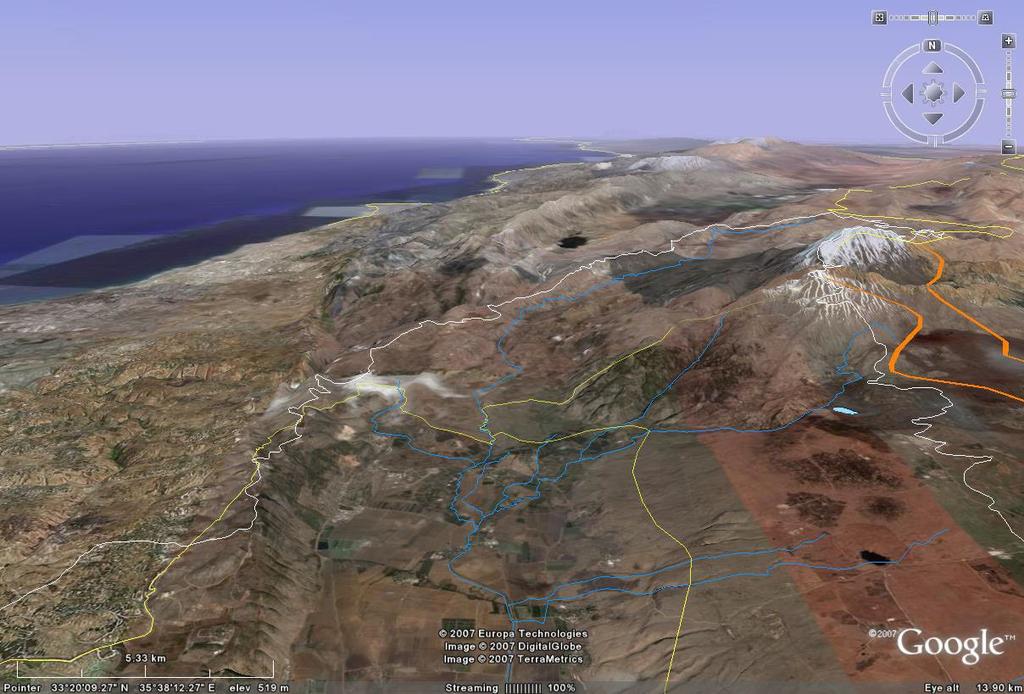
9 Fig. 3: Upper Jordan and its tributaries, Hula Valley.
10 Fig. 4: A WEAP schematic view of the water system around Lake Kinneret.
11 Fig. 5: Monthly water levels of Lake Kinneret for the model's time period. A comparison of measured data to model results: with and without imposing the Lower Red Line. Fig. 6: Unmet demand of consumers pumping from Lake Kinneret caused by imposing the Lower Red Line (Dotted Line).
12 Fig. 7: Yearly water contribution of runoff (Neger) and added consumption (Cadd) to Jordan River as measured at the Pkak Bridge.
13 Fig. 8: The WEAP model tool for streamflow monitoring. A comparison of monthly volume of the three main tributaries of the Jordan River. Streamflow in Snir River in the rainy winter of 1992 is compared to the streamflow in the summer of 2000 a drought year (black squares).
14 Fig. 9: Model results (Reference) compared to scenario results for changes in monthly pumping of the NWC. Fig. 10 Unmet demand of all pumping station in the Kinneret basin, during the drought years of Unmet demand caused by a scenario of decrease in stream volume either of the Snir or the Dan Rivers.
15