Budak Dilli, General Directorate of Energy Affairs Ministry of Energy and Natural Resources Turkey
|
|
|
- Ashlee Sherman
- 5 years ago
- Views:
Transcription


1 Budak Dilli, General Directorate of Energy Affairs Ministry of Energy and Natural Resources Turkey
2 WORLD OUTLOOK The Reference Scenario: World Primary Energy Demand Other renewables Nuclear Biomass Gas Mtoe Coal Oil Global demand grows by more than half over the next quarter of a century, with coal use rising most in absolute terms (IEA WEO 26)
3 WORLD OUTLOOK Reference Scenario: Energy Related CO2 Emissions by Fuel 5 billion tonnes Increase of 14.3 Gt (55%) Coal Oil Gas Half of the projected increase in emissions comes from new power stations, mainly using coal & mainly located in China & India
4 WORLD OUTLOOK Reference Scenario:Energy Related CO2 emissions by Region 15 Rest of non-oecd Gigatonnes of CO China United States Rest of OECD China overtakes the US as the world s biggest emitter before 21, though its per capita emissions reach just 6% of those of the OECD in 23 (IEA)
5 WORLD OUTLOOK Reference Scenario: Cumulative Investment, $2.2 trillion (in $25) Oil 21% Electricity 56% $4.3 trillion $11.3 trillion Biofuels 1% $3.9 trillion Gas 19% Coal 3% Investment needs exceed $2 trillion $3 trillion more than previously projected, mainly because of higher unit costs
6 WORLD OUTLOOK SUMMARY TWO ALTERNATIVES: UNDER-INVESTED, VULNERABLE AND DIRTY, ADEQUATELY-INVESTED, COMPETITIVE AND CLEAN 6
7 CHALLENGES: TO HAVE SUFFICIENT ENERGY TO COPE WITH THE INCREASING DEMAND IN AN ENVIRONMENTALLY SUSTAINABLE MANNER. THE ENERGY RELATED EMISSIONS IS NOT A LOCAL OR NATIONAL PROBLEM: CLIMATE CHANGE THE PROBLEMS OF DEVELOPING COUNTRIES: FASTER INCREASE, MORE ENERGY NEED, MORE EMISSIONS, EVEN MORE FINANCE NEEDED FOR EMISSION REDUCTION 7
8 Emission Reduction 45 Technologies that can reduce global CO2 emissions from energy combustion 4 Mt CO Energy savings avoided emissions 15 Fossil fuel switch 1 Renewable energies Nuclear energy 5 Carbon sequestration Emission of reduction case YES, BUT THE COST OF EMISSION REDUCTION??? 8
9 WHAT DEVELOPMENTS WİLL MAKE THE DIFFERENCE? EFFICIENCY MORE RENEWABLE ENERGY CLEAN COAL TECHNOLOGIES HYDROGEN NUCLEAR 9
10 TURKEY: Main Characteristics Of Energy Sector High demand increase rate High investment requirement Import Dependency High Energy Intensity Low Efficiency High efficiency gain potential Considerable potential of renewable sources Emerging Market 1
11 TURKEY Primary Energy Demand Projection 25 1 TOE Coal Petrol N. Gas Hydro Other Renewables Nuclear Rate of increase % 6,2 9 Mtep 222 Mtep 11

12 INCREASING CONSUMPTION 18.. OC AR 16.. ŞUB KAS MART EK 2.. NİS EY MAY 26 AĞ HAZ 27 TEM 12


13 TURKEY- Electrical Energy Demand Projection (26-22) 6 TWh 5 High Case Low Case ,2 1 YIL


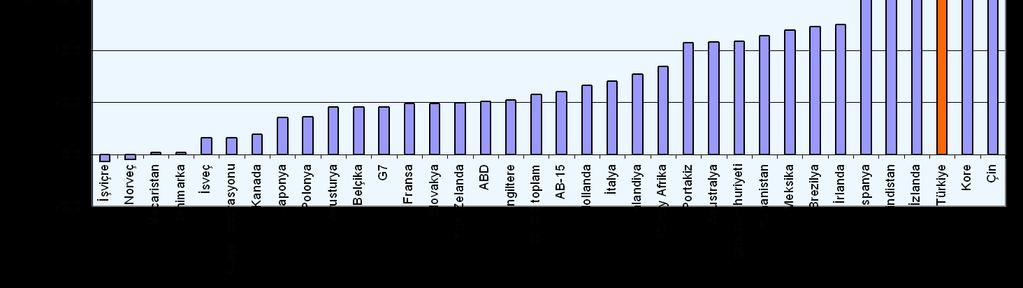
14 TURKEY: ELECTRICITY CONSUMPTION COMPARISON (21 26) 12 1 % 97, ,5 8,2 22,1 43,4 11,4 27,2 27,6 OECD EU DÜNYA TÜRKİYE RUSYA ÇİN HİNDİSTAN BREZİLYA Enerji İşleri Genel Müdürlüğü (Kaynak: IEA) 14

15 % INCREASE IN ELECTRICAL ENERGY CONSUMPTION 15
16 Electricity New capacity requirement (22) High scenario ~ 56. MW additional capacity need Low scenario ~ 4. MW additional capacity need Installed capacity in 22 Additional Capacity (MW) Existing Capacity (MW) MW 8 29 MW Low Demand High Demand 16
17 Investments in Energy Sector Estimation up to 22: Power Generation, Transmission, Distribution Natural Gas...2,5 Billion $ Coal.5 Billion $ Petroleum..16 Billion $ ~15 Billion $ New Power plants, rehabilitation, Pipelines, Natural gas storage 17
18 Import Dependency 25 production and import SHARE OF IMPORTS AND PRODUCTION PROJECTION % % Production import Production Business As Usual Case Net Import 18
19 Energy consumption Some Comparisons Germany- Turkey Primary Energy Consumption (199-22) (IEA) Germany-Turkey Electric Generation(199-23) kaynak:iea Mtpe Türkiye 53,1 75,58 78,95 125,59 222,27 Almanya 356, ,1 337,4 38,6 Twh Türkiye 57,54 129,4 141, ,2 481,38 Almanya 547,7 566,9 594,3 622, ,5 19
20 ENERGY AND EMISSIONS: GROSS CONSUMPTION Emission (millon ton CO 2 -eq) Emission per Capita ,5 17,1 3, ,7 296,6 4,13(*) % (*)World Average: 4.24, OECD Average:
21 EMISSION SCENERIOS: Milyon Ton Reference Low Demand DSM Wîthout Nuclear
22 POLICIES Energy security New investments to cope with increasing demand Reduce import dependency, diversification Increase the utilisation of Local Sources Establishing Functioning markets based on competition Environmental sustainability : Renewable Energy: Wind, Hydro, Geothermal, Solar, Biofuels Clean Coal Technologies, Carbon Capture & Storage Efficiency Increase Nuclear Energy (5 MW until 22) UNFCC (Turkey became a Party in 24) 22
23 Renewables Second largest contributor to the primary production In 26 12% of TPES was supplied from renewable sources 25% of total electricity production was from renewable sources (43736 GWh) Aim: to keep and further increase renewable share in energy balance (8 % increase in supply from renewables until 22 ) Utilization of the remaining hydro resources until % being utilized at present, 18% under construction (Total 35 MW, Today 13 MW) > 1 MW Additional Wind (Today 25 MW, 5 MW under Construction)) 23
24 NEW INVESTMENT : LICENCED PROJECTS TTOAL:17766 MW TOTAL: 2378 MW (MARCH 28) THERMAL MW TOTAL:5312 MW 1672 HYDRO LICENCED TO BE LICENCED WIND 24
25 NEW PROJECTS, EXPECTED COMMISSIONING YEARS 45 4 MW 35 THERMAL HYDRO WIND
26 Energy Efficiency Energy conservation potential up to the 3% was defined in end use sectors. Energy Efficiency Law was adopted in the Turkish Grand National Assembly, To increase the energy efficiency awareness through media, training in schools, contest, informative billing etc. To set up administrative structure and mechanism for energy efficiency services To promote the energy services activities in the market To promote renewables and cogeneration for the protection environment (Cogeneration installed capacity: 4476 MW, i.e. 11% of total installed capacity as of April 27.) Incentives and obligations to decrease energy intensity Demand side measures, incentives Measures for production & supply 26