WATER-ENERGY NEXUS: AN ANALYSIS OF THE BANGKOK WATER SUPPLY SYSTEM, THAILAND
|
|
|
- Della Bradford
- 5 years ago
- Views:
Transcription
1 WATER-ENERGY NEXUS: AN ANALYSIS OF THE BANGKOK WATER SUPPLY SYSTEM, THAILAND Prof. Mukand S. Babel and Ms. Kanchanapun Anusart Asian Institute of Technology Thailand 3G IWRM Conference 22 November 2012
2 Introduction Study Area Methodology Analysis, Results and Discussion Conclusions Recommendations 2 Contents
3 Extraction & Refining Fuel Production (Ethanol, hydrogen) Wastewater Treatment Energy Associated with Uses of Water Water-Energy Nexus Water for Energy Energy for Water Hydropower Thermo electric Cooling Extraction and Transmission Drinking Water Treatment Water Supply System Source Conveyance Treatment Distribution End-user 3 Background


4 GHG Drought Kilo Barrel/Day THAILAND Energy Consumption ( ) 2,400 1,800 1, Flood 4 Problem Statement
5 Objectives of the Study To evaluate the energy consumption in MWA s water supply system To estimate energy consumption by end-user (customer) in a selected pilot area To develop a hydraulic model for evaluation of alternatives to conserve water and energy consumption in the selected pilot area 5 Objectives
 Service area 2,400 km 2 16")

6 Metropolitan Waterworks Authority (MWA) Service area 2,400 km 2 16 branches 913 DMAs 8 million population served 4.76 MCM per day 6 Study Area

7 DMA MWA DMA Supply Process Treatment Plant: Bangkhen Water Treatment Plant Pumping Station: Prachanukul Pumping Station Service area: DMA Prachachuan Branch DMA Area 0.76 km 2 1,310 connections Avg. pr m Water loss 34.27% 7 Study Area (Pilot area)
8 8 Methodology
9 Bang Len Mae Klong River Samlae Chao Phraya River Raw Water Canal Bang Sue Raw Water Pipe Raw Water Canal Raw Water Canal Raw Water Intake Mahasawat Thonburi Samsen Bang Khen Tunnel Tunnel Water Treatment Plant Mahasawat Bang Khen 03 Bang Khen 04 Phetchakasem Phahonyothin Lumpini Tha Pra Phrachanukul Sam Rong Ratchaburana Min Buri Lat Praow Bang Pli Lat Krabang Klong Toey Water Distribution 9 MWA Water Supply System
10 Average Water Volume in Each Stage of MWA MWA Water Supply Stage Average (Fiscal Year ) Volume (10 6 m 3 ) % Proportion Per capita (L/day) Raw Water Intake 1, Losses in Raw Water Canal Water Treatment 1, Losses in Treatment Process Water Distribution 1, Water Production 1, NRW Water Sales 1, Remark: Fiscal Year 2004 (Oct 2003-Sep 2004) 10 MWA Water Production

11 Water Production and Energy Use in Each Stage of MWA 11 MWA
 0.0097 0.0469 0.0961 0.0811 0.")
12 Percentage of Energy Consumption in Each Stage of MWA Average ( ) Raw Water Intake Water Treatment Water Transmission Water Distribution Energy Use (kwh/m 3 ) Total 12 MWA Energy Consumption

")

 M6 School 2 0.")
13 Household Characteristics Respondent Category Household Category Description Respondent % M1 Residence M2 Company, Shop Condominium (Bulk) Residence (Bulk) M4 Restaurant M5 Institution Tank Sources of Data - Survey - MWA (Water Bill) M6 School M7 Construction Total DMA Pump 13 Household Survey
14 Household Characteristics (216 sample) Characteristic Range Average Most No. of people per connection (person) Building storey (floor) Water bill (baht) Tank capacity (litre) Pump capacity (watt) Pump cost (baht) Pump life (year) Maintenance - Pump life (year) Maintenance - cost (baht) % M1, M % M1, M2, M ,176 1, % M1, M2, M4, M ,000 2,725 1,000 39% M1, M2, M , > % M1, M2, M3 3,500-80,000 7,842 5,000 53% >4-8 45% M1, M2, M4, M6 M1, M2, M4, M % M1, M ,000 1, % M1, M2 14 Household Survey
15 Distribution type Range Average Most % Proportion Type A (floor) Type B (floor) Type C (floor) Type D (floor) % M % M1, M2, M % M1, M2, M4, M % M Household Distribution Type
16 Household Characteristics by Customer Type Characteristic M1 (127) M2 (79) Type of customer (216) Persons per connection (no.) M4 (2) M5 (4) M6 (2) M7 (2) Building Storey (no. of floor) Avg. Building Height (m) Pump Capacity (watt) Total Pumping Duration (h) Total Water Sales (m 3 /month) Avg. Water Sales (m 3 /month) ,000-10, ,499 15, , , Energy Consumption in Household
17 Household Energy Consumption in Study Area Average Household Energy Consumption (kwh/m 3 ) Type of Customer M1 M2 M4 M5 M6 Average Case Case Case Case Remark: Case 1: Energy use based on number of pumping hour from field survey Case 2: 50% of case 1 Case 3: 75% of case 1 Case 4: 125% of case 1 17 Energy Use in Household

 Utility Raw Water")


18 Energy Consumption for Producing Tap Water Case Study: DMA Process Energy Use (kwh/m 3 ) Utility Raw Water Intake Water Treatment % Water Distribution Customer End-User (Pump) % Total % Remark: Case 1: Energy use based on number of pumping hour from field survey 18 Energy Consumption
19 Energy Consumption for Producing Tap Water Case Study: DMA % Proportional Energy Use Case MWA Customer Remark: Case 1: Energy use based on number of pumping hour from field survey Case 2: 50% of case 1 Case 3: 75% of case 1 Case 4: 125% of case 1 19 Energy Consumption

20 Development of Network Modeling Information for Modeling Description Pipe Length km No. of Pipe No. 316 Pipe Diameter mm 25, 50, 100, 150, 200, 300 Pipe Material - AC, DI, GI, PB, PVC, ST Installation Year year Valve - FCV Metered connection no. 1,310 No. of Inlet point 1 No. of Outlet point 0 Type of Customer Avg. Base Demand (m 3 /day) M1 Residence 1.03 M2 Residence and Condominium (Bulk), Company, Shop 3.77 M4 Nightclub, Restaurant 2.23 M5 Institution, Official Place M6 School M7 Construction 2.38 Basic Information Base Demand 20 Water Distribution Network Modeling
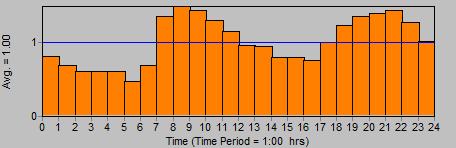


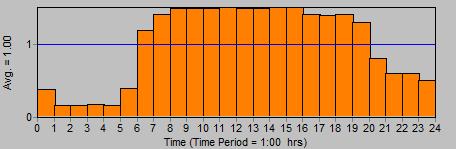

21 Development of Network Modeling Demand Pattern M1 M5 M2 M6 M4 M7 21 Water Distribution Network Modeling


")


22 Field Measurement for the Calibration 4 Mobile Pressure Sensors (MPS) MPS No. Pressure (m) Minimum Maximum Average Field Measurement
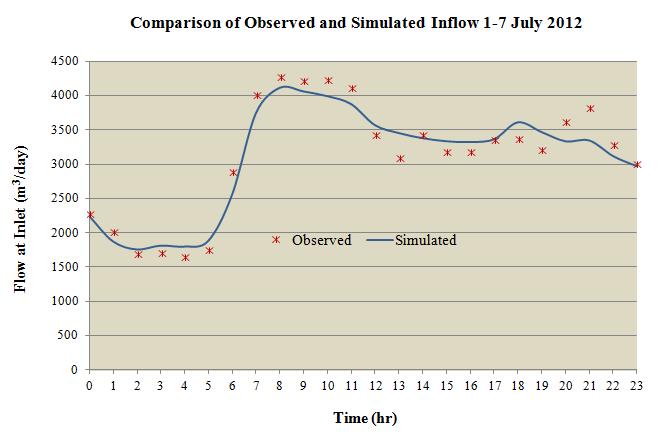
23 Head Loss Formula: Hazen-Williams, h L = Aq B Calibrated Parameter Pipe Material Pipe Age (Year) Pipe Roughness Coefficient AC DI GI PB PVC ST Area Average Pipe Age (Year) Emitter Coefficient MPS MPS MPS MPS Model Calibration
 Remark: Data obtained 21-31 July 2012 24 Model")
24 Comparison of Observed data and Simulated Results Inflow to the system (DMA ) Remark: Data obtained July Model Calibration


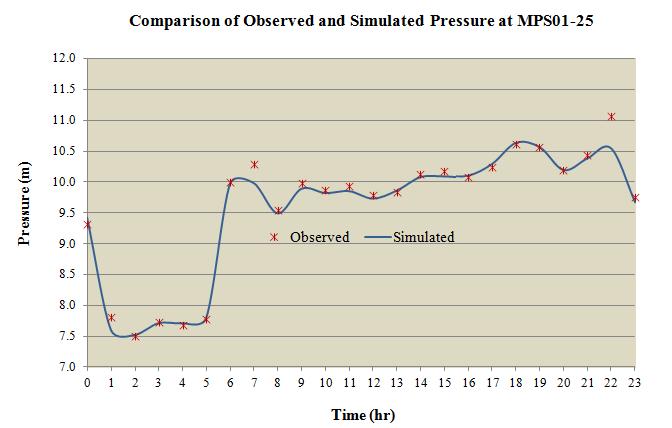
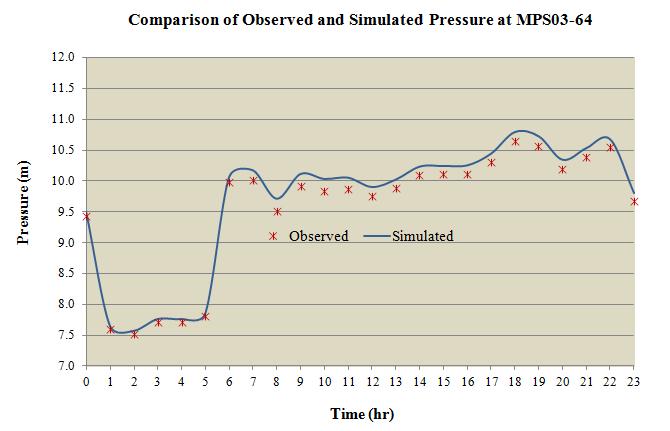
25 Pressure at 4 Sampling Locations (MPS Installations) Remark: Data obtained July Model Calibration

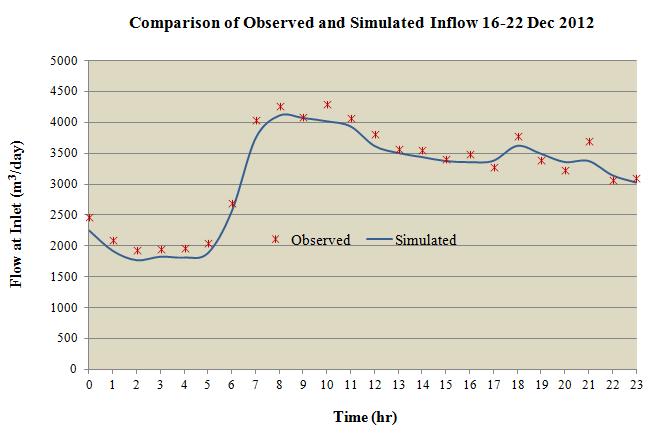
26 Flow at DMA Inlet 26 Model Verification


27 Pressure at DMA Inlet 27 Model Verification
28 Alternative Description A0 Base case Minimum service pressure 7.5m with 100% base demand A1 A2 A3 A4 A5 Pressure management (Decreasing Service Pressure) Demand management (Decreasing Base Demand) Energy Generated (Decreasing Service Pressure with Turbine generator) Pressure management (Increasing Service Pressure) Pressure management (Increasing Service Pressure with PRV) Minimum service pressure decreased to 3, 5, 6 and 7m with 100% base demand Base demand decreased to 80 and 90% with minimum service pressure 5, 6, 7 and 7.5 m Hydro turbine generator used to generate energy with minimum service pressure of 5, 6 and 7m and with 80, 90 and 100% base demand Minimum service pressure increased to 9, 12, 15, 18 and 21m with 100% base demand PRV used in order to fix the minimum service pressure of 12, 15, 18 and 21m with 100% base demand 28 Alternatives
29 Alternative 1 Alternatives Description A0 Base case Minimum service pressure 7.5m with 100% base demand A1 Pressure management (Decreasing Service Pressure) Minimum service pressure decreased to 3, 5, 6 and 7m with 100% base demand 29 Alternative 1
30 Alternative 1 30 Alternative 1
31 Alternative 2 Alternatives Description A0 Base case Minimum service pressure 7.5m with 100% base demand A2 Demand management (Decreasing Base Demand) Base demand decreased to 80 and 90% with minimum service pressure 5, 6, 7 and 7.5 m 31 Alternative 2
32 Alternative 2 32 Alternative 2
33 Alternative 3 Alternatives Description A0 Base case Minimum service pressure 7.5m with 100% base demand A3 Energy Generated (Decreasing Service Pressure with Turbine generator) Hydro turbine generator used to generate energy with minimum service pressure of 5, 6 and 7m and with 80, 90 and 100% base demand 33 Alternative 3
34 Alternative 3 34 Alternative 3
35 Energy Generated Sub-Alternatives *Pressure (m) Base Demand (%) Energy Generated (kwh/day) A A A A A A A A A Remark: *Pressure - Minimum Service Pressure at Critical Point 35 Alternative 3
36 Alternative 4 and 5 Alternatives Description A0 Base case Minimum service pressure 7.5m with 100% base demand A4 A5 Pressure management (Increasing Service Pressure) Pressure management (Increasing Service Pressure with PRV) Minimum service pressure increased to 9, 12, 15, 18 and 21m with 100% base demand PRV used in order to fix the minimum service pressure of 12, 15, 18 and 21m with 100% base demand 36 Alternative 4 and 5
37 Alternative 4 and 5 *Pressure (m) Floor (s) % Water Consumption with Pump % No. of Customer with Pump 3 a a a a a a a a a a a a a a a a a a a a a a a a a a a a a a a a a a a a a a a a a a a a a r a a a a a a a a r r a a a a a a a r r r a a a a a a r r r r a a a a a r r r r r a a a a Alternative 4 and 5
38 Alternative 4 38 Alternative 4
39 Alternative 5 39 Alternative 5
40 Alternative 5 40 Alternative 5
41 Water Conserved Alternatives *Pressure (m) Base Demand (%) Water Conserved (m 3 /day) A Alternative 1 A Alternative 2 A Alternative 3 A Alternative 4 A Alternative 5 A Remark: *Pressure - Minimum Service Pressure at Critical Point, Negative value in water conserved means water leakage has been increased. 41 Water Conserved
42 Energy Conserved Alternatives *Pressure (m) Base Demand (%) Energy Conserved (kwh/day) A Alternative 1 A Alternative 2 A Alternative 3 A Alternative 4 A Alternative 5 A Remark: *Pressure - Minimum Service Pressure at Critical Point 42 Energy Conserved
43 Relation of Energy Consumption by Pressure Energy Conserved

44 Best Alternative in term of Energy Consumption (kwh/m 3 ) Alternatives *Pressure (m) Base Demand (%) Utility % of Reduction Energy Consumption (kwh/m 3 ) Costumer % of Reduction Total % of Reduction A Alternative 1 A Alternative 2 A A Alternative 3 A Alternative 4 A Alternative 5 A Remark: *Pressure - Minimum Service Pressure at Critical Point 44 Energy Conserved
45 The total energy use by MWA water supply system is kwh/m 3 with distribution: Raw water intake: (4%) Water treatment: (20%) Water transmission: (41%) Water distribution: (35%) Total energy used from raw water to tap varies from 0.46 to 0.79 kwh/m 3 depending on the pumping hours by customers. The energy input by MWA and customers vary from 22 to 39% and 61 to 78% respectively. As expected, lower pressures can conserve more water due to the reduced leakage. More energy can be conserved if the service pressures are increased. A reduction of 32% (from 0.68 to 0.46 kwh/m 3 ) in energy consumption can be achieved with 18m service pressure using PRV. 45 Conclusions
46 For MWA - Water loss reduction will be achieved with these approaches: - Reducing pressure - PRV installation - Awareness of decreasing in base demand - Hydro turbine generator can reduce and also generate energy - Customer satisfaction - Increasing service pressure - Reducing the use of pumps by customer Further Study - Develop the hydraulic modeling from Pumping Station to DMA; Pressure Management in Large Scale - Additional Surveying for more reliable data 47 Recommendations
47 THANK YOU 48 End of Presentation