REPORT OCEANOGRAPHY No. 54, Swedish National Report on Eutrophication Status in the Skagerrak, Kattegat and the Sound
|
|
|
- Allen Dominick Gibbs
- 5 years ago
- Views:
Transcription


1 REPORT OCEANOGRAPHY No. 54, 2016 Swedish National Report on Eutrophication Status in the Skagerrak, Kattegat and the Sound OSPAR ASSESSMENT 2016
2 Front Page: Swedish water assessed in the OSPAR Common Procedure Red: Problem Areas, Green: Non-Problem Areas. ISSN: SMHI
3 Author: Client: Report No: Karin Wesslander et al Havs och Vattenmyndigheten 54, 2016 Control date: Controller: Dnr: Version: Lars Andersson 2015/2169/ Philip Axe REPORT OCEANOGRAPHY No, 54, 2016 Swedish National Report on Eutrophication Status in the Skagerrak, Kattegat and the Sound OSPAR ASSESSMENT 2016 Author SMHI Norrköping Client Havs och Vattenmyndigheten Box Göteborg Contact Karin Wesslander Contact Philip Axe Classification (x) Public Keywords OSPAR, assessment, eutrophication, Skagerrak, Kattegat Co-authors Karin Wesslander, Lars Andersson, Philip Axe, Johannes Johansson, Johanna Linders, Nils Nexelius, Ann-Turi Skjevik
4
5 National Report Summary Outcome of COMP3, compared with COMP2 Swedish water assessed in the OSPAR Common Procedure Red: problem areas, Green: Non-problem areas. In the third Swedish application of the Common Procedure, COMP3, the open sea Skagerrak is classified as a Non-Problem Area with regard to eutrophication. All other (nine) assessment units are Problem Areas. The distribution of problem areas and nonproblem areas are the same as in the second Swedish application of the Common Procedure, COMP2. In the first application of the Common Procedure, COMP1, all assessment units were classified as Problem Areas. Concentrations of dissolved inorganic nitrogen (DIN), dissolved inorganic phosphorus (DIP), total nitrogen (TN) and chlorophyll-a have decreased in most areas, although trends in DIP were not statistically significant (95% level). Concentrations of silicate, particulate organic carbon (POC) and total phosphorus (TP) had increased. Secchi depth (a measure of water clarity) increased in most areas. Oxygen deficiency remains a problem in the fjords and in the Kattegat open sea. The observed improvements, while insufficient to achieve a change to Non-Problem status, may be attributed to reduced nutrient loads. Inputs of TN and TP from land to the Skagerrak, Kattegat and Sound have decreased. Atmospheric nitrogen inputs to both the Skagerrak and Kattegat have also decreased. Description of area The Kattegat (including the Sound) and the Skagerrak have surface areas of about and km 2 and mean depths of 22 m and 210 m respectively. They constitute the outer part of the estuarine transition zone between the brackish Baltic Sea and the oceanic North Sea.
6 The Skagerrak is a fjord with a sill depth of 270 metres and a maximum depth of about 700 metres. It has an almost permanent cyclonic circulation and receives water from three different sources: Kattegat surface water enters from the south (Andersson and Rydberg, 1993), Atlantic water enters along the west side of the Norwegian Trench to form intermediate and deep water (Furnes et al 1993) while a mixture of North Sea waters enters from the west and south-west via the Jutland current. Low salinity water here indicates recirculation of Baltic water or high river discharges in the southern North Sea. The main river input is from the Glomma River (700 m 3 /s) which enters the sea just north of the Swedish / Norwegian border. The Kattegat has two-layer stratification, with the halocline found at a depth of 15 m. The deep water consists of Skagerrak water while the surface water is a mixture of entrained deep water and brackish water from the Baltic. The proximity of the halocline to the sea floor makes the southern and western Kattegat particularly susceptible to hypoxia. The main river input is from the Göta River (575 m 3 /s), just at the border between the Skagerrak and Kattegat. As the general circulation along the Swedish west coast is northward, most of the river water is mixed into Skagerrak coastal water north of the mouth. Coastal waters typically have a high salinity range, are stratified with a shallow halocline and are influenced by surface water. Tidal effects are minimal. The Skagerrak is governed by trans-boundary transports from the North Sea of mainly nitrogen but also phosphorus. The Kattegat receives trans-boundary nutrients to its surface waters from the Baltic Sea through the Sound and Belt Sea, while the deep water receives nutrients from the Skagerrak. Assessment procedure The Common Procedure was applied to the Swedish Greater North Sea EEZ (HVMFS 2012:18). Coastal waters were defined as waters within one nautical mile of a line connecting the outermost archipelago (skerries) off the coastline (NFS 2006:1), divided into 8 water types as per the Swedish implementation of the Water Framework Directive (Anon, 2000). The assessment used national and regional monitoring data and was based primarily on winter nutrient, chlorophyll-a and oxygen concentrations as well as macrophytes, phytoplankton and zoobenthos. National assessment levels were used according to HVMFS 2012:18 for the open sea and HVMFS 2013:19 for coastal waters. Trends were analysed for two time periods; and Results from the WFD 2015 assessment were used for macrophytes and no new assessment was made. To consider the confidence rating of the assessment the cumulative probability of the binomial distribution which is based on percentiles were used (A6 in Annex 8 in OSPAR 2013). There are differences between the three applications of the Comprehensive Procedure, both in assessment levels for some of the assessment units and parameters but also how data have been aggregated geographically. In the first and second applications, the assessment area was aggregated into only four units: Skagerrak and Kattegat open sea and Skagerrak and Kattegat coastal waters. In the present application, these four units have been divided into nine smaller units and been complemented with one (The Sound). The smaller size of the assessment units imply that the assessment, for especially coastal units, can better be related to the adjacent land area.
7 Improving future assessments Future COMP applications can be improved by improved nutrient budgets and also by the use of satellite-data for chlorophyll estimates. Increased knowledge will allow assessment levels to be further improved and interactions between apparent eutrophication symptoms and other environmental pressures, such as climate change, ocean acidification and fisheries, to be clarified.
8
9 Table of contents 1 SUMMARY INTRODUCTION DESCRIPTION OF THE ASSESSED AREA METHODS AND DATA Inventory of available data for the overall area assessed and sub-areas Inputs from land Inputs from the atmosphere Trans-boundary transports Physical-chemical and biological data Methods for consideration of environmental factors in the assessments Meta-data and reporting of monitoring data to the ICES database EUTROPHICATION ASSESSMENT Parameter-related assessment based on background concentrations/levels and assessment levels Category I (nutrient enrichment) Category II (direct effects) Category III (indirect effects) Category IV (other possible effects) Overall assessment Skagerrak open sea Inner coastal waters of the west coast. North. Water type 1n West Coast Fjords. Water type Skagerrak Outer Coastal Waters. Water type Kattegat open sea Inner coastal waters of the west coast. South. Water type 1s Outer coastal waters of Kattegat. Water type Coastal waters of southern Halland and the northern Sound. Water type Coastal waters of the Sound. Water type Göta river and Nordre river estuary. Water type Comparison with preceding assessment... 39
10 5.4 Voluntary parameters COMPARISON AND/OR LINKS WITH EUROPEAN EUTROPHICATION RELATED POLICES OSPAR COMMON INDICATOR ASSESSMENT PERSPECTIVES Implemented and further planned measures against eutrophication Outlook CONCLUSIONS ACKNOWLEDGEMENT REFERENCES ANNEX 1 Transport calculations in the Kattegat-Skagerrak A model Study ANNEX 2 Assessment of zoobenthos ANNEX 3 Time series ANNEX 4 Reporting format on the results of the OSPAR Comprehensive Procedure ANNEX 5 Aggregated confidence rating
11 OSPAR Assessment Summary The Swedish OSPAR waters were assessed by applying the OSPAR Common Procedure for the time period The Swedish parts of Skagerrak, Kattegat and the Sound constitute the outer part of the transition zone between the estuarine Baltic Sea and the oceanic North Sea and were investigated for nutrients, chlorophyll-a,oxygen, macrophytes, phytoplankton and zoobenthos. The conclusion from the overall assessment of the Swedish OSPAR waters was that only Skagerrak open sea could be classified as a Non-Problem Area and all other assessment units were classified as Problem Areas. Atmospheric input of nitrogen significantly decreased in both Skagerrak and Kattegat and the land based input of total nutrients also decreased in Skagerrak, Kattegat as well as the Sound. However, the short-term trend of nitrogen input to the Sound was positive. Skagerrak is governed by trans-boundary transports from the North Sea of mainly nitrogen but also phosphorus. Kattegat receives trans-boundary nutrients from both the Baltic Sea through the Sound and from Skagerrak and transports nutrients towards the coast and the western part of the basin. Overall, concentrations of DIN, DIP, TN and chlorophyll-a decreased in most areas, however, no significant trends were found for DIP. Increasing concentrations were found in silicate, POC and TP. The Secchi depth increased in most areas. Oxygen deficiency was mainly a problem in the fjords and the Kattegat open sea. In Skagerrak coastal waters winter nutrients were only elevated in the fjords. Concentrations of DIN generally decreased significantly and there were tendencies of decreasing DIP. This pattern was also supported by the total nitrogen while total phosphorus increased. Secchi depth was improving and there was a significant positive trend of increasing depths. However, zoobenthos were still in bad condition and phytoplankton indicator species were often elevated. Chlorophyll-a concentrations were generally decreasing but still elevated in the inner coastal waters. There were also problems with algal toxins such as DST (Diarrhetic Shellfish Toxin) and PST (Paralystic Shellfish Toxin) infections in the area. According to the OSPAR classification scheme, a unit with no evident increased nutrient enrichment can be classified as a Problem Area but the cause might be due to trans-boundary transport from adjacent areas. In the open area of Kattegat there were still problems with oxygen deficiency, especially in the southern parts, even though the trend was significantly positive for the assessment period Concentrations of chlorophyll-a and DIN decreased significantly, however, DIN levels were still generally elevated, especially in the southern parts of Kattegat while DIP was closer to the assessment level. In Kattegat coastal waters winter nutrients were elevated in all assessment units, except from the inner coastal waters, even though there was a general pattern of decreasing going trends. Chlorophyll-a was mainly elevated in the Sound and the estuaries. Secchi depth is generally improving and a significant increase was seen in the Sound. Also in Kattegat, zoobenthos were in bad condition and phytoplankton indicator species were often elevated. 1
12 Swedish National Report on Eutrophication Status in the Skagerrak, Kattegat and the Sound 2 Introduction A eutrophic marine ecosystem occurs due to an excessive supply of nutrients. When nutrient loads exceed the carrying capacity of an ecosystem, environmental changes will occur. In marine environments, algal growth in the water column accelerates, favouring fast growing species. As this increased amount of organic matter decays there is increased oxygen consumption which can cause oxygen deficiency in the bottom water that may in turn cause fish kills and the death of other species, further reducing the nutrient carrying capacity of the system. Eutrophication therefore results in a range of undesirable disturbances in the marine ecosystem, including shifts in the composition of the flora and fauna which affects habitats and biodiversity. The OSPAR Eutrophication Strategy aims to combat eutrophication in the OSPAR maritime area, to achieve and maintain a healthy marine environment where anthropogenic eutrophication does not occur (OSPAR 2003). Within the OSPAR maritime area, eutrophication is a common problem and Contracting Parties have agreed to periodically assess their national waters by applying the Common Procedure for the identification of the eutrophication status (OSPAR 2013). Previous national applications of the Common Procedure have been made 2003 and The present application is based on the time period The assessment procedure The Common Procedure is based on two steps; the Screening Procedure and the Comprehensive Procedure. The first step, the Screening Procedure, aims to identify obvious Non-Problem Areas where the Comprehensive Procedure needs to not be applied. However, since all assessed units, apart from the open parts of Skagerrak, were assessed as Problem Areas in the former Swedish application of the Common Procedure, it was decided to directly apply the Comprehensive Procedure on all Swedish assessment units. Assessment criteria and associated biological and chemical parameters used in the Comprehensive Procedure are specified, agreed upon and aggregated into four categories (Table 1). The parameters are assessed against assessment levels and temporal trends and are scored with a + (if parameter fails the assessment) or a - (if parameter is within its normal range). The category itself is scored + if at least one of its respective assessment parameters is showing an increased trend, elevated level, shift or change. The assessment unit receives an initial classification according to the classification scheme (Table 2). A final and overall area classification is determined after an appraisal of all relevant information (concerning the harmonised assessment criteria, their respective assessment levels and the supporting environmental factors). The Comprehensive Procedure is used to assess eutrophication status across the OSPAR maritime area. A different approach is used within the Helsinki Convention on the Protection of the Marine Environment of the Baltic Sea Area (HELCOM). Both coastal and open sea eutrophication status in HOLAS II (HELCOM Second Holistic Assessment of the Ecosystem Health of the Baltic Sea) will be assessed using HEAT 3.0 (HELCOM Eutrophication Assessment Tool version 3). This makes use of three criteria which resemble the first three criteria of the Comprehensive Procedure. Each criteria is described using a set of assessment parameters (indicators) in terms of a Eutrophication ratio. This is the ratio between the target (assessment level) and the actual status for the 2
13 OSPAR Assessment 2016 assessment period. The target is also equivalent to the boundary between good and moderate status in terms of the WFD classification. All eutrophication ratios in a criterion are weighted and combined to give a weighted average or Eutrophication sum for that specific criterion. The Eutrophication sum is translated into a status class by means of a classification scale. The final classification for the assessment unit is determined with the One Out, All Out principle where the criterion with the worst status sets the overall status for the assessment unit. HEAT 3.0 was used in the most recent eutrophication thematic assessment of the open sea areas of the Baltic Sea (HELCOM 2014). The first report from HOLAS II is scheduled mid Table 1 Harmonised assessment parameters in the Common Procedure. Table from OSPAR Assessment parameters Category I Category II Category III Category IV Degree of nutrient enrichment 1 Riverine inputs and direct discharges 1 (area-specific) Elevated inputs and/or increased trends of total N and total P (compared with previous years) 2 Nutrient concentrations (area-specific) Elevated level(s) of winter DIN and/or DIP 3 N/P ratio (area-specific) Elevated winter N/P ratio (Redfield N/P = 16) Direct effects of nutrient enrichment (during growing season) 1 Chlorophyll a concentration (area-specific) Elevated maximum, mean and/or 90 percentile level 2 Phytoplankton indicator species (area-specific) Elevated levels of nuisance/toxic phytoplankton indicator species (and increased duration of blooms) 3 Macrophytes including macroalgae (area-specific) Shift from long-lived to short-lived nuisance species (e.g. Ulva). Elevated levels (biomass or area covered) especially of opportunistic green macroalgae) Indirect effects of nutrient enrichment (during growing season) 1 Oxygen deficiency Decreased levels (< 2 mg/l: acute toxicity; 2-6 mg/l: deficiency) and lowered % oxygen saturation 2 Zoobenthos and fish Kills (in relation to oxygen deficiency and/or toxic algae) Long-term area-specific changes in zoobenthos biomass and species composition 3 Organic carbon/organic matter (area-specific) Elevated levels (in relation to III.1) (relevant in sedimentation areas) Other possible effects of nutrient enrichment (during growing season) 1 Algal toxins Incidence of DSP/PSP mussel infection events (related to II.2) 1 Principles of the Comprehensive Study on Riverine Inputs and Direct Discharges (RID) (reference number: , as amended). 3
14 Swedish National Report on Eutrophication Status in the Skagerrak, Kattegat and the Sound Table 2 Examples of the integration of cause-effect related categorised assessment parameters. Table from OSPAR Category I Category II Categories III and IV Initial Classification Degree of nutrient enrichment Nutrient inputs Winter DIN and DIP Winter N/P ratio Direct effects Chlorophyll a Phytoplankton indicator species Macrophytes Indirect effects/other possible effects Oxygen deficiency Changes/kills in zoobenthos, fish kills Organic carbon/matter Algal toxins a problem area problem area problem area b problem area problem area problem area 2 c non-problem area 3 +?? Potential problem area +? - Potential problem area + -? Potential problem area d non-problem area Former applications of the Common Procedure In the first Swedish application of the Common Procedure 2003, covering the period 1998 to 2000, the Skagerrak and Kattegat open sea and coastal areas were clearly eutrophic and classified as Problem Areas. Concentrations of winter nutrients were above critical levels in Kattegat while they were close to background values in Skagerrak. Seasonal hypoxia in the deep water was a severe problem in Kattegat and in coastal parts of Skagerrak. Other assessed parameters such as nutrient load, chlorophyll-a, zoobenthos, macrophytes, organic carbon, phytoplankton and algal toxins also indicated eutrophication in both the Skagerrak and Kattegat. In the second Swedish application of the Common Procedure 2007, covering the time period 2001 to 2005, the Kattegat and coastal Skagerrak were still classified as Problem Areas while the eutrophication status in the open Skagerrak was identified as a Non- Problem Area. In the open parts of the Skagerrak both chlorophyll-and winter nutrients were below assessment levels. 2 For example, caused by trans-boundary transport of (toxic) algae and/or organic matter arising from adjacent/remote areas. 3 The increased degree of nutrient enrichment in these areas may contribute to eutrophication problems elsewhere. 4
15 OSPAR Assessment 2016 Assessment levels Since the second application of the Common Procedure, national assessment levels for both coastal and open sea areas have been further developed and implemented through the regulations HVMFS 2013:19 and HVMFS 2012:18 for the Water Framework Directive (WFD, 2000/60/EC; implemented in Swedish law as SFS 2004:660) and Marine Strategy Framework Directive (MSFD, 2008/56/EC; SFS 2010:1341). The Water Framework Directive regulates the assessment of coastal waters while the Marine Strategy Framework Directive regulates the assessment of marine waters. There are also international efforts made with the aim to harmonize eutrophication assessment levels in the open sea basins. HELCOM contracting parties have, for the open sea basins, agreed a set of assessment levels for good environmental status which are based on the TARGREV-project (Helcom 2013a) and expert judgments. These assessment levels were used to revise the Baltic Sea Action Plan in 2013 (Helcom 2013b). As the open sea Kattegat is assessed in both conventions, Helcom Kattegat assessment levels will be presented. 5
. Open Sea The Kattegat (including the Sound) and Skagerrak have surface areas of about 24 500 and 32 300 km 2 and mean depths of 22 m and 210 m respectively.")
16 Swedish National Report on Eutrophication Status in the Skagerrak, Kattegat and the Sound 3 Description of the assessed area Figure 1 Generalized circulation pattern in Skagerrak and Kattegat (B. Karlson, SMHI). Open Sea The Kattegat (including the Sound) and Skagerrak have surface areas of about and km 2 and mean depths of 22 m and 210 m respectively. They constitute the outer part of the estuarine transition zone between the brackish Baltic Sea and the oceanic North Sea, see Figure 1. The Skagerrak is a fjord with a sill depth of 270 metres and a maximum depth of about 700 metres. It has an almost permanent cyclonic circulation, although considerable short time variations occur due to shifting winds; south-westerly winds reinforce the circulation while north-easterly winds weaken it (Aure and Saetre 1981). The Skagerrak receives water from three different sources: Kattegat surface water with salinities of (Andersson and Rydberg, 1993) enters from the south; Atlantic water with salinities of , enters along the west side of the Norwegian Trench, forming intermediate and deep water (Furnes et al 1993); and a mixture of North Sea waters in the salinity range enter from the west and south-west, mainly as surface water along the northern coast of Jutland (the Jutland current). Low salinity in this water indicates either a recirculation of Baltic water or high river discharges in the southern North Sea. The main river input is from the Glomma River (700 m 3 /s) which enters the sea just north of the Swedish / Norwegian border. The Kattegat has two layer stratification, with the halocline found at a depth of 15 meters. The deep water consists of Skagerrak water, with a typical salinity of about 34, while the surface water, with salinities between 15 and 30, is a mixture of entrained deep water and brackish water from the Baltic. The proximity of the halocline to the sea floor, and the resulting small volume of bottom water in the southern and western Kattegat, makes it particularly vulnerable to hypoxia. 6
17 OSPAR Assessment 2016 The assessment of the two open sea assessment units is based on data within the Swedish economic zone. Coastal zone Coastal waters are delimited from the open sea waters making use of the Water Framework Directive methodology i.e. the border is set one nautical mile offshore of the baseline (NFS-2006:1). The assessed coastal waters are divided into 8 water types, according to the WFD typology. The Skagerrak consists of inner and outer coastal waters (type 1n and 3) and the fjords (type 2). The Kattegat consists of inner and outer coastal waters (type 1s and 4), southern Halland and the northern waters of the Sound (type 5), the Sound (type 6) and the transitional waters of Göta- and Nordre River (type 25), Figure 2. Each water type consists of several smaller water bodies. In the national WFDreporting, each water body is assessed separately. In accordance with national regulations governing the implementation of the Marine Strategy Framework Directive (HVFMS 2012:18) the smallest coastal assessment unit under the Marine Strategy is the coastal water type, so this status assessment has been made for water types, and not WFD water bodies. The border between Kattegat and Skagerrak is drawn from the north eastern tip of Jutland in Denmark to Marstrand in Sweden. The main river entering the assessed area is the Göta River (including its northern outlet, Nordre River) just south of the border between the two sub-basins. The general circulation along the west coast of Sweden is in the northward direction and hence most of the river water is mixed into the Skagerrak coastal water north of the mouth. The typology of the coastal waters is governed by a high salinity range, stratified with a shallow halocline and with a relatively high influence of surface water. The southern part of the Swedish Kattegat coast is open and mostly flat, with low-lying beaches of sand or moraine. In the southernmost part there are two large, open bays, the Laholm Bay and Skälderviken. In the northern part, sandy beaches are replaced by rocky ones and some skerries. There is also a shallow bay, the Kungsbackafjord. This type of coast continues into the southern part of the Swedish Skagerrak coast which gradually changes into a more rugged coastline to the north. The main part of the Skagerrak coast consists of islands, skerries and fjords, locally with high coastal hills and steep cliffs. 7

18 Swedish National Report on Eutrophication Status in the Skagerrak, Kattegat and the Sound Figure 2 Map of the assessment units in the Swedish application of the Common Procedure The division of coastal assessment units follow the WFD water type typology. 8
19 OSPAR Assessment Methods and Data The current assessment was made according to the Comprehensive Procedure, outlined in the Introduction, see section 2. The harmonised assessment parameters are chosen in accordance with Table 1. Additional voluntary parameters are also used and Table 3 below includes all assessed parameters. 4.1 Inventory of available data for the overall area assessed and subareas Table 3 Specification of parameters used in the assessment including voluntary parameters. * Winter nutrients: The maximal mean concentration per station (the mean of observations from one visit, 0-10 metres) observed during the winter period is used. Assessment parameter Atmospheric input of the sum of NOx and NHx Riverine inputs of Total Nitrogen (TN) and Total Phosphorus (TP) Trans-boundary transports of Dissolved Inorganic Nitrogen (DIN) and - Phosphorus (DIP) Unit Time period Metric Time coverage tonne/year annual mean tonne/year annual mean tonne/year annual mean DIN µmol/l Dec-Feb mean * DIP µmol/l Dec-Feb mean * Chlorophyll-a µg/l Jun-Aug mean Phytoplankton (biovolume) mm 3 /l Jun-Aug mean Algal toxins cells/l Jun-Aug, annual Macrophytes index Jul-Sep index Oxygen mg/l Aug-Oct mean mean of lowest quartile of data Results from the latest WFD assessment cycle Zoobenthos BQI indices annual mean POC µmol/l annual mean Voluntary parameters Primary production gc/m 2,year annual sum TN µmol/l Dec-Feb mean * TP µmol/l Dec-Feb mean * TN µmol/l Jun-Aug mean
20 Swedish National Report on Eutrophication Status in the Skagerrak, Kattegat and the Sound TP µmol/l Jun-Aug mean Si µmol/l Dec-Feb mean * Secchi depth m Jun-Aug mean Phytoplankton (abundance) cells/l summer mean Inputs from land Nitrogen and phosphorus loads to the sea from land come via rivers, through direct discharges from industry and from diffuse sources such as through the groundwater. National monitoring of the water chemistry in river mouths is managed by the Swedish University of Agricultural Sciences (SLU). Together with river runoff and estimates of the diffuse sources, the nutrient load to Skagerrak, Kattegat and the Sound has been determined for the time period The load of nutrients from land to sea was calculated for TN, DIN, TP, and DIP by SLU (Havet 2013/2014). The river load is directly linked to the amount of fresh water supply and trend analyses were therefore based on flow normalised riverine loads Inputs from the atmosphere The atmospheric contribution of eutrophying substances to the sea is mainly in the form of oxidised- (NOY-N) and reduced nitrogen (NHx-N). Combustion of fossil fuels, road transport, shipping and aircraft are significant sources of NOY emissions while NHx emissions are related to agriculture activities. The annual atmospheric deposition of nitrogen to the Skagerrak and Kattegat presented in this report has been produced with the Multi-scale Atmospheric Transport and Chemistry model, MATCH, for the time period (Andersson et al. 2015; Robertson et al. 1999). The meteorology comes from the HIRLAM-model and observations are from the Euro4m-project. Emission data used is from EMEP (The European Monitoring and Evaluation Programme) and SMED (Svenska MiljöEmissionsData). The atmospheric deposition of phosphorus is not included in MATCH and instead information from the literature was used. Areskoug (1993) suggested the atmospheric deposition of phosphorus to be 16 µmol m -2 month -1. Annual means of NOY-N and NHx-N were calculated for the Skagerrak and Kattegat. No calculations were made for the Sound since it has such as small surface area. Calculations were also made when only including the deposition on Swedish waters within the Swedish EEZ Trans-boundary transports Trans-boundary transports of nutrients have been estimated with a 3D high-resolution coupled ocean circulation and biogeochemical model for the Baltic Sea and the North Sea, NEMO-Nordic-SCOBI, for details see Kuznetsov and Eilola (2015) and Annex 1. Mean annual trans-boundary transports were estimated for DIN and DIP across 13 transects for the time period , see Figures 5-6 in Annex 1. The transects separate the open and coastal waters of Skagerrak and Kattegat. Due to technical issues with the model, there is a known bias between model results and observations. The bias 10
21 OSPAR Assessment 2016 implies that, on average, the observed concentrations are a factor of 0.8 lower than the modelled concentrations for phosphate and 0.5 for nitrate. However, it is not possibly to take account for the bias directly since it is a vertical average of all monitoring stations in the investigated area Physical-chemical and biological data Nutrients, chlorophyll-a, oxygen and phytoplankton are sampled within national and regional monitoring programmes. Data are stored and made available at the national data host, SMHI. SMHI is responsible for the national monitoring of the open sea.smhi is accredited by SWEDAC and follows appropriate HELCOM and OSPAR monitoring guidelines (HELCOM 2015; OSPAR, 2005). Monitoring in coastal waters is managed by County Administrative Boards and Societies for water conservation and the contractors change over time. Data cover the time period from 1970 to present with an increased frequency from 1993 when monthly measurements started. Sampling is made at standard depths according to the HELCOM COMBINE Manual. All data used in this assessment is open access and is available from SMHI ( Figure 3 shows sampling stations used in the assessment Observations during include also other stations not shown in this map. A number of stations (not shown in the map) close to mussel farms in assessment units 1n and 2 are sampled every second week on behalf of the Swedish National Food Administration (SNFA). The samples are analysed to monitor a number of potentially toxin-producing algae that may cause filter feeding mussels to become toxic for consumers. Toxin data from mussel samples are provided by the SNFA. National assessment levels which are used in this report are regulated in HVMFS 2013:19 (coastal waters) and HVMFS 2012:18 (open sea). Data quality is assured through the SWEDAC accreditation at laboratories and the quality control by the data host. Assessment levels are presented in tables for each parameter. Nutrients The concentration of inorganic nutrients during the winter period in the surface water, are indicators for eutrophication, representing the nutrient availability for the spring phytoplankton bloom. Biological activity is low in winter and has thus a small impact on the nutrient concentrations that can therefore be treated as conservative parameters. Before data is used it is necessary to determine the winter period. Based on examination of seasonal cycles of nutrient concentrations, the winter period on the Swedish west coast is generally from December to February. The maximum mean concentration per station observed during the winter period is used. If the surface layer has a strong stratification which is shallower than 10 metres, data below the pycnocline is discarded. The total nutrients for the winter period are selected together with the inorganic nutrients, which mean that TN (TP) is selected from the same sampling occasion as DIN (DIP). The total nutrients are also assessed during summer time and the mean of June-August at 0-10 metres depth are selected. Following the Common procedure, nutrient data shall be normalised when a significant relation between nutrients and salinity is present. To normalise the data for this report, 11
22 Swedish National Report on Eutrophication Status in the Skagerrak, Kattegat and the Sound water type specific relations from mixing diagrams, produced with present data , has been used. Normalisation is made according to: NUT _N= NUT _obs+k(s_ref-s_obs ) where NUTN is the normalised nutrient concentration, NUTobs is the observed nutrient concentration, k is the slope of the relation which can be negative or positive, Sref is the reference salinity and Sobs is the observed salinity. The measured value is only replaced with a normalised value if the relation is significant (p<0.05). Skagerrak open sea and coastal waters are normalised to the reference salinity 27 and Kattegat open sea and coastal water are normalised to 20. For some occasions the normalisation produces negative results that are not realistic. This happens if the relation between the nutrients and salinity has a steep negative slope and the nutrient concentration decreases with increasing salinity. Only positive nutrient values were included in the analyses. Mixing diagrams are presented in Annex 3 in Figures 1-6. All data are averaged per water type area before the assessing procedure. Since the national monitoring programme improved significantly in 1993 the trend analysis is made on the time period Trends for have also been investigated and are discussed if significant. Trend lines are only showed in figures if they are significant at the 95% confidence level (p<0.05). Status assessment, as well as trend analyses, are based on seasonal means. Chlorophyll-a and phytoplankton Growing season chlorophyll-a concentration is an indicator of the biological activity in the surface water. Data were sampled from June-August between 0 and 10 metres. Chlorophyll-a data consists of both discrete samples using bottles, and integrated samples using a 10 metre long hose. Hose data were preferred for the assessment. If no hose data were available, bottle data were integrated to provide equivalent data. Phytoplankton were sampled using a hose or a net. Phytoplankton biovolumes were measured by analysing phytoplankton cells. Cell sizes are estimated and appropriate cell volumes are found in the PEG_BVOL list, a phytoplankton list handled and updated by the HELCOM phytoplankton expert group (PEG), Olenina et al Biovolume data from June August is selected and is presented for coastal waters only. Oxygen At the end of the growing season, decaying organic matter consumes oxygen, leading to the lowest oxygen concentrations in the bottom water. In eutrophic waters, oxygen levels can fall so low as to be a problem for flora and fauna. Bottom water data were selected as the deepest water sample in the water column if the distance to the bottom is less than 10% of the bottom depth. At most stations, oxygen as well as nutrients is sampled 1 metre above the bottom. The assessment was made on the time period August-October and on the lowest quartile of data. Anoxic conditions occur in some west coast fjords. In these 12

23 OSPAR Assessment 2016 cases, hydrogen sulphide is measured and expressed as negative oxygen, where 1 µmol/l S2- = ml/l oxygen. Figure 3 Hydrographic stations used in the assessment POC High concentrations of POC in the water indicates more organic matter, making POC a relevant parameter when assessing eutrophication. Particulate organic carbon, POC, has 13
24 Swedish National Report on Eutrophication Status in the Skagerrak, Kattegat and the Sound mainly been measured in coastal waters and is available since the beginning of the 90s. However, there are no national assessment levels for POC and so only trends used in this assessment. Zoobenthos Excessive nutrient loads to the sea cause excessive organic matter production. During the decomposition process more oxygen is needed and oxygen deficiency may become a problem particularly if the bottom water volume is small. This affects the benthic macrofauna at the seabed. A small increase in organic load is expected to lead to a positive response by the macrofauna, but an excessive load can have devastating effects. Data on benthic macrofauna have been analysed for the Skagerrak, Kattegat and the Sound by Marine Monitoring AB. The time periods for sampling varied between areas, but extend back for more than a decade. For the Skagerrak open sea, data are missing for the years 2012 and 2014, and for the Sound data is incomplete after The assessment is based on the Benthic Quality Index (BQI). For the detailed report see Annex 2. Macrophytes The macrophyte community is an indicator of eutrophication status in coastal waters. The shift from perennial to opportunistic species is particularly important. Depth distribution of macrophytes reflects light conditions and can be used as an indication of eutrophication. Light conditions are due to the concentration of phytoplankton and suspended matter in the water. Observations of macrophytes are made along transects during the time period July-September. Macrophyte data has not been analysed for the present COMP-assessment; instead status classification from the latest WFD-cycle ( ) have been used. Ecological Quality Ratios, EQR values, were averaged over water bodies in a water type to provide one assessment value per water type. The available information covered six coastal water types (VISS,- VattenInformationsSystem Sverige, ). 4.2 Methods for consideration of environmental factors in the assessments Supporting environmental factors such as hydrodynamic conditions have been considered when analysing the assessment parameters. If the surface layer, when selecting winter nutrients, has a strong stratification which is shallower than 10 metres, data below the stratification is not taken into consideration. Nutrients have been normalised to reference salinities, 20 psu for Kattegat and the Sound and 27 psu for Skagerrak, when a significant relation between nutrients and salinity is present. 4.3 Meta-data and reporting of monitoring data to the ICES database Data from the national monitoring programme are reported to ICES annually. Meta-data from both national (mainly open sea) and regional (coastal) monitoring programmes are reported to SeaDataNet. ICES are harvesting physical-chemical data from SeaDataNet 14
25 OSPAR Assessment 2016 and due to this process Swedish coastal physical-chemical data are also available from ICES. 5 Eutrophication assessment 5.1 Parameter-related assessment based on background concentrations/levels and assessment levels Trends of the assessment parameters for the time periods and are visualised in Figure 4a and b, including voluntary parameters. Time series and status classification schemes for each parameter are shown in Annex 3. Figure 4 Trends of assessment parameters during the time period a) and b) Arrows pointing downwards (upwards) represents decreasing (increasing) trends. A filled arrow represents a significant trend to the 95% confidence level. No short-time trend is presented for TP due to a change in analyse method. 15
 Category I in the assessment procedure describes nutrient enrichment comprising the nutrient loads from land and atmosphere as well as the winter nutrient")
 to the Skagerrak, Kattegat and the Sound during the time period 1990 2014. Trends were similar for TN and DIN, see Figures 5-7.")
26 Swedish National Report on Eutrophication Status in the Skagerrak, Kattegat and the Sound Category I (nutrient enrichment) Category I in the assessment procedure describes nutrient enrichment comprising the nutrient loads from land and atmosphere as well as the winter nutrient concentrations and their ratios. Nutrient input from land, atmosphere and trans-boundary transports The land based, flow normalised, input of nitrogen decreased significantly (p<0.05) to the Skagerrak, Kattegat and the Sound during the time period Trends were similar for TN and DIN, see Figures 5-7. Nitrogen loads also decreased significantly during the assessment period , except in the Sound where DIN instead increased. Significant decreasing trends were found for the longer time series of total phosphorus for all areas while the inorganic phosphorus increased in Skagerrak and Kattegat. There were considerable higher amounts of nutrient inputs to the Kattegat than to Skagerrak or the Sound due to the discharge from the Göta River, although as the river outlets are at the northern limit of the Kattegat, the river has little direct effect on the Kattegat. Figure 5 Nutrient load from land to the Skagerrak. Significant trend lines are shown. 16


27 OSPAR Assessment 2016 Figure 6 Nutrient load from land to the Kattegat. Significant trend lines are shown. Figure 7 Nutrient load from land to the Sound. Significant trend lines are shown. Atmospheric deposition of total nitrogen (NOY-N + NHx-N) to the Skagerrak and Kattegat decreased significantly both during and , Figure 8. This is in spite of an increase in maritime transport,and the decreasing overall trend is mainly due to measures on land. Between 2006 and 2013, the average deposition of total nitrogen was 18 kt N/year to the Skagerrak and 13 kt N/yr to the Kattegat. When only waters within the Swedish economic zone are considered, the deposition was 3.4 and 4.1 kt N/yr respectively. Of the total input of atmospheric nitrogen, the reduced nitrogen (NHx-N) 17
28 Swedish National Report on Eutrophication Status in the Skagerrak, Kattegat and the Sound contributed made up 30 percent of the total. A significant decreasing trend for the reduced nitrogen was only found in Skagerrak. Atmospheric phosphorus deposition was estimated using a constant value of 16 µmol m m -2 month -1, from Areskoug (1993). For the Skagerrak this implies a load of 192 tp/year and for Kattegat 132 tp/year. If only Swedish EEZ waters are considered, the corresponding loads for Skagerrak and Kattegat are 37 and 40 tp/year respectively. Calculations of the trans-boundary transports of inorganic nutrients are summarized in Table 4. Nutrients are transported from the Baltic Sea to the Kattegat through the Sound and are transported along the Swedish coastline with the Baltic current, (Figures 5-6 in Annex 1). The cyclonic movement in Skagerrak also affects the transport of nutrients. According to the modelling results, 22 kt N and 8 kt P are transported annually to the Kattegat through the Sound. The open parts of Kattegat receive nutrients from both the Sound and from the Skagerrak. Nutrients are then transported from Kattegat to the coastal waters of Kattegat and also to the western side of the basin. The net transport of DIN (DIP) from the North Sea to Skagerrak was 294 ktn/yr (15 ktp/yr). Table 4 Summary of nutrient inputs from land, atmosphere and trans-boundary transports to the Skagerrak and Kattegat area within the Swedish EEZ. TN ton N TP ton P DIN ton N DIP ton P /yr /yr /yr /yr Atmospheric deposition, mean Skagerrak Kattegat River load, mean Skagerrak Kattegat The Sound Trans-boundary net transport, mean Skagerrak Net transports in to the area are denoted with positive numbers. open sea Kattegat open sea Skagerrak coast Kattegat coast

29 OSPAR Assessment 2016 Figure 8 Atmospheric deposition of nitrogen to Skagerrak and Kattegat within the Swedish EEZ. Black line is the trend line for NOY-N+NHx-N. 19
30 Swedish National Report on Eutrophication Status in the Skagerrak, Kattegat and the Sound Winter nutrients (DIN, DIP) Winter concentrations of the inorganic nutrients DIN and DIP have decreased in the open sea areas, but the decrease was only significant (p<0.05) for DIN in the Kattegat (DIN, ;, Figure 10 and 13 in Annex 3). Winter concentrations of DIN (mean ) were higher in Skagerrak, 7.5 µmol/l and lower in the Kattegat, 6.1µmol/l. In the Skagerrak, DIN was often below the assessment level while the situation was worse in the Kattegat with DIN concentrations mostly above the assessment level. Winter concentrations of DIP (mean ) were at similar levels in the Skagerrak and Kattegat, at about 0.6 µmol/l. Because of the less strict assessment levels in the Skagerrak, concentrations of DIP were more or less always below the assessment level while in Kattegat DIP was below the assessment level only for some years. The status of DIP in Kattegat has improved since the 1990s though. Winter N/P ratios in the open seas of Kattegat and Skagerrak did not exceed or fall below the ±50 % assessment level from the classical Redfield ratio of 16 (Figure 29 in Annex 3). The ratio is below Redfield in both areas, 10 and 13 respectively. Higher ratios occur in the Skagerrak due to higher concentrations of DIN. Winter concentrations of DIN and DIP in coastal areas tended to decrease. However, there were exceptions, such as in the Sound where both DIN and DIP increased (Figures 8-9 and in Annex 3). Significant decreasing trends of DIN ( ) were found in the outer coastal waters of the Kattegat, the river estuaries, inner coastal waters and the fjords. No significant trends of DIP were found. Coastal concentrations of DIN (mean ) varied between 4.5 and 14.5 µmol/l with highest values found in the transitional river waters. Concentrations of DIP (mean ) varied between µmol/l and highest concentrations were found in the Sound. The concentration of nutrients was always above the assessment level in the transitional river waters regarding DIN and in the Sound regarding DIP. The assessment levels in the inner and outer coastal waters were occasionally exceeded. Winter nutrient ratios were not assessed in coastal waters because increased ratios can be observed naturally in some coastal areas, OSPAR (2013). 20
31 Skagerrak 1n. Inner coastal waters of Skagerrak 2. Fjords 3. Outer coastal waters of Skagerrak N. Kattegat S. Kattegat 1s. Inner coastal waters of Kattegat 4. Outer coastal waters of Kattegat 25. Göta river- and Nordre river estuary 5. Coastal waters of s. Halland and the n. Sound 6. Coastal waters of the Sound OSPAR Assessment 2016 Table 5 Annual mean winter DIN, normalised to a reference salinity, related to national assessment levels. Shading means observations exceed the assessment level. If the HELCOM target is used for the Kattegat, the result for 2011 changes to assessment level exceeded in the north. In the southern part concentrations remain below the assessment threshold (bold numbers). The OSPAR elevated level is a deviation of 50 % from the reference value. Empty boxes is due to negative DIN-values produced in the normalization process and are not due to missing data. DIN (µmol/l) National reference value OSPAR elevated level National assessment level HELCOM target Status Reference salinity Mean
32 Skagerrak 1n. Inner coastal waters of Skagerrak 2. Fjords 3. Outer coastal waters of Skagerrak Kattegat 1s. Inner coastal waters of Kattegat 4. Outer coastal waters of Kattegat 25. Göta river- and Nordre river estuary 5. Coastal waters of s. Halland and the n. Sound 6. Coastal waters of the Sound Swedish National Report on Eutrophication Status in the Skagerrak, Kattegat and the Sound Table 6 Annual mean winter DIP, normalised to a reference salinity, related to national assessment levels. Shading means observations exceed the assessment level. If the HELCOM target is used for the Kattegat, only the year 2010 is below the assessment level (bold numbers). OSPAR elevated level is a deviation of 50 % from the reference value. DIP (µmol/l) National reference value OSPAR elevated level National assessment level HELCOM target 0.49 Status Reference salinity Mean
33 Skagerrak 1n. Inner coastal waters of Skagerrak 2. Fjords 3. Outer coastal waters of Skagerrak Kattegat 1s. Inner coastal waters of Kattegat 4. Outer coastal waters of Kattegat 25. Göta river- and Nordre river estuary 5. Coastal waters of s. Halland and the n. Sound 6. Coastal waters of the Sound OSPAR Assessment Category II (direct effects) Phytoplankton Chlorophyll-a (summer) Overall, summer mean chlorophyll-a concentrations have decreased (Figures in Annex 3). The decrease is significant in the Kattegat open sea, in the Kattegat outer coastal waters and in the river estuaries ( ). At the Skagerrak coast, significant decreasing trends were found in the fjords only. Table 7 shows status for individual years in the assessment units during Chlorophyll-a was below the assessment thresholds, in many units, most of the time. Only in the Sound and in the river estuaries were concentrations predominantly above the assessment level. Table 7 Annual mean summer chlorophyll-a, related to national assessment levels. Shading means assessment level exceeded. National, HELCOM and OSPAR elevated assessment levels in the offshore Kattegat are identical. Chl-a (µgl/l) summer National reference value OSPAR elevated level National assessment level HELCOM target 1.5 Status Mean
34 Skagerrak 1n. Inner coastal waters of Skagerrak 2. Fjords 3. Outer coastal waters of Skagerrak Kattegat 1s. Inner coastal waters of Kattegat 4. Outer coastal waters of Kattegat 25. Göta river- and Nordre river estuary 5. Coastal waters of s. Halland and the n. Sound 6. Coastal waters of the Sound Swedish National Report on Eutrophication Status in the Skagerrak, Kattegat and the Sound Phytoplankton Biovolume (summer) No trends were observed in summer mean biovolumes at the Swedish west coast, Figure 44 in Annex 3. Time series are rather short at most stations. No analysis of phytoplankton biovolumes for the open sea areas is included in this assessment. Status for individual years, when summer mean biovolumes are considered, were mostly below assessment levels, Table 8. Table 8 Annual mean summer biovolume, related to national assessment levels. Shading means assessment level exceeded. OSPAR elevated level is a deviation of 50 % from the reference value. Biovolume (mm 3 /l) summer National reference value OSPAR elevated level National assessment level Status Mean Phytoplankton indicator species No trends were found during the time period For some indicator species however, increasing tendencies were observed in several assessment units during the longer period Noctiluca scintillans is a heterotrophic dinoflagellate and is one of the species associated with bioluminescence. Red accumulations of the species have been observed in the Skagerrak - Kattegat areas for many years. N. scintillans is not toxic but can cause oxygen depletion when forming blooms. The species tend to increase in the inner coastal waters of the Kattegat during the time period , Figure 45 in Annex 3. 24
35 OSPAR Assessment 2016 The genus Pseudochattonella spp. blooms irregularly along the Swedish west coast, and has been reported as having killed fish in Danish aquaculture. No fish kills have been reported in Swedish waters. Pseudochattonella spp is mostly abundant in late winter or early spring in the Kattegat Skagerrak areas, Figure 46 in Annex 3. The dinoflagellate genus Dinophysis causes problems along the Swedish west coast as their toxins accumulate in blue mussels. Several species in the genus are mixotrophic, i.e. they are able both to photosynthesize and to feed on other plankton. What triggers the shift between the trophic grades is not yet known. The species D. acuminata, D. acuta and D. norvegica have increased in the inner coastal waters of the Kattegat, the fjords, outer coastal waters of Skagerrak and coastal waters of the southern Halland and the northern Sound since 1998, Figure 47 in Annex3. Alexandrium spp. is a problem genus for the mussel industry due to its toxicity. The Alexandrium toxin PST (Paralytic Shellfish Toxin) was found in blue mussels April 2014 (Figure 20) when the genus was observed above its warning limits. Alexandrium spp. tends to have increased during the period in the fjords, Figure 48 in Annex 3. Karenia mikimotoi (syn. Gymnodinium mikimotoi) appears occasionally in the phytoplankton samples and mostly in low cell numbers. The species may form blooms, Figure 49 in Annex 3. Chrysochromulina polylepis is hard to identify in the light microscope and in the monitoring work the species is placed within the group Prymnesiales. Organisms from this group are found throughout the year in the Skagerrak Kattegat areas. The genus Phaeocystis spp. is rarely observed in the phytoplankton samples from the Skagerrak Kattegat area. When they are found, cell numbers are low, and consequently no nuisance blooms are formed at the Swedish west coast. Pseudo-nitzschia toxins (AST, Amnesic Shellfish Toxins) were observed, although below its warning limits, in Swedish mussels for the first time during spring The genus is found all year around in the phytoplankton samples and several species are known to be toxic. This is not an OSPAR indicator species, but due to the potential toxicity of several species in the genus, it is reported here. Pseudo-nitzschia spp. appear to have increased in the coastal waters of the southern Halland and the northern Sound (Figure 50 in Annex 3) and in the coastal waters of the Sound during the time period Prorocentrum cordatum (syn. Prorocentrum minimum) is a potentially toxic species from the genus Prorocentrum. P. micans is more abundant than P. cordatum in the area, but is nontoxic. Macrophytes Macrophytes were assessed in coastal waters only and the last assessment made under the Water Framework Directive has been used (VISS), Table 9. No time series were analysed. In the West Coast Inner Coastal Waters (types 1n and 1s) data from six water bodies were used to classify ecological status. Of these six, two water bodies were only sampled during one year and four water bodies were sampled over five years or more. All 25
36 Skagerrak 1n. Inner coastal waters of Skagerrak 2. Fjords 3. Outer coastal waters of Skagerrak Kattegat 1s. Inner coastal waters of Kattegat 4. Outer coastal waters of Kattegat 25. Göta river- and Nordre river estuary 5. Coastal waters of s. Halland and the n. Sound 6. Coastal waters of the Sound Swedish National Report on Eutrophication Status in the Skagerrak, Kattegat and the Sound ecological quality ratios (EQR) were above 0.6 and the average EQR for the whole water type was Hence the water type was classified as having Good ecological status for macrophytes. In the west coast fjords (type 2), five out of 18 water bodies had data that could be used for status assessment. One of these water bodies was classified as Moderate and four as Good. Most of these data were sampled only for one year and only one water body had data from several years ( ). The average EQR for the fjords was 0.68 and it was classified as having Good ecological status. In the Skagerrak Outer Coastal Waters (type 3) only four of ten water bodies had data. Three of these water bodies were sampled only in 2008 and the fourth one was sampled The average EQR was 0.82 and gave Good status. In the Kattegat Outer Coastal Waters two water bodies of five could be used for classification. The average EQR was 0.91 and data were collected during 2008 for one water body and for the other. The coastal waters of southern Halland and the northern Sound had five water bodies with data based on sampling from at least three subsequent years. All EQR s were high, between , which indicatedhigh ecological status. The coastal waters of the Sound had four out of six water bodies with data available for classifying status. The EQR varied between and the average for the whole water type was 0.76 suggesting Good ecological status. Table 9 Status of macrophytes expressed as the Ecological Quality Ratio (EQR). All assessment units are above good status. Status is from the latest WFD-results of Swedish coastal waters (VISS). Macrophytes (EQR) National assessment level Status WFD
37 OSPAR Assessment Category III (indirect effects) Oxygen In the open Skagerrak areas there are usually no problems with oxygen deficiency in the bottom water. Average concentration for the assessment period was 6.8 mg/l. The oxygen concentration was above the assessment level for the whole period from 1970 up till today. However, the trend for the period was significantly negative. For Kattegat, the situation was reversed, with concentrations mostly below the assessment level. The average concentration for the assessment period was 4.0 mg/l. The oxygen condition was worse during the 80s and early 90s and the trend is positive but not significant (p>0.05). However, for the assessment period there was a significant increase. The values during the later years were closer to the assessment level of 5 mg/l. The southern Kattegat has problems with oxygen deficiency as the halocline lies very close to the bottom. The northern part of Kattegat is rarely affected by hypoxia. See Figure 38 in Annex 3 for time series of oxygen in the open sea areas. For coastal areas, the assessment level is lower than for the open sea, 3 mg/l. The average concentrations for the assessment period was between -4.2 and 6.1 mg/l. Lowest concentrations and anoxic conditions were found in the fjords. The bottom water of the fjords is often anoxic and hydrogen sulphide is present instead of oxygen. In the time series, figure 36, hydrogen sulphide is expressed as negative oxygen. Higher concentrations are found in the transitional river waters. For the Göta River estuary the situation is positive with increasing oxygen levels, although the trends are not significant. For the outer coastal areas in Skagerrak and Kattegat values from the lowest quartile were above the assessment limit. For the Kattegat outer coastal waters, there was a decreasing concentration seen over the period from This was not however significant. The inner coastal waters do not suffer from oxygen deficiency but there is a tendency for decreasing oxygen values in the southern parts and increasing values in the north, although the trends are not significant. For the coastal waters of the southern part of Kattegat and northern part of the Sound (Type 5) the situation has become much better and the trends are clearly positive. The later years show values above the limit and the trend for the assessment period is also significant. For the more southerly parts of the Sound the situation, on the other hand, is worse with levels just above the limit. See Figures in Annex 3 for time series of oxygen in the coastal sea areas. Trends in oxygen saturation show the same pattern as for concentrations, indicating that changes are not due to variations in temperature or salinity. 27
38 Skagerrak 1n. Inner coastal waters of Skagerrak 2. Fjords 3. Outer coastal waters of Skagerrak Kattegat 1s. Inner coastal waters of Kattegat 4. Outer coastal waters of Kattegat 25. Göta river- and Nordre river estuary 5. Coastal waters of s. Halland and the n. Sound 6. Coastal waters of the Sound Swedish National Report on Eutrophication Status in the Skagerrak, Kattegat and the Sound Table 10. Annual mean autumn bottom oxygen concentration from the lower quartile, related to national assessment levels. Autumn is defined as August-October. Shading means assessment level exceeded. OSPAR elevated level is a deviation of 50 % from the reference value. Negative values refer to hydrogen sulphide expressed as negative oxygen. O 2 (mg/l) autumn National reference value OSPAR elevated level National assessment level Status Mean
39 OSPAR Assessment 2016 Zoobenthos A clear general negative trend in BQI was detected in the Kattegat Open Sea during 2003 up to 2010.The Skagerrak Fjords, Skagerrak Coast and Kattegat Coast had moderate status during that period. Subsequently conditions generally improved, but declined for the Skagerrak Fjords in The reason for the general declines are not known as measurements of likely impact factors such as oxygen condition, food availability and predation pressure are not studied with sufficient frequency and spatial resolution. For their growth and reproduction, benthic animals are dependent on the quantity and quality of food, which is transported to the seabed by horizontal and vertical advection. The data set is not complete for all areas and years over the period 2006 to For detailed results of zoobenthos, see the report by Marine Monitoring AB in Annex 2. POC Particulate organic carbon, POC, has been measured mainly in coastal waters and is therefore only analysed for the coast (Figures in Annex 3). The average annual POC varies around 25 µmol/l. Significant positive trends were found in the outer coastal waters of Skagerrak and Kattegat, the inner parts of Kattegat and in the Sound ( ). Only in coastal waters of Halland, a significant trend for the shorter assessment period ( ) was found which was negative Category IV (other possible effects) Algal toxins The dinoflagellate genus Dinophysis causes problems in Swedish mussel farms as several species can produce DST (Diarrhetic Shellfish Toxin) which causes stomach illness in humans. The genus is found in phytoplankton samples throughout the year (Figure 51 in Annex 3) although the individual species vary in toxicity. The most potent species is D. acuta, and it tends to be present with relatively high numbers when DST is found in blue mussels. Observations of DST in blue mussels during the period are presented in Figure 52 in Annex 3. During spring 2014, Alexandrium spp was found at many sights along the west coast (Figure 53 in Annex 3). The toxins some species in this genus produce, PST (Paralytic Shellfish Toxin), was also found in mussel flesh during the same period (Figure 54 in Annex 3). Species in the diatom genus Pseudo-nitzschia spp are potentially producers of AST (Amnesic Shellfish Toxins). AST was found for the first time in blue mussels from the Swedish west coast in March-April 2014, however, concentrations were below the warning limit. It is however important to continue monitoring Pseudo-nitzschia species and AST as the toxin is lethal for humans. 29
40 Swedish National Report on Eutrophication Status in the Skagerrak, Kattegat and the Sound 5.2 Overall assessment Below are assessment tables for each assessment unit. The full reporting format is presented in Annex Skagerrak open sea Category I Category II Categories III and IV Initial Classification Degree of nutrient enrichment Nutrient inputs Winter DIN and DIP Winter N/P ratio Direct effects Chlorophyll-a Phytoplankton indicator species Macrophytes Indirect effects/other possible effects Oxygen deficiency Changes/kills in zoobenthos, fish kills Organic carbon/matter Algal toxins d Non-Problem Area ??? The atmospheric deposition of total nitrogen to Skagerrak decreased significantly during the time periods and The nutrient load to Skagerrak from land had a significant decreasing trend for both total nitrogen and total phosphorus for the time period There was also a significant decrease since 2006 for total nitrogen from land. Skagerrak is governed by trans-boundary transports from the North Sea of mainly nitrogen but also phosphorus. Mean concentrations of DIN were above the assessment level only twice during the assessment period and DIP were below during the whole period. Mean chlorophyll-a concentrations were at or below the reference value and was only once exceeding the assessment level. There were decreasing tendencies for DIN, DIP and chlorophyll-a but no significant trends. There were no problems with the oxygen situation in bottom waters or of the benthic fauna, oxygen concentrations and BQI were always above the assessment level. Skagerrak open sea is assessed to be a Non-Problem Area. 30
41 OSPAR Assessment Inner coastal waters of the west coast. North. Water type 1n. Category I Category II Categories III and IV Initial Classification Degree of nutrient enrichment Nutrient inputs Winter DIN and DIP Winter N/P ratio Direct effects Chlorophyll-a Phytoplankton indicator species Macrophytes Indirect effects/other possible effects Oxygen deficiency Changes/kills in zoobenthos, fish kills Organic carbon/matter Algal toxins b Problem Area - + +? The nutrient load to Skagerrak from land decreased significantly for both total nitrogen and total phosphorus for the time period There has also been a further, significant decrease in total nitrogen since Mean concentrations of DIN have improved recently and were generally below the assessment level during the assessment period. Concentrations of DIP were below the assessment level during the whole assessment period but without trends. Mean chlorophyll-a concentrations, on the other hand, were mainly elevated though the tendency was to decreasing concentrations. Phytoplankton indicator species have been found above assessment levels every year during There have been several occasions of DST (Diarrhetic Shellfish Toxin) infections in mussels during and one occasion of PST (Paralystic Shellfish Toxin) infection in the area. There were no problems of the oxygen situation in bottom waters and oxygen concentrations were always above the assessment level. However, the BQI were below the assessment level for the Skagerrak coast. The Skagerrak inner coastal water is overall assessed as a Problem Area. Concentrations of nutrients are not the reason for the classification and the problems can thus have been caused by trans-boundary transport from adjacent areas. 31
42 Swedish National Report on Eutrophication Status in the Skagerrak, Kattegat and the Sound West Coast Fjords. Water type 2. Category I Category II Categories III and IV Initial Classification Degree of nutrient enrichment Nutrient inputs Winter DIN and DIP Winter N/P ratio Direct effects Chlorophyll-a Phytoplankton indicator species Macrophytes Indirect effects/other possible effects Oxygen deficiency Changes/kills in zoobenthos, fish kills Organic carbon/matter Algal toxins a Problem Area + + +? The fjords on the west coast typically have high DIN concentrations and only occasionally were these below the assessment level. Concentrations of DIP were close to the assessment level but still mostly elevated. Trends for DIN and DIP were decreasing and the decrease was significant for DIN. Mean chlorophyll-a concentrations were not elevated and there was a significant decrease during the whole period. Phytoplankton indicator species have been found above the assessment levels every year during There have been several occasions of DST (Diarrhetic Shellfish Toxin) infections in mussels during and one occasion of PST (Paralystic Shellfish Toxin) infection in the area. Circulation of the deep water is restricted because of the natural characteristics of fjords which were also mirrored in the oxygen situation and benthic fauna. The bottom waters in the fjords suffer from anoxia and the lowest quartile of data had negative oxygen values indicating hydrogen sulphide. However, there is an increasing tendency during the later years. The bottom fauna failed to reach the assessment level. The fjords on the west coast are assessed as a Problem Area. 32
43 OSPAR Assessment Skagerrak Outer Coastal Waters. Water type 3. Category I Category II Categories III and IV Initial Classification Degree of nutrient enrichment Nutrient inputs Winter DIN and DIP Winter N/P ratio Direct effects Chlorophyll-a Phytoplankton indicator species Macrophytes Indirect effects/other possible effects Oxygen deficiency Changes/kills in zoobenthos, fish kills Organic carbon/matter Algal toxins b Problem Area - + +? - +? The nutrient loads to Skagerrak from land have significant decreasing trends for both total nitrogen and total phosphorus for the time period There was also a significant decrease, since 2006, for total nitrogen. There was a net transport of nutrients from the coastal waters to the open sea. Mean concentrations of DIN have improved recently in the outer coastal waters in Skagerrak and were generally below the assessment level. DIP was never elevated and had also a significant decreasing trend since Chlorophyll-a was only elevated a few times during the assessment period and macrophytes had good status according to the WFD assessment. Phytoplankton indicator species have been found above the assessment levels every year during Algal toxins in mussels are not monitored in this area. There were no problems with low oxygen concentrations but the BQI were below the assessment level and the benthic fauna was thus in bad condition. There was a significant increasing trend for POC for the long time period , for the short time period there was an increasing tendency. The Skagerrak outer coastal waters are overall assessed as Problem Area. Concentrations of nutrients are not the reason for the classification and the problems can thus have been caused by trans-boundary transport from adjacent areas. 33
44 Swedish National Report on Eutrophication Status in the Skagerrak, Kattegat and the Sound Kattegat open sea Category I Category II Categories III and IV Initial Classification Degree of nutrient enrichment Nutrient inputs Winter DIN and DIP Winter N/P ratio Direct effects Chlorophyll-a Phytoplankton indicator species Macrophytes Indirect effects/other possible effects Oxygen deficiency Changes/kills in zoobenthos, fish kills Organic carbon/matter Algal toxins a Problem Area ??? The atmospheric deposition of total nitrogen to Kattegat decreased significantly during the time periods and The nutrient load to Kattegat from land had a significant decreasing trend for both total nitrogen and total phosphorus for the time period There was also a significant decrease since 2006 for total nitrogen. There is a net export of nutrients from the Swedish zone of Kattegat towards the coastal water and the western parts of Kattegat. There were decreasing trends for DIN in Kattegat during the time period , and the trend was significant in the northern parts. Concentrations of DIN were still generally elevated, especially in the southern parts of Kattegat while DIP was closer to the assessment level. However, no trends were observed for DIP. Chlorophyll-a was significantly decreasing and close to the reference value. The assessment level was only exceeded once during the assessment period. Phytoplankton indicator species have been found above Swedish assessment levels every year except Algal toxins in mussels are not monitored in this area. The oxygen concentrations, lowest quartile of data, in the deep water were always below the assessment level and the benthic fauna was also in bad condition. The Kattegat open sea is overall assessed as Problem Area. 34
45 OSPAR Assessment Inner coastal waters of the west coast. South. Water type 1s. Category I Category II Categories III and IV Initial Classification Degree of nutrient enrichment Nutrient inputs Winter DIN and DIP Winter N/P ratio Direct effects Chlorophyll-a Phytoplankton indicator species Macrophytes Indirect effects/other possible effects Oxygen deficiency Changes/kills in zoobenthos, fish kills Organic carbon/matter Algal toxins b Problem Area - + +? - +? The nutrient load to Kattegat from land had a significant decreasing trend for both total nitrogen and total phosphorus for the time period There was also a significant decrease since 2006 for total nitrogen. Concentrations of DIN and DIP were not elevated during the assessment period. However, normalization of DIN resulted in many negative DIN-values which make the assessment uncertain. Nitrogen in the inner coastal waters of Kattegat has a strong relationship with salinity and DIN is decreasing towards the sea. DIN and DIP decreased in the area but only significantly, , for DIN. Chlorophyll-a decreased during the whole period, however not significantly, and was only elevated once during the assessment period. The macrophytes were in good status according to the WFD assessment. Phytoplankton indicator species have been found above the Swedish assessment levels every year except 2012 and Algal toxins in mussels are not monitored in this area. There were no problems with oxygen deficiency but the BQI were below the assessment level and the benthic fauna was thus in bad condition. There was a significant increasing trend for POC for the long time period , for the short time period there was however an decreasing tendency. The Kattegat inner coastal waters were overall assessed as Problem Area. 35
46 Swedish National Report on Eutrophication Status in the Skagerrak, Kattegat and the Sound Outer coastal waters of Kattegat. Water type 4. Category I Category II Categories III and IV Initial Classification Degree of nutrient enrichment Nutrient inputs Winter DIN and DIP Winter N/P ratio Direct effects Chlorophyll-a Phytoplankton indicator species Macrophytes Indirect effects/other possible effects Oxygen deficiency Changes/kills in zoobenthos, fish kills Organic carbon/matter Algal toxins a Problem Area + + +? - +? The nutrient loads to Kattegat from land have significantly decreased for both total nitrogen and total phosphorus for the time period There is also a significant decrease since 2006 for total nitrogen. There is a net transport of nutrients from the coastal waters to the open sea. Concentrations of DIN have improved during the later years and there was a significant downward trend for Concentrations of DIP, on the other hand, were mainly elevated during the assessment period. Improvements were also seen in chlorophyll-a that was elevated only once during the assessment period and significantly decreased in The macrophytes were in good status according to the WFD assessment. Phytoplankton indicator species have been found above the Swedish assessment levels every year except Algal toxins in mussels are not monitored in this area. There were no problems with oxygen deficiency in the area but the BQI were below the assessment level and the benthic fauna was thus in bad condition. There was a significant increasing trend for POC for the long time period , for the short time period there was however an decreasing tendency. The Kattegat outer coastal waters were overall assessed as Problem Area. 36
47 OSPAR Assessment Coastal waters of southern Halland and the northern Sound. Water type 5. Category I Category II Categories III and IV Initial Classification Degree of nutrient enrichment Nutrient inputs Winter DIN and DIP Winter N/P ratio Direct effects Chlorophyll-a Phytoplankton indicator species Macrophytes Indirect effects/other possible effects Oxygen deficiency Changes/kills in zoobenthos, fish kills Organic carbon/matter Algal toxins a Problem Area + + +? - -? The nutrient load to Kattegat from land had a significant decreasing trend for both total nitrogen and total phosphorus for the time period There was also a significant decrease since 2006 for total nitrogen. This area has a net inflow of nutrients from Kattegat and the Sound. Only DIP was elevated during the assessment period and there were an increasing tendency for DIN while it was decreasing for DIP, no significant trends were however found. Chlorophyll-a was improved during the later years but without significant trends. The macrophytes were in good status according to the WFD assessment. Phytoplankton indicator species have been found above the Swedish assessment levels every year except 2012 and Algal toxins in mussels are not monitored in this area. There were no problems with oxygen deficiency but the BQI were below the assessment level and the benthic fauna was thus in bad condition. The oxygen situation has improved and significant positive trends were found in The coastal waters of southern Halland and the northern Sound were overall assessed as Problem Area. 37
48 Swedish National Report on Eutrophication Status in the Skagerrak, Kattegat and the Sound Coastal waters of the Sound. Water type 6. Category I Category II Categories III and IV Initial Classification Degree of nutrient enrichment Nutrient inputs Winter DIN and DIP Winter N/P ratio Direct effects Chlorophyll-a Phytoplankton indicator species Macrophytes Indirect effects/other possible effects Oxygen deficiency Changes/kills in zoobenthos, fish kills Organic carbon/matter Algal toxins a Problem Area + - -? - +? DIN, DIP and chlorophyll-a was elevated during the assessment period and especially DIN tended to increase. However, normalization of DIN resulted in many negative DINvalues which make the assessment uncertain. Nitrogen in the inner coastal waters of the Sound has a strong relationship with salinity and DIN is decreasing towards the sea. Some of the monitoring stations in the Sound are situated in Lommabukten where very high DIN-values were measured. Chlorophyll-a decreased significantly since 2006 but, on the other, hand, the value in 2006 was the highest during the whole period. The macrophytes were in good status according to the WFD assessment. No phytoplankton indicator species have been observed above the Swedish assessment levels. Although not an OSPAR indicator, the potentially toxic diatom genus Pseudonitzschia (AST, Amnesic Shellfish Toxin) is reported here due to its toxicity. The genus has been observed above the Swedish assessment level 2008 and 2009 in this area. Data has however not been delivered to the data host since There were no problems with oxygen deficiency in the Sound and the BQI were mostly above the assessment level although the time series was short ( ). There was a significant increasing trend for POC for the long time period , for the short time period there was however an decreasing tendency. The Sound was overall assessed as Problem Area. 38
49 OSPAR Assessment Göta river and Nordre river estuary. Water type 25 Category I Category II Categories III and IV Initial Classification Degree of nutrient enrichment Nutrient inputs Winter DIN and DIP Winter N/P ratio Direct effects Chlorophyll-a Phytoplankton indicator species Macrophytes Indirect effects/other possible effects Oxygen deficiency Changes/kills in zoobenthos, fish kills Organic carbon/matter Algal toxins a Problem Area +?????? Concentrations of DIN were elevated and even though there was a significant decreasing trend ( ) concentrations were far from the assessment level. DIP, on the other hand, is mostly below the assessment level. Chlorophyll-a was elevated in the area but decreased significantly during There are no phytoplankton data or data from algal toxins in mussels in this area. There were no problems with oxygen deficiency in the transitional river waters. The Göta river- and Nordre river estuary was overall assessed as Problem Area. 5.3 Comparison with preceding assessment The overall assessment was similar to the preceding assessment (COMP2) in which only Skagerrak open sea was a Non-Problem Area. Similarities were despite different assessment levels in some assessment units / parameters and a different geographical aggregation of data. In COMP2, the assessment area was aggregated into four units: Skagerrak open sea, Kattegat open sea, Skagerrak coastal waters and Kattegat coastal waters. In this application (COMP3) the assessment area was aggregated into eight coastal units based on the water types which are the same as used in the WFD and two open sea units. More assessment units implies a more detailed assessment but also fewer observations to analyse per unit. 5.4 Voluntary parameters Total nutrients Total nitrogen, TN, and total phosphorus, TP, (for summer and winter) are assessed for the Swedish coastal waters under the WFD. There are no national assessment levels for TN and TP in the open sea areas. Therefore, only trends are discussed for the open sea. Time series are shown in Figures in Annex 3. No trend for the long time period has been analysed for TP due to a change in analyzing method
50 Skagerrak 1n. Inner coastal waters of Skagerrak 2. Fjords 3. Outer coastal waters of Skagerrak Kattegat 1s. Inner coastal waters of Kattegat 4. Outer coastal waters of Kattegat 25. Göta river- and Nordre river estuary 5. Coastal waters of s. Halland and the n. Sound 6. Coastal waters of the Sound Swedish National Report on Eutrophication Status in the Skagerrak, Kattegat and the Sound Winter TN decreased in Skagerrak (significantly) and in Kattegat during the time period Summer TN decreased significantly in both Skagerrak and Kattegat. Winter TN along the coast decreased significantly in the fjords, inner coastal waters and in estuaries. There was a significant decrease in summer TN for all water types except the Sound and the outer coastal waters of Skagerrak. Winter TP generally increased during the long time period and the increase was significant in Kattegat open sea and outer coastal water, the Sound and Halland and the northern Sound. TP during summer also increased during the long time period and significance was found in all units except from Skagerrak, Estuaries and the fjords. For the short time period there was decreasing tendencies in most assessment units. Assessment levels and salinity normalised annual mean values for are shown for the assessment units in Tables Winter TN was mostly above assessment levels in the estuaries and the Sound while summer TN was above assessment levels in most units. Winter TP was mostly above the assessment level in Halland and the Sound while summer TP was generally below assessment levels apart from the estuaries and the Sound. Table 11 Winter surface TN (µmol/l) normalised to reference salinity, related to national assessment levels. Shading means assessment level exceeded. OSPAR elevated level is a deviation of 50 % from the reference value. No national assessment levels are defined for the Skagerrak and the Kattegat. TN (µmol/l) winter National reference value OSPAR elevated level National assessment level Status Reference salinity Mean
51 Skagerrak 1n. Inner coastal waters of Skagerrak 2. Fjords 3. Outer coastal waters of Skagerrak Kattegat 1s. Inner coastal waters of Kattegat 4. Outer coastal waters of Kattegat 25. Göta river- and Nordre river estuary 5. Coastal waters of s. Halland and the n. Sound 6. Coastal waters of the Sound OSPAR Assessment 2016 Table 12 Winter surface TP (µmol/l) normalised to reference salinity, related to national assessment levels. Shading means assessment level exceeded. OSPAR elevated level is a deviation of 50 % from the reference value. No assessment levels are defined for the Skagerrak and the Kattegat. TP (µmol/l) winter National reference value OSPAR elevated level National assessment level Status Reference salinity Mean
52 Skagerrak 1n. Inner coastal waters of Skagerrak 2. Fjords 3. Outer coastal waters of Skagerrak Kattegat 1s. Inner coastal waters of Kattegat 4. Outer coastal waters of Kattegat 25. Göta river- and Nordre river estuary 5. Coastal waters of s. Halland and the n. Sound 6. Coastal waters of the Sound Swedish National Report on Eutrophication Status in the Skagerrak, Kattegat and the Sound Table 13 Summer surface TN (µmol/l) normalised to reference salinity, related to national assessment levels. Shading means assessment level exceeded. OSPAR elevated level is a deviation of 50 % from the reference value. No assessment levels are defined for the Skagerrak and the Kattegat. TN (µmol/l ) summer National reference value OSPAR elevated level National assessment level Status Reference salinity Mean
53 Skagerrak 1n. Inner coastal waters of Skagerrak 2. Fjords 3. Outer coastal waters of Skagerrak Kattegat 1s. Inner coastal waters of Kattegat 4. Outer coastal waters of Kattegat 25. Göta river- and Nordre river estuary 5. Coastal waters of s. Halland and the n. Sound 6. Coastal waters of the Sound OSPAR Assessment 2016 Table 14 Summer surface TP (µmol/l) normalised to reference salinity, related to national assessment levels. Shading means assessment level exceeded. OSPAR elevated level is a deviation of 50 % from the reference value. No assessment levels are defined for the Skagerrak and the Kattegat. TP (µmol/l) summer National reference value OSPAR elevated level National assessment level Status Reference salinity Mean Winter concentrations of silicate There are no national assessment levels for silicate and therefore are only trends discussed, Figures in Annex 3. For the long time period, the winter concentration of silicate shows an increasing tendency in all assessment units (significant in the estuaries). For the short time period, there was a decreasing tendency in the Sound, outer coastal waters of Skagerrak, the fjords and inner coastal waters of Kattegat. Concentrations of silicate were highest close to land in low salinities and decreased towards the open sea. The strong relationship between silicate and salinity occasionally produced negative values in the normalisation procedure. However, the trend analyse was made on the normalised data excluding the negative values. Ratios between DIN and silicate versus DIP and silicate have been produced for the open areas but none of them exceeded the assessment levels recommended in the Common Procedure. 43
54 Skagerrak 1n. Inner coastal waters of Skagerrak 2. Fjords 3. Outer coastal waters of Skagerrak Kattegat 1s. Inner coastal waters of Kattegat 4. Outer coastal waters of Kattegat 25. Göta river- and Nordre river estuary 5. Coastal waters of s. Halland and the n. Sound 6. Coastal waters of the Sound Swedish National Report on Eutrophication Status in the Skagerrak, Kattegat and the Sound Secchi depth Secchi depth is not a common indicator in OSPAR but it is used in the Swedish implementation of the WFD and is also a common indicator in HELCOM. For the open sea areas the Secchi depth varies around the assessment level of 8 meters with increasing tendencies meaning deeper Secchi depths, Figures in Annex 3 and Table 15. The trend is significant in Skagerrak for the long time period. Along the coast, the Secchi depth has overall improved. For the long time period, significant trends of deeper Secchi depths were found in the Sound, the fjords and the inner coastal waters of Skagerrak. However, the Secchi depth is still below the assessment level for some assessment units, especially the estuaries, the coastal waters of southern Halland and the Sound. Table 15. Secchi depth presented per assessment unit, related to national assessment levels. Shading means assessment level exceeded. OSPAR elevated level is a deviation of 50 % from the reference value. If the HELCOM target is used for Kattegat, the year 2008 changes to assessment level exeeded (bold numbers). Secchi (m) summer Swedish reference value OSPAR assessment level Swedish G/M boundary Helcom 7.6 Status Mean

55 OSPAR Assessment 2016 Primary production Primary production has been measured bi-weekly at the station Släggö, right at the mouth of the Gullmar Fjord, since The station belongs to the fjords. Measurements are made using in situ incubation, see Lindahl The time series from Släggö has previously been analysed and described in for example Lindahl et al 2009 and Tiselius et al In these previous studies, it has been able to link the primary production at Släggö to the nitrate concentrations in the mouth area of the Gullmar Fjord. A significant correlation between primary production and the climate index NAO was also concluded. No influence from local runoff on the long term development of the primary production was found. The primary production at Släggö is presented as annual means see Figure 9. In the present report the time series has been extended with the years 2013 and 2014 and there were a significant (p<0.05) decreasing trend during Figure 9. Annual primary production at Släggö. Blue line is the linear regression. Phytoplankton (Abundance) The total abundance (cell numbers) of phytoplankton tends to increase in assessment unit 5 during the period (Figure 55 in Annex 3). No significant change was observed during the short time period The phytoplankton class Dinophyceae (dinoflagellates), increase significantly in most of the assessment units. Time series from all sampling occasions in assessment unit 1s is presented in Figure 56 in Annex 3. Figure 57 in Annex 3 presents the summer mean (June August) of dinoflagellates in the same area. This class is an important contributor to the primary production at the Swedish west coast. The diatoms are the overall dominating class, but dinoflagellates are the second most common group. 45

56 Swedish National Report on Eutrophication Status in the Skagerrak, Kattegat and the Sound 6 Comparison and/or links with European eutrophication related polices The WFD assessment of eutrophication in Swedish coastal waters are presented in Figure 10. Aggregation of data within the WFD is different from the COMP assessement since the WFD assessment is made per coastal water body instead of coastal water type. But it is clear that similar conclusions were made in the WFD as in the present COMP. All areas, except a part of the Skagerrak outer coastal waters, had problem with eutrophication. No national classification has yet been made for the MSFD related open sea areas. Data has, very recently, been analysed for the update of the assessment for the Nitrate directive. Time period was and the results for the Swedish west coast do not contradict the present COMP assessment. Figure 10. Status of eutrophication on the Swedish west coast according to the WFD classification 2015 ( 7 OSPAR common indicator assessment The common indicators in the OSPAR sub-region II related to eutrophication are; winter nutrients (DIN and DIP), chlorophyll-a, oxygen concentration, nutrient inputs and phaeocystis. Even though phaeocystis is sometimes recorded in Swedish waters, phaeocystis blooms are not a problem and hence not discussed further in this report. OSPAR has, for each of the common indicators, developed an assessment sheet that describes the overall status of the indicator in the entire OSPAR region II. Below is a 46
57 OSPAR Assessment 2016 brief presentation of the main results from the OSPAR assessment sheets for nutrients, chlorophyll-a and oxygen in Skagerrak and Kattegat. It is important to note that the OSPAR assessment differ from the national assessment in terms of how data is aggregated, in both how seasonal periods are defined and how the open sea is separated from the coastal waters. Winter nutrient concentrations Winter is defined as November to February. Linear regression shows a decreasing tendency of DIN in Skagerrak, Kattegat and the Sound. For DIP-concentrations no significant changes were apparent in the Skagerrak and Kattegat, while in the Sound concentrations were high in particular during recent years, causing an increasing tendency. Concentrations of chlorophyll-a Growing season is defined as March September. There is a clear decreasing tendency in chlorophyll-a in both coastal and open sea areas of Skagerrak, which also has matches the results of the national report. Kattegat on the other hand show an increasing tendency for chlorophyll-a. However, the increase is due to high values during the past two years. Near-bed dissolved oxygen concentrations in stratified waters The assessment sheet for oxygen is based on data near the sea bed during July to October. Significant decreasing trends were apparent for Skagerrak while an increasing and significant trend was found for Kattegat and Sound. The results from the assessment sheet generally matches the national report 8 Perspectives 8.1 Implemented and further planned measures against eutrophication It was clear during the 60s that there were problems with eutrophied sea areas and an expansion of waste water plants were made during the 70s. These measures have resulted in a reduction of phosphorus since the 60s and a reduction of nitrogen since the 80s. Measures to reduce the nutrient load from land are necessary in order to combat the eutrophication in marine waters. Neighbouring countries around a sea basin all contributes with nutrients from land and joint efforts are thus needed to reduce problems such as eutrophication. Within OSPAR and HELCOM joint efforts have been made through agreements to reduce nutrient loads from land. In the MSFD, a programme of measure shall be determined for the national marine waters. Sweden decided upon its programme of measures for the North Sea and the Baltic Sea in December 2015 (HaV 2015:30). Some of the new measures to meet eutrophication include financial support as well as the encouragement to invent techniques to blue catch crops in those sea areas where status is below Good. The aim is to extract nutrients from the water when harvesting algaes. Another measure is to stimulate aquaculture techniques, for example fish farms, that do not entail a net load of nutrients. Further measures are prohibiting the discharge of sewage water from recreational boats (introduced 2015) that will reduce the phosphorus load, and restoration of eel grass habitats that will have a positive effect on the retention of nutrients in the coastal zone. 47
58 Swedish National Report on Eutrophication Status in the Skagerrak, Kattegat and the Sound Programmes of measures shall also be produced within the WFD, which has been done by the Skagerrak and Kattegat water district authority (Vattenmyndigheterna 2015). The main measures to decrease the load of phosphorus to coastal waters have been identified as: transfer private sewers to approved standards, phosphorus dams to improve retention, treatment of phosphorus to 0.1 mg / l at the sewage treatment plants, structural liming and protection zones. To decrease the load of nitrogen, the main measure is an increased treatment at the sewage treatment plants. 8.2 Outlook The WFD has implied assessment levels in the coastal water and the MSFD has implied assessment levels for the open sea. Due to the directives, programme of measures have been established. We have already seen the effects of previous measures and these positive effects will continue with new and better directed measures. It is however important to be aware of certain inertia in the system which may imply delayed effects of measures. Also important to include when planning measures for the Skagerrak and Kattegat is the trans-boundary transport of nutrients from the North Sea and the Baltic Sea that contributes to the total nutrient load. 9 Conclusions The conclusion from the overall assessment of the Swedish OSPAR waters was that only Skagerrak open sea could be classified as a Non-Problem Area and all other assessment units were classified as Problem Areas. Atmospheric input of nitrogen significantly decreased in both Skagerrak and Kattegat and the land based input of total nutrients also decreased in Skagerrak, Kattegat as well as the Sound. Skagerrak is governed by trans-boundary transports from the North Sea of mainly nitrogen but also phosphorus. Kattegat receives trans-boundary nutrients from both Skagerrak and the Baltic Sea. Generally, concentrations of DIN, DIP, TN and chlorophyll-a decreased in most assessment units, however, no significant trends were found for DIP. Increasing concentrations were found in silicate, POC and TP. The Secchi depth increased in most assessment units. Oxygen deficiency was mainly a problem in the fjords and the Kattegat open sea. In Skagerrak coastal waters winter nutrients were only elevated in the fjords. Concentrations of DIN generally decreased significantly and there were tendencies of decreasing DIP. This pattern was also supported by the total nitrogen while total phosphorus increased. Secchi depth was improving and there was a significant positive trend of increasing depths. However, zoobenthos were still in bad condition and phytoplankton indicator species were often elevated. Chlorophyll-a concentrations were generally decreasing but still elevated in the inner coastal waters. There were also problems with algal toxins such as DST (Diarrhetic Shellfish Toxin) and PST (Paralystic Shellfish Toxin) infections in the area. According to the OSPAR classification scheme, a unit with no evident increased nutrient enrichment is classified as a problem area but the cause might be due to trans-boundary transport from adjacent areas. In the open area of Kattegat there were still problems with oxygen deficiency, especially in the southern parts, even though the trend was significantly positive for the assessment 48
59 OSPAR Assessment 2016 period Concentrations of chlorophyll-a and DIN decreased significantly, however, DIN levels were still generally elevated, especially in the southern parts of Kattegat while DIP was closer to the assessment level. In Kattegat coastal waters winter nutrients were elevated in all areas, except from the inner coastal waters, even though there was a general pattern of decreasing trends. Chlorophyll-a was only elevated in the Sound and the transitional river waters. The summer mean of total cell numbers of phytoplankton had increased. Secchi depth generally improved and a significant increase was seen in the Sound. Also in Kattegat, zoobenthos were in bad condition and phytoplankton indicator species were often elevated. Main issues and open questions considering the Common Procedure The Common Procedure is transparent and coherent which make assessment results from contracting parties comparable. There are however a few issues that should be taken into consideration. The Common Procedure recommends normalising nutrient concentrations when there is a significant relation with salinity. However, in areas with an extreme steep gradient from the coast towards the sea, this sometimes results in negative values. Negative values, produced in the normalisation process, occur for example for DIN and silicate in a few Swedish coastal assessment units. It is not discussed in the Common Procedure how these negative values should be interpreted. Negative values have not been included in the data analyse of the present COMP-application. The rating of the level of confidence for the assessment parameters is a new feature in the present Common Procedure. This is however not subject for comparability between contracting parties. Linear trends in the present application of the Common Procedure have been assessed with Mann-Kendall for the time periods and and were only displayed when they were significant to the 95%-confidence level (p<0.05). The Common Procedure recommends the use of the R-package TTAinterfaceTrendAnalysis which also has been tested for some parameters and areas. The R-package was found to be a useful tool in which it is possible to analyse the trend in more detail. However, it was considered time consuming to use the R-package for all areas and parameters since it is still some manual work included. It was thus considered handier to use a script that made the trend analyse simultaneously when making the figures. 10 Acknowledgement We would like to thank the Swedish water and marine management for supporting the assessment work, the Marine Monitoring AB for making the assessment of zoobenthos, Magnuz Engardt for providing results of the atmospheric input of nitrogen, Kari Eilola for providing calculations of the trans-boundary transports. We would also like to thank Lars Sonesten at SLU for updating and providing the data for the river loads. 49
60 Swedish National Report on Eutrophication Status in the Skagerrak, Kattegat and the Sound 11 References Andersson, C., Engardt, M., Alpfjord, H., SMHI RAPPORT NR Återanalys av marknära ozon i Sverige för perioden Areskoug, H Nedfall av kväve och fosfor till Sverige, Östersjön och västerhavet. Naturvårdsverket, Rapport COMBINE Manual. Manual for Marine Monitoring in the COMBINE Programme of HELCOM. DIRECTIVE 2000/60/EC OF THE EUROPEAN PARLIAMENT AND OF THE COUNCIL of 23 October 2000 establishing a framework for Community action in the field of water policy DIRECTIVE 2008/56/EC OF THE EUROPEAN PARLIAMENT AND OF THE COUNCIL of 17 June 2008 establishing a framework for community action in the field of marine environmental policy (Marine Strategy Framework Directive) HaV 2015:30. God havsmiljö 2020, Marin strategi för Nordsjön och Östersjön, Del 4: Åtgärdsprogram för havsmiljön. Havs- och vattenmyndighetens rapport 2015:30. Havet 2013/2014. Annual report on the marine monitoring in Swedish waters. HELCOM, 2013a. Approaches and methods for eutrophication target setting in the Baltic Sea region. Balt. Sea Environ. Proc. No. 133 HELCOM, 2013b. Summary report on the development of revised Maximum Allowable Inputs (MAI) and updated Country Allocated Reduction Targets (CART) of the Baltic Sea Action Plan. This document was prepared for the 2013 HELCOM Ministerial Meeting to give information on the progress in implementing the HELCOM Baltic Sea Action Plan. mary%20report%20on%20mai-cart.pdf HELCOM Eutrophication status of the Baltic Sea A concise thematic assessment. Baltic Sea Environment Proceedings No. 143 HELCOM 2015, HELCOM Manual for Marine Monitoring in the COMBINE Programme of HELCOM. %20and%20Guidelines/Manual%20for%20Marine%20Monitoring%20in%20the%20CO MBINE%20Programme%20of%20HELCOM.pdf HVMSF 2013:19. Havs- och vattenmyndighetens föreskrifter om klassificering och miljökvalitetsnormer avseende ytvatten. HVMSF 2012:18. Havs- och vattenmyndighetens föreskrifter om vad som kännetecknar god miljöstatus samt miljökvalitetsnormer med indikatorer för Nordsjön och Östersjön. Kuznetsov, I., and Eilola, K., Model study on the variability of ecosystem parameters in the Skagerrak - Kattegat area, effect of load reduction in the North Sea and possible effect of BSAP on Skagerrak - Kattegat area. Report
61 OSPAR Assessment 2016 Lindahl, O Long-term studies of primary phytoplankton production in the Gullmar fjord, Sweden. In Ecology of Fjords and Coastal Waters, pp Ed. by H.R. Skjoldal, C. Hopkins, K.E. Erikstad and H.P. Leinaas. Elsevier Science Publishers B.V. 623pp. Naturvårdsverket (2007). Handbok 2007:4 Status, potential och kvalitetskrav för sjöar, vattendrag, kustvatten och vatten i övergångszon - En handbok om hur kvalitetskrav i ytvattenförekomster kan bestämmas och följas upp. nv-handbok status-potential-och-kvalitetskrav pdf NFS-2006:1. Naturvårdsverkets föreskrifter om kartläggning och analys av ytvatten enligt förordningen (2004:660) om förvaltning av kvaliteten på vattenmiljön. Olenina, I., Hajdu, S., Edler, L., Andersson, A., Wasmund, N., Busch, S., Göbel, J., Gromisz, S., Huseby, S., Huttunen, M., Jaanus, A., Kokkonen, P., Ledaine, I. and Niemkiewicz, E Biovolumes and sizeclasses of phytoplankton in the Baltic Sea HELCOM Balt.Sea Environ. Proc. No. 106, 144pp (7 October 2015). OSPAR, OSPAR Commission, Strategies of the OSPAR Commission for the Protection of the Marine Environment of the North-East Atlantic. Agreement OSPAR Commission, London OSPAR 2013 Agreement Common Procedure for the Identification of the Eutrophication Status of the OSPAR Maritime Area (Reference number: Robertson, L., Langner, J. and Engardt, M An Eulerian limited-area atmospheric transport model. J. Appl. Meteor. 38, Andersson, C., Engardt, M., Alpfjord, H., RAPPORT NR Återanalys av marknära ozon i Sverige för perioden Tiselius, P., Belgrano, A., Andersson, L., Lindahl, O., Primary productivity in a coastal ecosystem: a trophic perspective on a long-term time series. J. Plankton Res. (2015) 0(0): doi: /plankt/fbv094 Vattenmyndigheterna Förslag på åtgärdsprogram för Västerhavets vattendistrikt Länsstyrelsen Västra Götalands län, Vattenvårdsenheten, Vattenmyndigheterna i samverkan. Diarienummer VISS, Vatteninformationssystem Sverige,
62
63 ANNEX 1 Transport calculations in the Kattegat-Skagerrak A model Study Kari Eilola and Ivan Kuznetzov
64 Transport calculations in the Kattegat-Skagerrak A model study Kari Eilola 1 and Ivan Kuznetzov* 2 1 Swedish Meteorological and Hydrological Institute, Norrköping, Sweden 2 Helmholtz-Zentrum Geesthacht Institute of Coastal Research, Max-Planck-Str. 1, Geesthacht, Germany * Dr Kuznetsov s earlier affiliation was SMHI. Summary The present report summarizes the results from nutrient trans-boundary transport calculations performed with a three dimensional high-resolution coupled ocean circulation and biogeochemical model for the Baltic Sea and the North Sea. The calculations are done as part of the an agreement between Swedish Agency for Marine and Water management (Svenska Havs- och Vattenmyndigheten HAV) and the Swedish Meteorological and Hydrological Institute (SMHI) to explore the results produced with a newly developed coupled physical biogeochemical ecosystem model called NEMO-Nordic-SCOBI. The present approach follows upon the initial work with NEMO-Nordic-SCOBI by Kuznetsov et al. (2016) and the reader is referred to Kuznetsov et al. (2016) for further details about methods and model validations and results. The Swedish Coastal and Ocean Biogeochemical model (SCOBI) (Marmefelt et al. 1999; Eilola et al. 2009; Almroth-Rosell et al. 2011; 2015) handles biogeochemical processes in the sea as well as sediment nutrient dynamics including iron bound phosphorus (Fig. 1). To get a complete model setup it has to be coupled to a model that can handle the physical transport of water, and the salinity and temperature variables. At SMHI it has been used for many years in different configurations e.g., the RCO (e.g. Almroth and Skogen, 2010; Eilola et al., 2011; 2012; 2013; 2014; Meier et al., 2012; Skogen et al., 2014), NEMO-Nordic (Kuznetsov et al., 2016), HIROMB (Eilola et al., 2006) and PROBE models (Sahlberg, 2009). SCOBI is a NPDZ model that has three different phytoplankton functional types. The 1
65 NEMO-Nordic-SCOBI model describes cycles of nitrogen, phosphorus and silicate. Oxygen dynamics is also included and hydrogen sulfide concentrations are represented by negative oxygen equivalents (1 ml H2S l -1 = 2 ml O2 l - 1 ). Inorganic nutrients are represented by four state variables: nitrate, ammonia, phosphate and silicate. Nutrients are assimilated by three phytoplankton groups representing diatoms, flagellates and others, and cyanobacteria. At low nitrate concentrations the nitrogen fixing diazotrophic cyanobacteria may benefit and acts as an additional nitrogen source in the Baltic Sea. Phytoplankton growth is limited by local nutrient and light conditions and temperature. Photosynthetic active radiation penetrates into the water column and is exponentially damped by water turbidity, chlorophyll and detritus. Bulk zooplankton grazes on phytoplankton. Dead organic material, represented by separate variables for nitrogen, phosphorus and silicate, sink and accumulate in detritus in the water column and in the sediments. The detritus pool undergoes temperature dependent remineralization. The microbial loop is represented by denitrification and sulfate reduction by bacteria in case of low oxygen concentrations. Inorganic nutrient fluxes from the sediment pool and resuspension events may recycle nutrients to the water column. The NEMO-Nordic-SCOBI was applied at Skagerrak - Kattegat area to investigate the transports of nitrate and phosphate at transects A to M described in Fig. 2. The spatial average transport patterns and vertical mean nutrient concentrations of the present model results are presented in Fig. 3. One may find biases in nutrient concentrations relative to observations (Kuznetsov et al., 2016) because the NEMO-Nordic-SCOBI configuration is new and the SCOBI model setup was earlier only calibrated to the Rossby Centre Ocean model (RCO) for the Baltic Sea. To get a rough figure for the impact of the present model biases we have calculated average biases at a number of monitoring stations ranging from the southern parts to the northern parts of transects (Tables 1-4). The average of observations is about a factor of 0.8 (std 0.2) lower for phosphate and about 0.5 (std 0.2) lower for nitrate. This indicates that the transports are most likely over estimated because of the bias in concentrations and should be multiplied by a factor roughly of the order of for phosphorus and for nitrate, respectively. We have, however, not tried to determine the impact from seasonal biases or from depth dependent biases. Neither can we determine the biases at the actual transects because the monitoring stations are not located along the sections. The large variability of gradients in the area, and the fact that the actual volume transports of water during this period are unknown and can therefore not be taken into account, makes bias corrections problematic. The transport calculations (Fig. 5, Fig.6 and Table 5) in the present report must therefore be regarded as first estimates that may be discussed and refined in future model evaluations. One can mention that during January 2016 the SCOBI model has been coupled to the most recent NEMO version (Hordoir et al. 2015). This configuration is regarded to be stable in the sense that no major changes in the NEMO model code should occur in the near future. SCOBI will therefore be calibrated and tuned to the latest configuration (called NEMO-Nordic version 3.6) and used by SMHI for biogeochemical studies in the Baltic Sea and North Sea area both for the operational forecasts and for oceanographic research. 2


66 Figure 1. Schematic figure of the components of the SCOBI model as presented in Almroth-Rosell et al. (2015). The NEMO-Nordic-SCOBI model include in addition also the dynamics of Silicate (Kuznetsov et al., 2016), not shown in figure. 3

67 Figure 2. OSPAR COMP transects as described by the Swedish Agency for Marine and Water management. 4
 of nitrate (left) and phosphate (right) concentrations and stream lines")
 for the period 2007-2011: Mean and standard deviation of")


 and from model results (red).")
68 Results Figure 3. Annual and vertical means (period ) of nitrate (left) and phosphate (right) concentrations and stream lines of the corresponding vertically integrated annual mean transports. Table 1. Average model bias to observations at 6 stations (Table 2) for the period : Mean and standard deviation of phosphate ratio between vertical mean of observations/ vertical mean of model for all stations. I.e. the mean ratio of all stations is 0.81 which indicate that on average the observed concentrations are a factor of 0.81 lower than the modelled concentrations. The standard deviation of the ratio between stations is about Mean ratio 0.81 Standard deviation of ratio 0.18 Table 2. Bias to observations at 6 stations (see Fig. 4 for station map) for the period Figures show mean profiles of PO4 from observations (black) and from model results (red). The shaded areas indicate the corresponding ±1 standard deviation. The numbers above the figures show the ratio of vertical mean values of the profiles (vertical mean of observations/ vertical mean of model). Anholt E Å17 P2 Fladen Wland Å
 for the")

 for the period 2007-2011.")
.")

69 Table 3. Average model bias to observations at 6 stations (Table 4) for the period : Mean and standard deviation of nitrate ratio between vertical mean of observations/ vertical mean of model for all stations. Mean 0.51 Std 0.17 Table 4. Bias to observations at 6 stations (see Fig. 4 for station map) for the period Figures show mean profiles of nitrate from observations (black) and from model results (red). The shaded areas indicate the corresponding ±1 standard deviation. The numbers above the figures show the ratio of vertical mean values of the profiles (vertical mean of observations/ vertical mean of model). Anholt E Å17 P2 Fladen Wland Å Figure 4. Stations map. 6
70 Table 5. Vertically integrated annual mean nitrate and phosphate transports and standard deviation between the years (kton yr -1 ). The transports are calculated at sections in Kattegat and Skagerrak as close as possible to the Swedish OSPAR COMP sections shown in Fig. 2. The transports with directions in respective transects are shown in Fig.5 and Fig.6. Transports towards north and west through a section are denoted with positive numbers in the table. Kton per year Transect A B C D E F G H I J K L M Mean nitrate Standard deviation nitrate Mean phosphate Standard deviation phosphate
71 Figure 5. Mean annual nitrate transports (kton yr -1 ) (bold) and standard deviation (italic) between the years. Unit: kton=10 6 kg. 8
 2007-2011 (bold) and standard deviation (italic)")
72 Figure 6. Mean annual phosphate transports (kton yr -1 ) (bold) and standard deviation (italic) between the years. 9
73 Acknowledgement The work presented in this study was funded by the Swedish Agency for Marine and Water management and partly by the Integrated management of Agriculture, Fishery, Environment and Economy project (IMAGE) funded by the Danish Strategic Research Council. We also want to thank Per Pemberton (SMHI) for valuable technical support. References Almroth, E., and M.D. Skogen, A North Sea and Baltic Sea model ensemble eutrophication assessment. Ambio, 39(1), Almroth-Rosell, E., Eilola, K., Hordoir, R., Meier, H.E.M., Hall, P., Transport of fresh and resuspended particulate organic material in the Baltic Sea a model study. J. Mar. Sys. 87, Almroth-Rosell, E., K. Eilola, I. Kuznetsov, P. Hall, and H. E. M. Meier, A new approach to model oxygen dependent benthic phosphate fluxes in the Baltic Sea. J. Mar. Syst. 144: DOI: /j.jmarsys Eilola, K., Almroth, E., J. Naustvoll, P. Andersen and B. Karlson, Modelling the dynamics of harmful blooms of Chattonella sp. in the Skagerrak and the Kattegat. ICES CM 2006/E12, ICES Annual Science conference. Eilola, K., H.E.M. Meier and E. Almroth, On the dynamics of oxygen, phosphorus and cyanobacteria in the Baltic Sea; A model study. J. Mar. Sys., 75, pp Eilola, K., B. G. Gustafson, I. Kuznetsov, H. E. M. Meier, T. Neumann and O. P. Savchuk, 2011: Evaluation of biogeochemical cycles in an ensemble of three state-of-the-art numerical models of the Baltic Sea. J. Mar. Sys., 88, pp Eilola, K., E. Almroth Rosell, C. Dieterich, F. Fransner, A. Höglund and H. E. M. Meier, 2012: Modeling nutrient transports and exchanges of nutrients between shallow regions and the open Baltic Sea in present and future climate. AMBIO, Vol. 41, Issue 6, , DOI: /s Eilola, K., S. Mårtensson, and H. E. M. Meier, 2013: Modeling the impact of reduced sea ice cover in future climate on the Baltic Sea biogeochemistry. Geophys. Res. Lett., Vol. 40, 1-6, doi: /2012gl Eilola, K., E. Almroth Rosell, and H. E. M. Meier, 2014: Impact of saltwater inflows on phosphorus cycling and eutrophication in the Baltic Sea. A 3D model study. Tellus A, 66, 23985, Hordoir, R., L. Axell, U. Löptien, H. Dietze, and I. Kuznetsov, Influence of sea level rise on the dynamics of salt inflows in the Baltic Sea. Journal of Geophysical Research: Oceans, 120(10), Kuznetsov, I., K. Eilola, C. Dieterich, R. Hordoir, L. Axell, A. Höglund and S. Schimanke, Model study on the variability of ecosystem parameters in the Skagerrak - Kattegat area, effect of load reduction in the North Sea and possible effect of BSAP on Skagerrak - Kattegat area. SMHI Report series Oceanography. No.?? Marmefelt, E., Arheimer, B., Langner, J., An integrated biochemical model system for the Baltic Sea. Hydrobiologia 393,
74 Meier, H.E.M., Andersson, H. C., Arheimer, B., Blenckner, T., Chubarenko, B., Donnelly, C., Eilola, K., Gustafsson, B. G., Hansson, A., Havenhand, J., Höglund, A., Kuznetsov, I., MacKenzie, B. R., Müller- Karulis, B., Neumann, T., Niiranen, S., Piwowarczyk, J., Raudsepp, U., Reckermann, M., Ruoho- Airola, T., Savchuk, O. P., Schenk, F., Schimanke, S., Väli, G., Weslawski, J.-M., and Zorita, E., 2012: Comparing reconstructed past variations and future projections of the Baltic Sea ecosystem first results from multi-model ensemble simulations. Environ. Res. Lett , doi: / /7/3/ Sahlberg, J., The Coastal Zone Model. SMHI Report series Oceanography. No Skogen, M.D., K. Eilola, J.L.S. Hansen, H.E.M. Meier, M.S. Molchanov, and V.A. Ryabchenko, Eutrophication Status of the North Sea, Skagerrak, Kattegat and the Baltic Sea in present and future climates: A model study. Journal of Marine Systems, 132,
75 ANNEX 2 Assessment of zoobenthos Marine Monitoring
76

77 1 Benthic macrofauna in the open sea and coastal areas of Skagerrak, Kattegat and Öresund Rutger Rosenberg a,b, Mats Blomqvist c Marina Magnusson a a Marine Monitoring AB, b University of Gothenburg, c Hafok Stations sampled in this analysis are shown in Figure 1, with depths ranging from 15 to 106 m. Information about faunal composition is from the Swedish National and Regional Programme, the Coastal Programme in Halland, the Öresund Coastal Water Programme and the Helsingborg city Coastal Water Programme. All samples were obtained by a 0.1 m 2 Smith-McIntyre grab, sieved on 1 mm meshes and preserved in either formalin or ethanol. Number of samples varied between 1 and 5 per sample occasion. Figure 1. Stations where benthic fauna were sampled in Skagerrak, Kattegat and Öresund. Light blue colour is shallow water and dark blue deeper water. Marine Monitoring AB Strandvägen 9, Lysekil
78 2 The temporal changes in species richness, abundance, biomass and benthic quality index (BQI) are shown in Figures 2 to 5 for the different sea areas. The time periods for sampling varied between areas, but extend backwards for more than a decade. For Skagerrak Open Sea, data are missing from years 2012 and 2014, and for Öresund data is incomplete after Mean richness varied between 22 and 41 species per 0.1 m 2 with greatest numbers generally in Skagerrak Open Sea (Figure 2). Lowest mean richness over the last nine years was recorded in Kattegat Open Sea. A general declining trend in mean richness is shown for some areas from 2002 to 2007, followed by occasional recoveries. Richness in Skagerrak Fjords showed an increase from 2009 to Figure 2. Temporal changes in mean species richness per 0.1 m 2 with standard error in different sea areas. Mean abundances for the different sea areas are shown in Figure 3. Lowest abundances over the sampling period were found in Kattegat Open Sea and Kattegat Coast. In the other sea areas, mean abundances were above 200 per 0.1 m 2, and for Skagerrak Fjord and Skagerrak Coast the greatest means over the period were recorded in Figure 3. Temporal changes in mean abundance per 0.1 m 2 with standard error in different sea areas. Marine Monitoring AB Strandvägen 9, Lysekil
79 3 Mean biomasses for the different sea areas are shown in Figure 4. The greatest biomasses were generally recorded in Open Skagerrak and Öresund, the latter with great temporal variations. Skagerrak Coast, Kattegat Coast and Kattegat Open Sea had intermediate biomasses, and Skagerrak Fjord had the lowest means over the investigated period. The great variation at some stations and times are explained by occasional findings of some large individuals. Figure 4. Temporal changes in mean biomass (formalin wet weight; in Öresund ethanol wet weight) per 0.1 m 2 with standard error in different sea areas. Temporal changes in the Benthic Quality Index (BQI) are shown in Figure 5. Theory and calculation about the BQI are found in (Rosenberg et al. 2004) and (Leonardsson et al. 2009) The border between Good and Moderate status according to the EU Water Framework Directive is set at BQI = 12. The status in Skagerrak Open Sea has been Good during the sampling period, and also for Kattegat Open Sea from year 1998 to 2003 and in 2011 and Öresund showed periods of Good status, and the other sea areas were mainly qualified into Moderate status. Kattegat Open Sea, Kattegat Open Coast, and Skagerrak Coast generally showed their lowest BQI-values during years 2007 to 2010, followed by an increased mean BQI. Skagerrak Fjords had the lowest mean BQI during the years 2003 to 2009 and For Kattegat Coast and Skagerrak Coast this is a decline from what was reported in the previous Ospar (2007) assessment report (Figure 5.8) for the years 2002 to The reason for the discrepancy is suggested to be mainly caused by the introduction and use of new species tolerance values. Marine Monitoring AB Strandvägen 9, Lysekil
80 4 Figure 5. Temporal changes in mean Benthic Quality Indices (BQI) per 0.1 m 2 with standard error in different sea areas. The borderline between Good and Moderate is indicated at BQI = 12. Changes in similarities in faunal composition of the benthic communities have been analysed for all stations using Multi Dimensional Scaling (MDS, Bray Curtis similarity). The MDSplots from stations in the six areas showed no obvious changes in faunal composition over time; rather the general pattern was that faunal composition was different between stations (illustrations not shown). In addition to the benthic faunal analyses, benthic habitat quality was also assessed in three fjords: Gullmarsfjord, Havstensfjord and Koljöfjord, and three coastal areas: Laholm Bay, Skälderviken and northern Öresund from 2002 (Figure 6). The assessment was based on digital analysis of sediment profiles obtained in situ by a sediment profile camera (SPI; data from Magnusson (2011 and 2014). The technique resembles an up-side-down periscope that penetrates about 24 cm into the sediment with a prism with a width of about 17 cm. Twelve stations were randomly visited in each area and separated into three depth strata. The assessment was made by digitally analysing the functional diversity in the sediment: biogenic structures on the sediment surface, biogenic structures in the sediment, and the mean depth of the apparent Redox Potential Discontinuity (arpd). These measurements combined are used to calculate the Benthic Habitat Quality (BHQ) index, which varies between 0 and 15 (Nilsson and Rosenberg 1997). Marine Monitoring AB Strandvägen 9, Lysekil
 indices in three fjords (top) and three coastal areas (bottom) digitally analysed from Sediment Profile Images (SPI). Stratum 1 is shallow and stratum 3 the deepest.")
81 5 Gullmarsfjord Havstensfjord Koljefjord Years Years Years Laholm Bay Skälderviken Öresund Years Years Years Stratum 1 Stratum 2 Stratum 3 All depths Figure 6. Benthic Habitat Quality (BHQ) indices in three fjords (top) and three coastal areas (bottom) digitally analysed from Sediment Profile Images (SPI). Stratum 1 is shallow and stratum 3 the deepest. The depth interval in the different strata varied between areas. These studies have been discontinued due to lack of funding. The bold line for the mean BHQ in each area has been colored according to the classification of the seabed environmental status of the area, allocated on the basis of the latest results. Dotted line for deep stratum has only been coloured if the current depth stratum deviated from the latest area classification. The different colours refers to a preliminary assessment of the environmental status in accordance with WFD; blue = High, green = Good, yellow = Moderate, orange = Unsatisfactory, and red = Poor. Gullmarsfjord had the greatest benthic quality as shown by high BHQs. Havstensfjord was disturbed by periodic hypoxia, particularly in the beginning of the investigation, and Koljefjord is severely affected by anoxia and hypoxia in the deeper parts. Skälderviken and Öresund showed rather god environmental condition and similar over time, whereas Laholm Bay had worse and variable conditions in the two shallow strata because of seasonal hypoxia. The border between Good and Moderate was assessed for BHQ in comparison with BQI and suggested to be 6 for depths <20 m and 7 for depths >20 m (Rosenberg et al. 2009). Based on this quality assessment, Gullmarsfjord, Skälderviken and Öresund had Good status, Havstensfjord improved over time to Good status at the deeper two strata, the deep stratum in Laholm Bay had Good status, whereas the status in Koljefjord was Bad to Moderate. Mean depths of the apparent Redox Potential Discontinuity (arpd) were also measured digitally in the SPIs presented above (Figure 7). arpd equals the border between oxidized and reduced sediment, and the depth reflects their vertical distribution of irrigation and bioturbation activities of the benthic animals. Mean arpd was deepest in Gullmarsfjord, intermediate in Skälderviken, Laholm Bay and Öresund, and lowest in Havstensfjord and Koljefjord. A general drop was recorded from 2005 to 2006, but this was not indicated in the faunal or BHQ data. Marine Monitoring AB Strandvägen 9, Lysekil
 of depth of the apparent Redox Potential Discontinuity (arpd) in the sediment in six different coastal and fjordic areas in")
82 6 Figure 7. Temporal changes in means and variations (95% confidence intervals) of depth of the apparent Redox Potential Discontinuity (arpd) in the sediment in six different coastal and fjordic areas in Skagerrak, Kattegat and Öresund. Conclusions It has been known for decades that coastal areas and fjords in Skagerrak, southern Kattegat, and Öresund have been severely affected by localized and regional eutrophication-induced hypoxia. Demersal trawling and initial global warming could have affected the fauna at some stations. A clear general negative trend in BQI was detected in Kattegat Open Sea during 2003 up to 2010, and other areas as Skagerrak Fjord, Skagerrak Coast and Kattegat Coast had a Moderate status during that period. Subsequently conditions generally improved, but declined for Skagerrak Fjord in The reason for the general declines are not known as measurements of likely impact factors such as oxygen condition, food availability and predation pressure are not studied with enough frequency and spatial resolution. For their growth and reproduction, benthic animals are dependant on the quantity and quality of food, which is transported to the seabed by horizontal and vertical advection. Benthic animals could benefit from a mild eutrophication. The data set is not complete for all areas and years over the period 2006 to Comparing this period with the status before 2006, no general trend is found for any of the variables analysed, except for Havstensfjord where analyses of SPIs showed a positive temporal trend. Previous conducted multi-disciplinary research programmes in the areas and regional studies of dose-response effects have all been discontinued. New research programmes are needed for supporting the interpretation of monitoring data. Marine Monitoring AB Strandvägen 9, Lysekil
83 7 References Leonardsson, K., M. Blomqvist and R. Rosenberg (2009). Theoretical and practical aspects on benthic quality assessment according to the EU-Water Framework Directive - examples from Swedish waters. Mar. Pollut. Bull. 59: Magnusson, M., 2014, Bottenmiljön i tre fjordar i Skagerrak analyserad genom fotografering av sedimentprofiler (SPI) 2013; Bohuskustens vattenvårdsförbund ISBN Magnusson, M., 2011, Bottenmiljön i Kattegatt & tre fjordar i Skagerrak analyserad genom fotografering av sedimentprofiler (SPI) 2011; Bohuskustens vattenvårdsförbund ISBN Nilsson, H. C. and R. Rosenberg (1997). Benthic habitat quality assessment of an oxygen stressed fjord by surface and sediment profile images. J. Mar. Syst. 11: Rosenberg, R., M. Magnusson and H. C. Nilsson (2009). Temporal and spatial changes in marine habitats in relation to the EU Water Framework Directive: The use of sediment profile imagery. Mar. Pollut. Bull. 58: Rosenberg, R., M. Blomqvist, C. H. Nilsson, H. Cederwall and A. Dimming (2004). Marine quality assessment by use of benthic spcies-abundance distributions; a proposed new protocol within the European Union Water Framework Directive. Mar. Pollut. Bull. 49: Marine Monitoring AB Strandvägen 9, Lysekil
84
85 ANNEX 3 Time series of assessment parameters ANNEX 3
86 Annex 3 includes data plots for the application of the Common Procedure ANNEX 3 Figure 1. Mixing diagrams for DIN Figure 2. Mixing diagrams for DIP Figure 3. Mixing diagrams for Tot-N winter Figure 4. Mixing diagrams for Tot-N summer... 7 Figure 5. Mixing diagrams for Tot-P winter Figure 6. Mixing diagrams for Tot-P summer Figure 7. Mixing diagrams for silicate Figure 8. Time series of mean winter DIN in coastal water Figure 9. Time series of mean winter DIN in coastal water Figure 10. Time series of mean winter DIN in offshore water Figure 11. Time series of mean winter DIP in coastal water Figure 12. Time series of mean winter DIP in coastal water Figure 13. Time series of mean winter DIP in offshore water Figure 14. Time series of mean winter silicate in coastal water Figure 15. Time series of mean winter silicate in coastal water Figure 16. Time series of mean winter silicate in offshore water Figure 17. Time series of mean winter Tot-N in coastal water Figure 18. Time series of mean winter Tot-N in coastal water Figure 19. Time series of mean winter Tot-N in offshore water Figure 20. Time series of mean winter Tot-P in coastal water Figure 21. Time series of mean winter Tot-P in coastal water Figure 22. Time series of mean winter Tot-P in offshore water Figure 23. Time series of mean summer Tot-N in coastal water Figure 24. Time series of mean summer Tot-N in coastal water Figure 25. Time series of mean summer Tot-N in offshore water Figure 26. Time series of mean summer Tot-P in coastal water Figure 27. Time series of mean summer Tot-P in coastal water Figure 28. Time series of mean summer Tot-P in offshore water Figure 29. Winter N/P ratios for the open sea. Orange line is the OSPAR 50% elevated assessment level, green line is the Redfield ratio Figure 30. Time series of mean summer chlorophyll a in coastal water Figure 31. Time series of mean summer chlorophyll a in coastal water Figure 32. Time series of mean summer chlorophyll a in offshore water Figure 33. Time series of mean summer Secchi depth in coastal water Figure 34. Time series of mean summer Secchi depth in coastal water Figure 35. Time series of mean summer Secchi depth in offshore water Figure 36. Time series of the mean bottom oxygen concentration in autumn in coastal water. Data is from the lowest quartile of data. Negative values are hydrogen sulphide expressed as negative values Annex3_timeseries 1
87 ANNEX 3 Figure 37. Time series of the mean bottom oxygen concentration in autumn in coastal water. Data is from the lowest quartile of data Figure 38. Time series of the mean bottom oxygen concentration in autumn in offshore water. Data is from the lowest quartile of data Figure 39. Time series of the mean bottom oxygen saturation in autumn in coastal water. Data is from the lowest quartile of data Figure 40. Time series of the mean bottom oxygen saturation in autumn in coastal water. Data is from the lowest quartile of data Figure 41. Time series of the mean bottom oxygen saturations in autumn in offshore water. Data is from the lowest quartile of data Figure 42. Box plots of POC in coastal waters Figure 43. Box plots of POC in coastal waters Figure 44. Summer means of biovolume data from each assessment unit in coastal water. No trends observed Figure 45. The dinoflagellate Noctiluca scintillans tends to have increased during the time period at station Danafjord in assessment unit 1s Figure 46. The left diagram shows the seasonal distribution of Pseudochattonella species ( ) at station L9 Laholmsbukten in assessment unit 5, the right diagram is an anomaly diagram and shows the occasions when the species deviate from average per month. Red staples mean positive and blue staples mean negative deviations Figure 47. Time series of the three potentially toxic dinoflagellates Dinophysis acuminata, D. acuta and D. norvegica. The species tend to increase at station Danafjord in assessment unit 1s, amongst others Figure 48. Time series of the potentially toxic dinoflagellate genus Alexandrium. The species tend to increase at station Havstensfjord in assessment unit Figure 49. The left diagram shows the seasonal distribution of Karenia mikimotoi ( ) at station Kosterfjorden in assessment unit 3, the right diagram is an anomaly diagram and shows the occasions when the species deviate from average per month. Red staples mean positive and blue staples mean negative deviations Figure 50. The potentially toxic diatom genus Pseudo-nitzschia tends to have increased at station L9 Laholmsbukten in assessment unit 5, Figure 51. The left diagrams show the seasonal distribution of three Dinophysis species ( ) at station Koljöfjord in assessment unit 2. The right diagrams are anomaly diagrams and show the occasions when the species deviate from average per month. Red staples mean positive and blue staples mean negative deviations Figure 52. DST (Dinophysis Shellfish Toxin) distribution at the Skagerrak coast The red dotted line is the warning limit, which is at 160 µg per 100 g mussel meat Figure 53. Distribution of the dinoflagellate Alexandrium spp. in April 2014 at the Swedish west coast. The red dots mean presence and the blue dots mean absence of the genus Figure 54. The diagram shows the distribution of PST (Paralystic Shellfish Toxin) in blue mussels PST is produced by species in the genus Alexandrium Figure 55. A tendency to an increase in total abundance of phytoplankton cells was found in assessment unit 5, Figure 56. Time series of the class Dinophyceae (dinoflagellates), , all sampling occasions at station Danafjord in assessment unit 1s Figure 57. Summer mean (June-August) of the class Dinophyceae (dinoflagellates), at station Danafjord in assessment unit 1s Figure 58. Classification time series of DIN Figure 59. Classification time series of DIP Figure 60. Classification time series of Tot-N summer Figure 61. Classification time series of Tot-N winter Annex3_timeseries 2
88 ANNEX 3 Figure 62. Classification time series of tot-p summer Figure 63. Classification time series of Tot-P winter Figure 64. Classification time series of chlorophyll a summer Figure 65. Classification time series of Secchi depth Figure 66. Classification time series of bottom oxygen concentration Annex3_timeseries 3
89 ANNEX 3 1. Mixing diagrams. The concentrations of nutrients are only normalised if the relation is significant to the 95%- confidence level (p<0.05). Figure 1. Mixing diagrams for DIN. Annex3_timeseries 4
90 ANNEX 3 Figure 2. Mixing diagrams for DIP. Annex3_timeseries 5
91 ANNEX 3 Figure 3. Mixing diagrams for Tot-N winter. Annex3_timeseries 6

92 ANNEX 3 Figure 4. Mixing diagrams for Tot-N summer. Annex3_timeseries 7
93 ANNEX 3 Figure 5. Mixing diagrams for Tot-P winter. Annex3_timeseries 8

94 ANNEX 3 Figure 6. Mixing diagrams for Tot-P summer. Annex3_timeseries 9
95 ANNEX 3 Figure 7. Mixing diagrams for silicate. Annex3_timeseries 10
96 2. Time series of nutrients, chlorophyll-a, Secchi depth, oxygen, and POC. Red line is the Swedish boundary for Good/Moderate. ANNEX 3 When data are normalised, the observed (not-normalised value) is shown as an open circle. Trend lines are only shown when significant (p<0.05). The longer time period for trends is (black) and the shorter is (blue). The method for analyzing Tot-P changed in 2005 and the data sets before and after the change are not totally comparable. Therefore, no trend for the long time period has been analyzed for Tot-P. Figure 8. Time series of mean winter DIN in coastal water. Annex3_timeseries 11
97 ANNEX 3 Figure 9. Time series of mean winter DIN in coastal water. Figure 10. Time series of mean winter DIN in offshore water. Annex3_timeseries 12
98 ANNEX 3 Figure 11. Time series of mean winter DIP in coastal water. Annex3_timeseries 13
99 ANNEX 3 Figure 12. Time series of mean winter DIP in coastal water. Figure 13. Time series of mean winter DIP in offshore water. Annex3_timeseries 14
100 ANNEX 3 Figure 14. Time series of mean winter silicate in coastal water. Annex3_timeseries 15
101 ANNEX 3 Figure 15. Time series of mean winter silicate in coastal water. Figure 16. Time series of mean winter silicate in offshore water. Annex3_timeseries 16
102 ANNEX 3 Figure 17. Time series of mean winter Tot-N in coastal water. Annex3_timeseries 17
103 ANNEX 3 Figure 18. Time series of mean winter Tot-N in coastal water. Figure 19. Time series of mean winter Tot-N in offshore water. Annex3_timeseries 18
104 ANNEX 3 Figure 20. Time series of mean winter Tot-P in coastal water. Annex3_timeseries 19
105 ANNEX 3 Figure 21. Time series of mean winter Tot-P in coastal water. Figure 22. Time series of mean winter Tot-P in offshore water. Annex3_timeseries 20
106 ANNEX 3 Figure 23. Time series of mean summer Tot-N in coastal water. Annex3_timeseries 21
107 ANNEX 3 Figure 24. Time series of mean summer Tot-N in coastal water. Figure 25. Time series of mean summer Tot-N in offshore water. Annex3_timeseries 22
108 ANNEX 3 Figure 26. Time series of mean summer Tot-P in coastal water. Annex3_timeseries 23
109 ANNEX 3 Figure 27. Time series of mean summer Tot-P in coastal water. Figure 28. Time series of mean summer Tot-P in offshore water. Annex3_timeseries 24
110 ANNEX 3. Figure 29. Winter N/P ratios for the open sea. Orange line is the OSPAR 50% elevated assessment level, green line is the Redfield ratio. Annex3_timeseries 25
111 ANNEX 3 Figure 30. Time series of mean summer chlorophyll a in coastal water. Annex3_timeseries 26
112 ANNEX 3 Figure 31. Time series of mean summer chlorophyll a in coastal water. Figure 32. Time series of mean summer chlorophyll a in offshore water. Annex3_timeseries 27
113 ANNEX 3 Figure 33. Time series of mean summer Secchi depth in coastal water. Annex3_timeseries 28
114 ANNEX 3 Figure 34. Time series of mean summer Secchi depth in coastal water. Figure 35. Time series of mean summer Secchi depth in offshore water. Annex3_timeseries 29
115 ANNEX 3 Figure 36. Time series of the mean bottom oxygen concentration in autumn in coastal water. Data is from the lowest quartile of data. Negative values are hydrogen sulphide expressed as negative values. Annex3_timeseries 30
116 ANNEX 3 Figure 37. Time series of the mean bottom oxygen concentration in autumn in coastal water. Data is from the lowest quartile of data. Figure 38. Time series of the mean bottom oxygen concentration in autumn in offshore water. Data is from the lowest quartile of data. Annex3_timeseries 31
117 ANNEX 3 Figure 39. Time series of the mean bottom oxygen saturation in autumn in coastal water. Data is from the lowest quartile of data. Annex3_timeseries 32
118 ANNEX 3 Figure 40. Time series of the mean bottom oxygen saturation in autumn in coastal water. Data is from the lowest quartile of data. Figure 41. Time series of the mean bottom oxygen saturations in autumn in offshore water. Data is from the lowest quartile of data. Annex3_timeseries 33
119 ANNEX 3 Figure 42. Box plots of POC in coastal waters. Annex3_timeseries 34
120 ANNEX 3 Figure 43. Box plots of POC in coastal waters. Annex3_timeseries 35


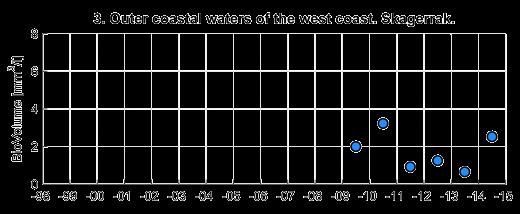
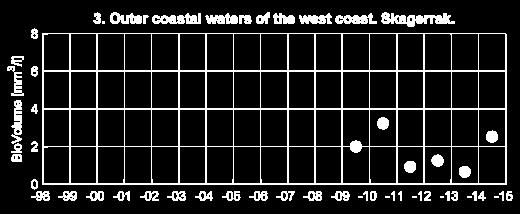
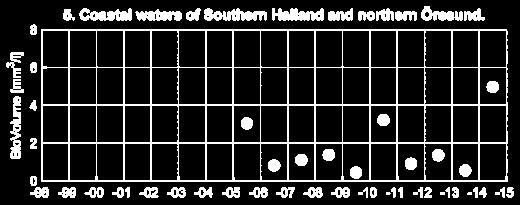
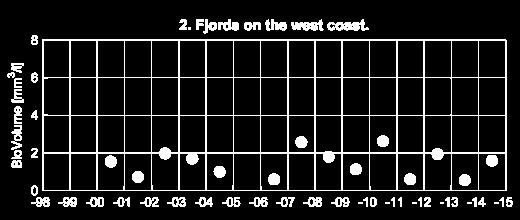

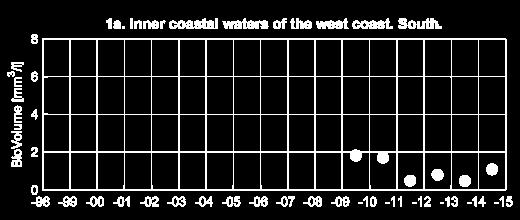
121 3. Time series of phytoplankton ANNEX 3 Figure 44. Summer means of biovolume data from each assessment unit in coastal water. No trends observed. Annex3_timeseries 36
122 ANNEX 3 Figure 45. The dinoflagellate Noctiluca scintillans tends to have increased during the time period at station Danafjord in assessment unit 1s. Figure 46. The left diagram shows the seasonal distribution of Pseudochattonella species ( ) at station L9 Laholmsbukten in assessment unit 5, the right diagram is an anomaly diagram and shows the occasions when the species deviate from average per month. Red staples mean positive and blue staples mean negative deviations. Figure 47. Time series of the three potentially toxic dinoflagellates Dinophysis acuminata, D. acuta and D. norvegica. The species tend to increase at station Danafjord in assessment unit 1s, amongst others. Annex3_timeseries 37
123 ANNEX 3 Figure 48. Time series of the potentially toxic dinoflagellate genus Alexandrium. The species tend to increase at station Havstensfjord in assessment unit 2. Figure 49. The left diagram shows the seasonal distribution of Karenia mikimotoi ( ) at station Kosterfjorden in assessment unit 3, the right diagram is an anomaly diagram and shows the occasions when the species deviate from average per month. Red staples mean positive and blue staples mean negative deviations. Figure 50. The potentially toxic diatom genus Pseudo-nitzschia tends to have increased at station L9 Laholmsbukten in assessment unit 5, Figure 51. The left diagrams show the seasonal distribution of three Dinophysis species ( ) at station Koljöfjord in assessment unit 2. The right diagrams are anomaly diagrams and show the occasions when the species deviate from average per month. Red staples mean positive and blue staples mean negative deviations. Annex3_timeseries 38

124 ANNEX 3 Figure 52. DST (Dinophysis Shellfish Toxin) distribution at the Skagerrak coast The red dotted line is the warning limit, which is at 160 µg per 100 g mussel meat. Figure 53. Distribution of the dinoflagellate Alexandrium spp. in April 2014 at the Swedish west coast. The red dots mean presence and the blue dots mean absence of the genus. Annex3_timeseries 39

125 ANNEX 3 Figure 54. The diagram shows the distribution of PST (Paralystic Shellfish Toxin) in blue mussels PST is produced by species in the genus Alexandrium. Figure 55. A tendency to an increase in total abundance of phytoplankton cells was found in assessment unit 5, Figure 56. Time series of the class Dinophyceae (dinoflagellates), , all sampling occasions at station Danafjord in assessment unit 1s. Figure 57. Summer mean (June-August) of the class Dinophyceae (dinoflagellates), at station Danafjord in assessment unit 1s. Annex3_timeseries 40
126 4. Time series of status classification ANNEX 3 Annex3_timeseries 41
127 ANNEX 3 Figure 58. Classification time series of DIN. Figure 59. Classification time series of DIP. Annex3_timeseries 42
128 ANNEX 3 Figure 60. Classification time series of Tot-N summer. Figure 61. Classification time series of Tot-N winter. Annex3_timeseries 43
129 ANNEX 3 Figure 62. Classification time series of tot-p summer. Figure 63. Classification time series of Tot-P winter. Annex3_timeseries 44
130 ANNEX 3 Figure 64. Classification time series of chlorophyll a summer. Figure 65. Classification time series of Secchi depth. Annex3_timeseries 45
131 ANNEX 3 Figure 66. Classification time series of bottom oxygen concentration. Annex3_timeseries 46
132
133 ANNEX 4 Reporting format on the results of the OSPAR Comprehensive Procedure ANNEX 4
. 2.")
134 ANNEX 4 Reporting format on the Swedish results of the OSPAR Comprehensive Procedure 1. The Skagerrak, Kattegat and the Sound Figure 1 Generalized circulation pattern in Skagerrak and Kattegat (B. Karlsson, SMHI). 2. Description of the area Open Sea The Kattegat and the Skagerrak, with surface areas of about and km 2 and mean depths of 23 m and 210 m, respectively, constitutes the outer part of the transition zone between the estuarine Baltic Sea and the oceanic North Sea, see Figure 1. The Skagerrak can be considered as a fjord with a sill depth of 270 metres and a maximum depth of about 700 metres. In Skagerrak there is an almost permanent cyclonic circulation. Considerable short time variations occur due to shifting winds; south-westerly winds reinforce the circulation while north-easterly winds weaken it (Aure and Saetre 1981). Skagerrak receives water from three different sources. Kattegat surface water with salinities of (Andersson and Rydberg, 1993), Atlantic water, with salinities of , enters along the west side of the Norwegian Trench forming intermediate and deep water (Furnes et al 1986) and a mixture of North Sea waters in the salinity range entering from west and south-west, mainly as surface water along the northern Jutland off the Danish coast (the Jutland current). Low salinity in this water indicates recirculation of Baltic water or a high proportion of river water from the southern North Sea. The Kattegat has a typical two layer stratification, were the halocline is located at a depth of about 15 m. The deep water consists of Skagerrak water, with a typical salinity of about 34, while the surface water, with salinities between 15 and 30, is a mixture of deep water and low saline water from the Baltic. The assessment of the open sea is based on data within the Swedish economic zone. 1
135 Coastal zone ANNEX 4 Coastal waters are delimited from offshore waters making use of the Water Framework Directive methodology i.e. the border is set one nautical mile offshore a line connecting the outermost archipelago (skerries) off the coastline (NFS-2006:1). The assessed coastal waters are divided into 8 water types, according to the WFD; Skagerrak consists of inner and outer coastal waters (type 1n and 3) and the fjords (type 2), Kattegat consists of inner and outer coastal waters (type 1s and 4), southern Halland and the northern waters of the Sound (type 5), the Sound (type 6) and the transitional waters of Göta- and Nordre Älv (type 25), figure 1. According to the Swedish regulation of the WFD each water type consists of several smaller water bodies. In the national WFD-reporting, assessment is made on each water body. Of practical reasons it has been decided to make the COMP-assessment on water types instead of water bodies. The border between Kattegat and Skagerrak is drawn from the north eastern tip of Jutland in Denmark to the City of Goteborg in Sweden following the HELCOM convention. The main river entering the assessed area is Göta Älv just at the border between the two sub-basins. The general circulation along the west coast of Sweden is in the northward direction and hence most of the river water is mixed into the coastal water north of the mouth. Thus the area of coastal Skagerrak is mostly affected by this freshwater inflow. The typology of the coastal waters is governed by a high salinity range, stratified with a shallow halocline and of relatively high influence of surface water. The southern part of the Swedish Kattegat coast is open and mostly flat, low-lying with beaches of sand or moraine. In the southernmost part there are two open, relatively large bays, the Laholm Bay and Skälderviken. In the northern part the sandy beaches are replaced by rocky ones and some skerries, there is also a shallow bay, Kungsbackafjorden. This type of coast continues into the southern part of the Swedish Skagerrak coast which gradually changes into a more rugged coastline to the north. The main part of the Skagerrak coast consists of islands, skerries and fjords, locally with high coastal hills and steep cliffs. 3. Monitoring design National monitoring cruises take place monthly, visiting a mixture of coastal and offshore stations, including a transect of stations across the Baltic current as it enters the Skagerrak. Measurements taken at Släggö, a coastal station, and Anholt E, in the southern Kattegat occur twice a month. CTD profiles are taken at all stations, and at all stations except two, samples for the analysis of inorganic and total nutrient concentrations are taken from standard depths. Chlorophyll concentrations are analysed at all stations. In addition to these monthly cruises, more intensive sampling occurs in winter for nutrient mapping and in autumn for mapping the extent of low oxygen levels. Monitoring of near shore, estuarine and fjord stations is organised by Vattenvårdsförbund. These are associations of regional stakeholders, such as county administrations and the larger polluters. Monthly sampling is carried out at 15 stations along the Bohuslän coast. Along the Swedish Kattegat coast, monthly measurements are made within a fjord system (Kunsbackafjorden) and in the large bays in the south of the region (Laholm Bay and Skälderviken). 2

136 4. Assessment scheme per assessment unit ANNEX Skagerrak open sea Skagerrak is the connection with the North Sea where high-salinity deep water enters the region and the surface water is influenced of the low-salinity outflow from the Baltic Sea. Skagerrak forms the inner end of the Norwegian deep trench (700 m) with a sill depth of 270 m. Category Assessment Parameters Description of Results Score (+ -?) Aggregated confidence rating Degree of Nutrient Enrichment (I) Riverine inputs and direct discharges of total N and total P (-) Decreasing trends in TN and TP Winter DIN concentrations Winter DIP concentrations (-) in (-) in Winter N/P ratio (Redfield N/P = 16) (-) in Direct Effects (II) 90 th percentile, maximum and mean chlorophyll a concentration Area-specific phytoplankton indicator species (-) in (-) in Macrophytes including macroalgae (?)? Indirect Effects (III) Oxygen deficiency (-) in Changes/kills in zoobenthos and fish kills (-) in Organic carbon/organic matter (?)? Other Possible Effects (IV) Algal toxins (DSP/PSP mussel infection events) (?)? Key to the Score + = Increased trends, elevated levels, shifts or changes in the respective assessment parameters - = Neither increased trends nor elevated levels nor shifts nor changes in the respective assessment parameters? = Not enough data to perform an assessment or the data available are not fit for the purpose 3

137 ANNEX Area of the inner coastal waters of the west coast. North. (1n) The inner coastal waters of Skagerrak are composed by skerries and shallow bays and hold many sheltering islands. Bottom is clay or hard. Category Assessment Parameters Description of Results Score (+ -?) Aggregated confidence rating Degree of Nutrient Enrichment (I) Riverine inputs and direct discharges of total N and total P (-) Decreasing trends in TN and TP Winter DIN concentrations Winter DIP concentrations (-) in (-) in Winter N/P ratio (Redfield N/P = 16) (?)? Direct Effects (II) 90 th percentile, maximum and mean chlorophyll a concentration Area-specific phytoplankton indicator species (+) (+) Macrophytes including macroalgae (-) in (WFD) - Indirect Effects (III) Oxygen deficiency (-) in Changes/kills in zoobenthos and fish kills (+) in ?- Organic carbon/organic matter (-) POC in Other Possible Effects (IV) Algal toxins (DSP/PSP mussel infection events) (+)Several occasions with DST infections, one with PST Key to the Score + = Increased trends, elevated levels, shifts or changes in the respective assessment parameters - = Neither increased trends nor elevated levels nor shifts nor changes in the respective assessment parameters? = Not enough data to perform an assessment or the data available are not fit for the purpose 4
138 ANNEX Outer coastal waters of the west coast. Skagerrak. (3) The Skagerrak outer coastal water is mainly a deep and open area with some sheltering islands in the inner parts. Permanently stratified. Bottom substrate is clay or hard. Category Assessment Parameters Description of Results Score (+ -?) Aggregated confidence rating Degree of Nutrient Enrichment (I) Riverine inputs and direct discharges of total N and total P (-) Decreasing trends in TN and TP Winter DIN concentrations Winter DIP concentrations (-) in (-) in Winter N/P ratio (Redfield N/P = 16) (?)? Direct Effects (II) 90 th percentile, maximum and mean chlorophyll a concentration Area-specific phytoplankton indicator species (-) in (+) in Macrophytes including macroalgae (-) in (WFD) - Indirect Effects (III) Oxygen deficiency (-) in Changes/kills in zoobenthos and fish kills (+) in ?- Organic carbon/organic matter (+) POC in Other Possible Effects (IV) Algal toxins (DSP/PSP mussel infection events) (?)? Key to the Score + = Increased trends, elevated levels, shifts or changes in the respective assessment parameters - = Neither increased trends nor elevated levels nor shifts nor changes in the respective assessment parameters? = Not enough data to perform an assessment or the data available are not fit for the purpose 5

139 ANNEX Fjords on the west coast. Skagerrak. (2) Fjords on the west coast are deep basins with shallow sills at the entrance. Circulation of the deep water is often restricted with stagnant bottom water and oxygen deficiency as a consequence. Category Assessment Parameters Description of Results Score (+ -?) Aggregated confidence rating Degree of Nutrient Enrichment (I) Riverine inputs and direct discharges of total N and total P (-) Decreasing trends in TN and TP Winter DIN concentrations Winter DIP concentrations (-) in (+) in Winter N/P ratio (Redfield N/P = 16) (?)? Direct Effects (II) 90 th percentile, maximum and mean chlorophyll a concentration Area-specific phytoplankton indicator species (-) in (+) in Macrophytes including macroalgae (-) in (WFD) - Indirect Effects (III) Oxygen deficiency (+) in Changes/kills in zoobenthos and fish kills (+) in Organic carbon/organic matter (-) POC in Other Possible Effects (IV) Algal toxins (DSP/PSP mussel infection events) (+) Several occasions of DST infections, one PST ( ) Key to the Score + = Increased trends, elevated levels, shifts or changes in the respective assessment parameters - = Neither increased trends nor elevated levels nor shifts nor changes in the respective assessment parameters? = Not enough data to perform an assessment or the data available are not fit for the purpose 6

140 4.5 Kattegat open sea ANNEX 4 Kattegat open sea is a flat transitional area between the high saline regime Skagerrak and the low saline regime Baltic Sea. Surface waters are influenced of the brackish outflow from the Baltic Sea while there is a more saline deep water that origins from the North Sea. Category Assessment Parameters Description of Results Score (+ -?) Aggregat ed confidenc e rating Degree of Nutrient Enrichment (I) Riverine inputs and direct discharges of total N and total P (-) Decreasing trends in TN and TP Winter DIN concentrations Winter DIP concentrations (+) in (-) in Winter N/P ratio (Redfield N/P = 16) (-) in Direct Effects (II) 90 th percentile, maximum and mean chlorophyll a concentration Area-specific phytoplankton indicator species (-) in (+) in Macrophytes including macroalgae (?)? Indirect Effects (III) Oxygen deficiency (+) in Changes/kills in zoobenthos and fish kills (+) in Organic carbon/organic matter (?)? Other Possible Effects (IV) Algal toxins (DSP/PSP mussel infection events) (?)? Key to the Score + = Increased trends, elevated levels, shifts or changes in the respective assessment parameters - = Neither increased trends nor elevated levels nor shifts nor changes in the respective assessment parameters? = Not enough data to perform an assessment or the data available are not fit for the purpose 7

141 4.6 Inner coastal waters of the west coast. South. (1s) ANNEX 4 The inner coastal waters of Kattegat are composed by skerries and shallow bays and hold many sheltering islands. Bottom is clay or hard. Category Assessment Parameters Description of Results Score (+ -?) Aggregat ed confidenc e rating Degree of Nutrient Enrichment (I) Riverine inputs and direct discharges of total N and total P (-) Decreasing trends in TN and TP Winter DIN concentrations Winter DIP concentrations (-) in (-) in Winter N/P ratio (Redfield N/P = 16) (?)? Direct Effects (II) 90 th percentile, maximum and mean chlorophyll a concentration Area-specific phytoplankton indicator species (-) in (+) in Macrophytes including macroalgae (-) in (WFD) - Indirect Effects (III) Oxygen deficiency (-) in Changes/kills in zoobenthos and fish kills (+) in Organic carbon/organic matter (+) POC in Other Possible Effects (IV) Algal toxins (DSP/PSP mussel infection events) (?)? Key to the Score + = Increased trends, elevated levels, shifts or changes in the respective assessment parameters - = Neither increased trends nor elevated levels nor shifts nor changes in the respective assessment parameters? = Not enough data to perform an assessment or the data available are not fit for the purpose 8

142 ANNEX Outer coastal waters of the west coast. Kattegat. (4) The Kattegat outer coastal water is mainly a deep and open area with some sheltering islands in the inner parts. Permanently stratified. Bottom substrate is clay or hard. Category Assessment Parameters Description of Results Score (+ -?) Aggregat ed confidenc e rating Degree of Nutrient Enrichment (I) Riverine inputs and direct discharges of total N and total P (-) Decreasing trends in TN and TP Winter DIN concentrations Winter DIP concentrations (-) in (+) in Winter N/P ratio (Redfield N/P = 16) (?)? Direct Effects (II) 90 th percentile, maximum and mean chlorophyll a concentration Area-specific phytoplankton indicator species (-) in (+) in Macrophytes including macroalgae (-) in (WFD) - Indirect Effects (III) Oxygen deficiency (-) in Changes/kills in zoobenthos and fish kills (+) in Organic carbon/organic matter (+) POC in Other Possible Effects (IV) Algal toxins (DSP/PSP mussel infection events) (?)? Key to the Score + = Increased trends, elevated levels, shifts or changes in the respective assessment parameters - = Neither increased trends nor elevated levels nor shifts nor changes in the respective assessment parameters? = Not enough data to perform an assessment or the data available are not fit for the purpose 9

143 ANNEX Coastal waters of southern Halland and the northern Sound. (5) The coastal waters of the southern Halland and the northern Sound are shallow and unsheltered. Bottom substrate is sand and hard. Category Assessment Parameters Description of Results Score (+ -?) Aggregat ed confidenc e rating Degree of Nutrient Enrichment (I) Riverine inputs and direct discharges of total N and total P (-) Decreasing trends in TN and TP Winter DIN concentrations Winter DIP concentrations (-) in (+) in Winter N/P ratio (Redfield N/P = 16) (?)? Direct Effects (II) 90 th percentile, maximum and mean chlorophyll a concentration Area-specific phytoplankton indicator species (-) in (+) in Macrophytes including macroalgae (-) in (WFD) - Indirect Effects (III) Oxygen deficiency (-) in Changes/kills in zoobenthos and fish kills (+) in Organic carbon/organic matter (-) - Other Possible Effects (IV) Algal toxins (DSP/PSP mussel infection events) (?)? Key to the Score + = Increased trends, elevated levels, shifts or changes in the respective assessment parameters - = Neither increased trends nor elevated levels nor shifts nor changes in the respective assessment parameters? = Not enough data to perform an assessment or the data available are not fit for the purpose 10

144 4.9 Coastal waters of the Sound. (6) ANNEX 4 The coastal waters of the Sound are a shallow area with an open coastline, see marked area in the map to the right. The Sound is one of the main passages for water exchange to the Baltic Sea. There is often a two layer stratification separated by a strong halocline. The bottom substrate is sand, clay or hard. Category Assessment Parameters Description of Results Score (+ -?) Aggregat ed confidenc e rating Degree of Nutrient Enrichment (I) Riverine inputs and direct discharges of total N and total P (-) Decreasing trends in TN and TP Winter DIN concentrations Winter DIP concentrations (+) (+) Winter N/P ratio (Redfield N/P = 16) (?)? Direct Effects (II) 90 th percentile, maximum and mean chlorophyll a concentration Area-specific phytoplankton indicator species (+) (-) in ?? Macrophytes including macroalgae (-) (WFD) - Indirect Effects (III) Oxygen deficiency (-) Changes/kills in zoobenthos and fish kills (-) in Organic carbon/organic matter (+) in Other Possible Effects (IV) Algal toxins (DSP/PSP mussel infection events) (?)? Key to the Score + = Increased trends, elevated levels, shifts or changes in the respective assessment parameters - = Neither increased trends nor elevated levels nor shifts nor changes in the respective assessment parameters? = Not enough data to perform an assessment or the data available are not fit for the purpose 11

145 ANNEX Göta River- and Nordre river estuary. (25) Göta River - and Nordre River is a transitional coastal water type. It is very shallow (6 m) and strongly effected by river fresh water run off. Category Assessment Parameters Description of Results Score (+ -?) Aggregated confidence rating Degree of Nutrient Enrichment (I) Riverine inputs and direct discharges of total N and total P (-) Decreasing trends in TN and TP Winter DIN concentrations Winter DIP concentrations (+) in (-) in Winter N/P ratio (Redfield N/P = 16) (?)? Direct Effects (II) 90 th percentile, maximum and mean chlorophyll a concentration Area-specific phytoplankton indicator species (+) in (?)? Macrophytes including macroalgae (?)? Indirect Effects (III) Oxygen deficiency (-) Changes/kills in zoobenthos and fish kills (?)? Organic carbon/organic matter (?)? Other Possible Effects (IV) Algal toxins (DSP/PSP mussel infection events) (?)? Key to the Score + = Increased trends, elevated levels, shifts or changes in the respective assessment parameters - = Neither increased trends nor elevated levels nor shifts nor changes in the respective assessment parameters? = Not enough data to perform an assessment or the data available are not fit for the purpose 12