Stormwater Review Part 2. Rainfall and Runoff. Tom Seybert, PE and Andy Bennett, PE. Pennsylvania Surveyors Conference 2019
|
|
|
- Shavonne Holt
- 5 years ago
- Views:
Transcription

1 Stormwater Review Part 2 Rainfall and Runoff Tom Seybert, PE and Andy Bennett, PE Pennsylvania Surveyors Conference
2 Topics Covered 1. Rainfall characteristics and sources 2. Watershed characteristics 3. Runoff estimation using the NRCS CN method 4. Extreme event runoff calculation 5. Small event runoff calculation 2
3 Workshop Part 2 Outcomes 1. Select a design rainfall based upon storm duration and frequency, 2. Delineate a watershed area and flow path, 3. Categorize soils, land use and land cover for a drainage area, 4. Compute runoff volumes for rainfall events using the NRCS CN method. 3
4 I. Rainfall and Data Sources A. Volume B. Intensity C. Frequency D. Geographic/spatial variation E. Data TP-40 (TR-55) Atlas 14 PennDOT Pub
5 A. Volume Total amount of rainfall falling during an event Expressed as inches Really a volume: rainfall depth x watershed area More correctly expressed as acre-inches B. Intensity Rate of rainfall falling during an event Expressed as inches/hour (depth/time) Really a flow: intensity (ft/s) x watershed area (ft 2 ) More correctly expressed as ft 3 /s 5
6 Volume vs. Intensity Largest intensity: 0.57 inches/hour Total storm volume: Sum all intensities times the time step gives 5.41 inches 6
7 C. Frequency How often does this rainfall depth/intensity occur? Return period (years) Based upon probability of occurrence (statistics) Requires long-term rainfall records D. Spatial/Geographic Variation Rainfall intensity and volume varies with location Local variation: Watersheds > 1 mi 2 Regional/state: PA, MD, VA, etc. IDF curves National variation: NRCS Type I, IA, II, III National variation: NOAA Type A, B, C, D 7
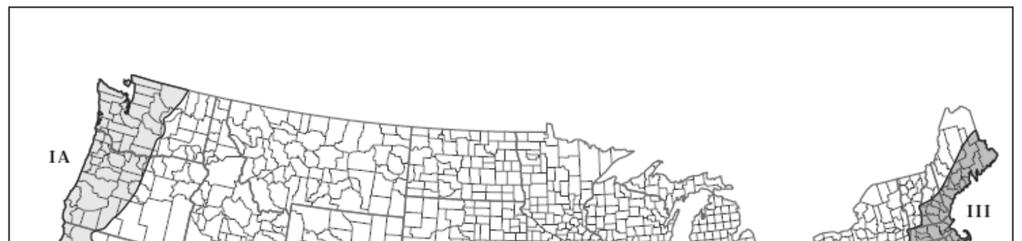


8 National variation: NRCS Type I, IA, II, III 8
9 National variation: NRCS Type I, IA, II, III 9


10 E. Data Sources TP-40 (don t use) 10


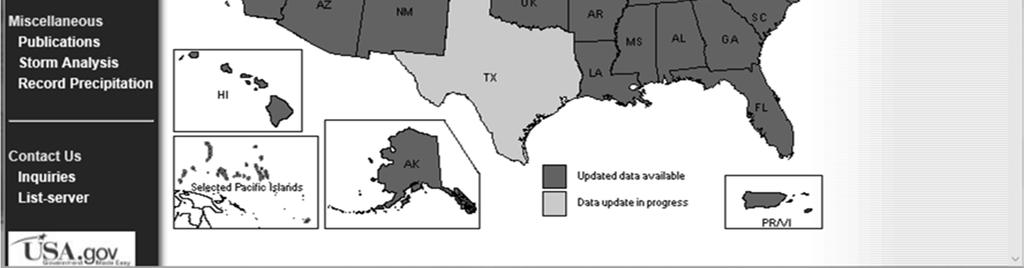
11 E. Data Sources ATLAS


12 ATLAS 14 Data 12


13 ATLAS 14 Data State College, PA

14 E. Data Sources PennDOT Pub. 584 Pennsylvania Variation of Atlas 14 Step 1: Select appropriate Region Map from Table 7A.1 14
15 Step 2: From regions map, select appropriate region (1-5) 15

16 Step 3: From regions rainfall curves, read rainfall intensities using return period and storm duration OR.. 16
17 Step 3: From region rainfall tables, read rainfall depths using return period and storm duration 17

18 Example 1: Estimate 1-yr, 10-yr and 100-yr 24-hr rainfall depths for State College, PA Use Map F for all three return periods 18
19 Example 1: Estimate 1-yr, 10-yr and 100-yr rainfall depths for State College, PA Use Region 2 Rainfall Data 19
20 Region 2 VDF (volume) Table
21 Example 1: Estimate 1-yr, 10-yr and 100-yr rainfall depths for State College, PA Summary Results Storm duration: 24 hours Return Period Pub Atlas 14 1-yr yr yr
22 II. Watershed Characteristics A. Drainage area B. Flow paths C. Surface slope D. Soils E. Land use/cover A. Drainage Area Delineation 1. Manual by hand on paper maps 2. GIS (automated) 3. AutoCAD poly-line (really manual on digital drawing) 22
23 A. Drainage Delineation Determined by outlet/point of interest (POI) Trace ridge-line starting at POI Trace perpendicular to contour lines Constantly check direction of surface slope to left and right of traced boundary Consider man-made changes to topography Trace returns to POI 23


24 Simms Pond Watershed, Lehman, PA Point of interest (highway-stream crossing) 24
25 Exercise 1: Drainage Area Delineation of Echo Valley Watershed Point of interest (stream crossing) 25
26 Exercise 1: Delineation Solution Echo Valley Watershed Potential disparity: field check! 26
27 b. Flow Paths Begin at point of interest Trace line perpendicular to contours Create path of maximum slope, i.e., shortest distance between contours Continue to point of ending 27
 Point of interest")
28 Exercise 2: Watershed Length (flow path) Point of interest 28


29 Exercise 2: Watershed Length Echo Valley Watershed Path Length Use paper-edge method Path = 4.75 inches Scale: 1 in = 1000 ft L = 4750 ft Point of interest 29
30 c. Surface Slope ΔElev = change in elevation from beginning to end of flow path L = length of flow path 30

31 Elev at WS headwater = 1305 ft Path Slope ΔE = = 311 ft L = 4750 ft S = 311 ft / 4750 ft S = ft/ft Elev at outlet = 994 ft 31
32 D. Soils Affect ability of watershed to store water Affect infiltration process Highly variable in depth, porosity, etc Water table effects can cause variability Use NRCS (SCS) hydrologic soil group 32
33 NRCS Hydrologic Soil Groups 33
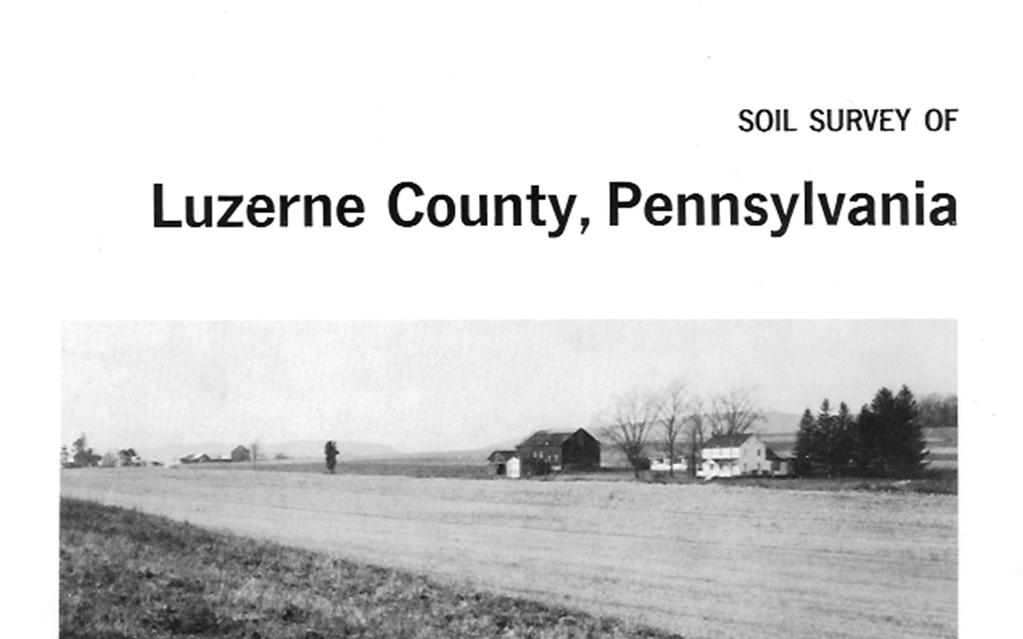

34 NRCS Soil Classification County Soil Surveys 34


35 Soil Names Aerial photo gives soil designation Designation gives soil name 35


36 Hydrologic Soil Group Appendix A TR-55 Soil name gives HSG 36


37 37


38 Web Soil Survey AOI (State College, PA Pine Patch) 38

39 Web Soil Survey AOI Report for Pine Patch 39
40 E. Land use/cover Affect ability of watershed to infiltrate water Vegetation type and condition important Impervious area most important Use aerial photographs, digital imagery, USGS quadrangle maps, and field survey Google maps 40

41 Pine Patch Area from Google Maps Point of interest 41
42 Pine Patch Site Topography 42
43 Land use/cover from Google Maps Pre-development Land Use Pine Trees (full canopy): 8.0 ac Meadow (good condition): 56.0 ac Total: 64.0 ac Meadow Pine Trees Point of interest 43
44 Pine Patch Soil Cover Complex Pre-dev. Soil Cover Complex B Pine Trees (B soils): 1.7 ac Pine Trees (C soils): 1.4 ac Meadow Pine Trees (D soils): 3.9 ac Meadow (B soils): 44.3 ac D Meadow (C soils): 3.0 ac Meadow (D soils): 9.7 ac C D D Total: 64.0 ac Pine Trees B Point of interest B D 44
45 III. Runoff by the NRCS CN Method Runoff occurs after initial losses are satisfied Runoff depths (volumes) needed for detention design Runoff peaks needed for conveyance (pipe and channel) sizing Runoff Curve Number Method Developed by the NRCS (SCS) in 1950 s Gives runoff depth in inches (over the watershed) Three equations in the method 45
46 A. Three NRCS Runoff Equations where: Q = direct runoff (inches) P = precipitation (inches) I a = initial abstraction (inches) S = potential maximum retention after runoff begins (inches) CN = curve number Numerator parenthetical must be positive in first equation! If negative, Q = 0. 46
47 B. Simplified NRCS Runoff Equation Q as a function of P and CN only No need to compute S or I a Numerator parenthetical must be positive!! 47


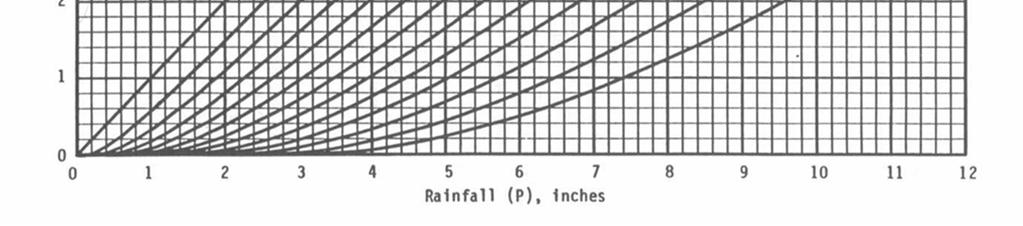
48 Graph of NRCS Runoff Equation 48
49 C. Curve Numbers (CN) 1. Dimensionless number between 0 and Practical range 40 to 98 CN = 40: S = 15 inches (low Q potential) CN = 98: S = 0.2 inches (high Q potential) 3. Defined by soil cover complex land use hydrologic condition hydrologic soil group (HSG) 49
")
50 CN values tables (TR-55 tables 2-2a through 2-2d) 50
51 CN values tables (TR-55 tables 2-2a through 2-2d) 51
52 CN values tables (TR-55 tables 2-2a through 2-2d) 52
53 CN values tables (TR-55 tables 2-2a through 2-2d) 53
54 D. Weighting of CN values Non-homogeneous areas Accuracy drops with wide variation in CN Variation of 15 points (recommended max) Errors largest with small storms 54
55 Example 2: CN Weighting Given: 64 acre watershed with land uses, HSGs and areas Land Use Soils Area Pine Trees B 1.7 ac Pine Trees C 1.4 ac Pine Trees D 3.9 ac Meadow B 44.3 ac Meadow C 3.0 ac Meadow D 9.7 ac Total: 64.0 ac Find: (a) Area based weighted curve number (b) Runoff from a 6.03 inch rainfall 55
56 Example 2: CN Weighting Land Use Condition HSG Area (ac) CN CN x A Pine trees Good B Pine trees Good C Pine trees Good D Meadow Good B Meadow Good C Meadow Good D Total Σ (a) Area based weighted curve number 56
57 Example 2: CN Weighting (b) Runoff from a 6.03 inch rainfall 57
58 E. Weighting of Q values Non-homogeneous areas Accuracy not affected by wide variation in CN Recommended for runoff from small storms 58
59 Example 3: Example 2 data for Q Weighting (P = 6.03 ) Given: 64 acre watershed with land uses, areas and HSGs of Example 1. Find: Area based weighted runoff from a 6.03 inch rainfall Solution: Land Use Condition HSG Area (ac) CN Q (in) Q x A (ac-in) Pine trees Good B Pine trees Good C Pine trees Good D Meadow Good B Meadow Good C Meadow Good D Total Σ
60 Example 3: Example 2 data for Q Weighting (P = 6.03 ) Land Use Condition HSG Area (ac) CN Q (in) Q x A (ac-in) Pine trees Good B Pine trees Good C Pine trees Good D Meadow Good B Meadow Good C Meadow Good D Total Σ
61 Runoff Comparison of CN average vs. Q average methods for Pine Patch Pre-development P (in) Q (CN avg ) Q (Q avg ) Q(diff) % diff


 Pine")
: 1.")

: 3.")
: 2.")


:")

: 7.")
62 Pine Patch Soil Cover Complex Point of interest ½ ac Residential D B C Pond C C D Pine Trees B B Park D D B D Post-dev. Soil Cover Complex Subarea 1 (green polygons) Pine Trees (B soils): 1.7 ac Pine Trees (C soils): 1.4 ac Pine Trees (D soils): 3.9 ac Park (B soils): 2.1 ac Park (D soils): 2.2 ac Pond (C soils): 1.6 ac Subarea 2 (gray-red polygons) ½ ac. Res. (B soils): 42.2 ac ½ ac. Res. (C soils): 1.4 ac ½ ac. Res. (D soils): 7.5 ac Total: 64.0 ac 62
63 Exercise 3: Compute the runoff using CN averaging for Pine Patch Post-development - Subarea 1 (P = 6.03 ) Land Use Condition HSG Area (ac) CN CN x A Pine trees Good B 1.7 Pine trees Good C 1.4 Pine trees Good D 3.9 Park Good B 2.1 Park Good D 2.2 Pond Good C 1.6 Σ
64 Exercise 3: Runoff using CN average for Pine Patch Postdevelopment - Subarea 1 (P = 6.03 ) Land Use Condition HSG Area (ac) CN CN x A Pine trees Good B Pine trees Good C Pine trees Good D Park Good B Park Good D Pond Good C Σ
65 Exercise 3: Runoff using CN average for Pine Patch Postdevelopment - Subarea 1 (P = 6.03 ) 65
66 Exercise 4: Compute the runoff using CN averaging for Pine Patch Post-development - Subarea 2 (P = 6.03 ) Land Use Condition HSG Area (ac) CN CN x A ½ ac. Residential Good B 42.2 ½ ac. Residential Good C 1.4 ½ ac. Residential Good D 7.5 Σ
67 Exercise 4: Runoff using CN average for Pine Patch Postdevelopment - Subarea 2 (P = 6.03 ) Land Use Condition HSG Area (ac) CN CN x A ½ ac. Residential Good B ½ ac. Residential Good C ½ ac. Residential Good D Σ
68 Example 5: Runoff using CN weighted for Pine Patch Post-development Subarea 1 + Subarea 2 (P = 6.03 ) Summary: 68
69 Workshop Part 2 Summary Topics 1. Rainfall characteristics and sources 2. Watershed characteristics 3. Runoff estimation using the NRCS CN method 4. Extreme event runoff calculation 5. Small event runoff calculation Outcomes 1. Select a design rainfall based upon storm duration and frequency, 2. Delineate a watershed area and flow path, 3. Categorize soils, land use and land cover for a drainage area, 4. Compute runoff volumes for rainfall events using the NRCS CN method. 69