Ecosystem Accounting in South Africa: Initial Work
|
|
|
- Gwen Ray
- 5 years ago
- Views:
Transcription


1 Ecosystem Accounting in South Africa: Initial Work Mandy Driver South African National Biodiversity Institute UNSD EGM on Experimental Ecosystem Accounting 18 November 2013
2 South African National Biodiversity Institute Government agency Falls under Department of Environmental Affairs Bridging role between science and policy Often work in partnership with other organisations
3 Biodiversity species In a mega-diverse country, our focus is often at the ecosystem level Components of biodiversity ecosystem diversity species diversity genetic diversity
4 Overview Starting point National Biodiversity Assessment Approach to ecosystem classification Measuring and mapping ecological condition Focus on rivers River ecosystem accounts Why start with rivers Next steps


5 Two national assessments of biodiversity in SA Strong focus on ecosystems Every 5 to 7 years Part of SANBI s mandate to monitor and report on the state of biodiversity National Spatial Biodiversity Assessment st asmt of ecosystems across terrestrial, river, estuarine & marine environments NBA 2011: Added wetlands & invasives, more focus on indigenous species & climate change 35


6 NBA 2011: More than 200 scientists & practitioners from over 30 organisations contributed, 3 year process and many more

7 National ecosystem indicators How threatened are our ecosystems? How well protected are our ecosystems? Critically endangered Endangered Vulnerable Least threatened Not protected Poorly protected Moderately protected W ell protected Critically endangered Endangered Vulnerable Least threatened Not protected Poorly protected Moderately protected Well protected
8 Ecosystem threat status Terrestrial Rivers Wetlands Estuaries Coastal & inshore Offshore CR EN VU LT Powerful indicators that can be simply displayed 0% 20% 40% 60% 80% 100% % of ecosystem types Terrestrial Ecosystem protection level Rivers Wetlands Estuaries Coastal & inshore Offshore Not protected Poorly protected Moderately protected Well protected 0% 20% 40% 60% 80% 100% % of ecosystem types
9 National ecosystem indicators Direct links to various policy & legislative tools BUT don t lend themselves to national accounting However, the underlying concepts do, especially: Ecosystem types Ecological condition
10 Ecosystem types mapping and classifying ecosystems Grouping habitats or natural features into categories with similar characteristics, properties, or functions A way of simplifying the complexity of biodiversity Provides a nationally consistent basis for concepts and terminology to be communicated Provides a coarse-filter surrogate for biodiversity pattern (species) Groups ecologically similar ecosystems so that rules can be set up for ecological models
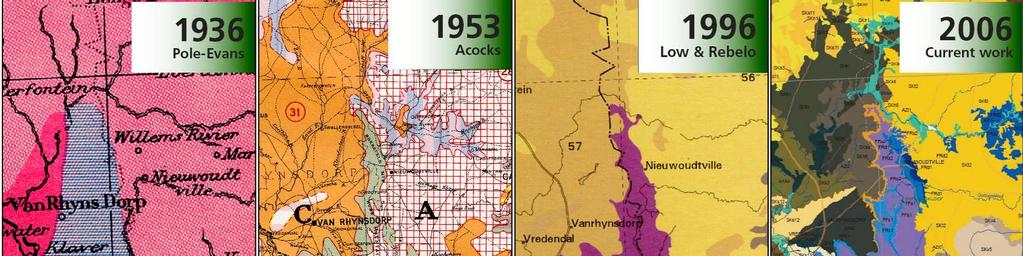
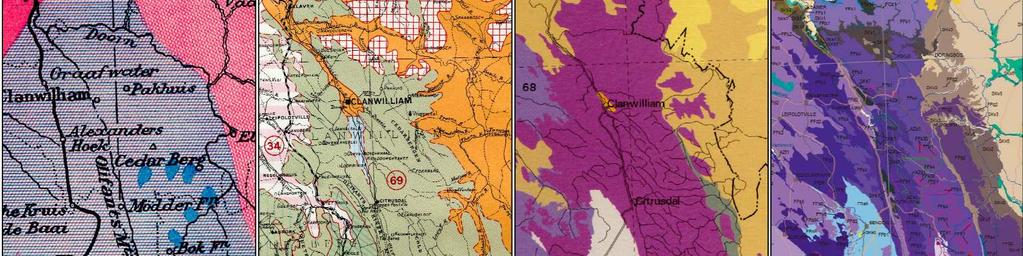
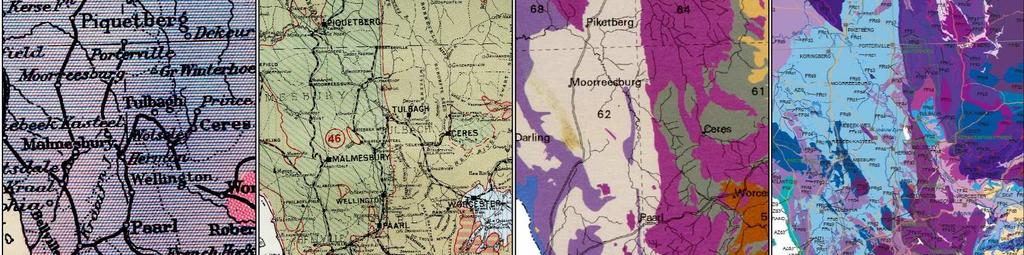
11 National Ecosystem Classification System (NECS) Long history in terrestrial environment vegetation mapping, going back to 1930s More recent progress in aquatic environments, especially in last 10 years

12 Vegetation map of South Africa 2006 ~440 vegetation types
13

14 Marine ecosystem types From 34 biozones in NSBA 2004


15 2011: 136 coastal, inshore & offshore habitat types 58 coastal & inshore habitat types 62 offshore benthic (seabed) habitat types 16 offshore pelagic habitat types (water column)


16 223 river ecosystem types 31 Level 1 ecoregions 2 flow regime categories 4 longitudinal zones


17 Approx wetlands (difficult to map at national scale!) 792 wetland ecosystem types 7 hydro-geomorphic classes (landscape setting) 133 wetland veg groups
18 NB: Mapping and classification of ecosystem types is based on pre-colonial /pre-industrial extent of ecosystems doesn t depend on current land cover / land use / resource use Uses various biophysical data layers, ideally combined with ground-truthing of ecosystem types e.g. geology, soil types, rainfall, temperature, altitude, flow variability, longitudinal zones, hydrogeomorphology, biogeography, substrate, depth, wave exposure
19 National ecosystem classification system terrestrial freshwater estuarine marine & coastal Vegetation types River ecosystem types Estuary ecosystem types Coastal & inshore habitat types Wetland ecosystem types Offshore benthic habitat types SANBI leading the process of formalising this national system Offshore pelagic habitat types
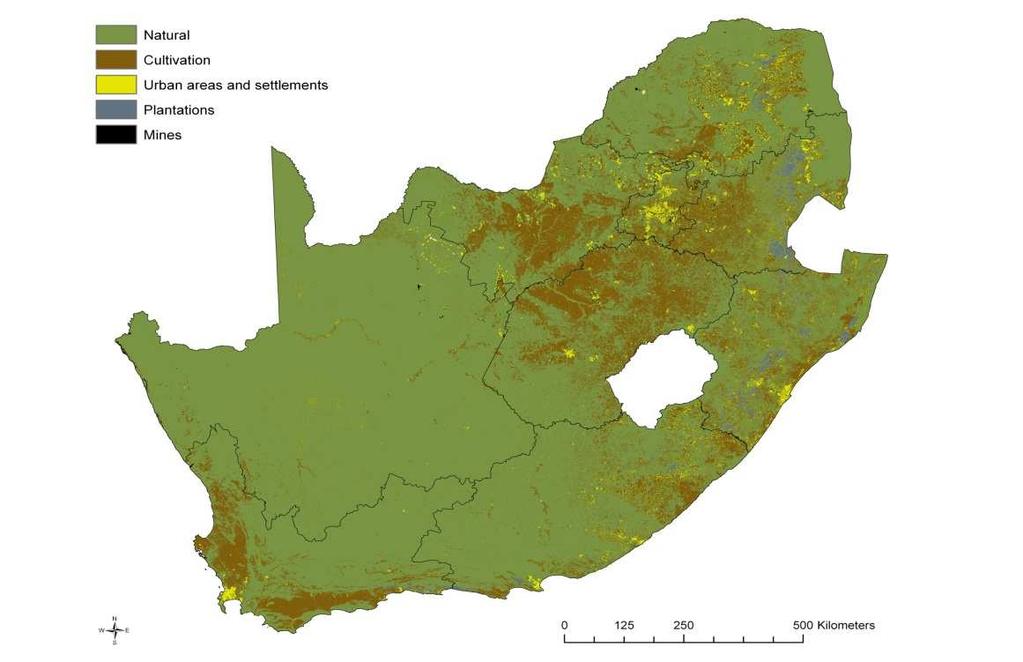
20 Ecological condition At the simplest level: good/fair/poor Good natural/near-natural Fair moderately modified Poor severely or irreversibly modified Can be applied across terrestrial and aquatic environments This is where land cover comes in Can combine data and expert input
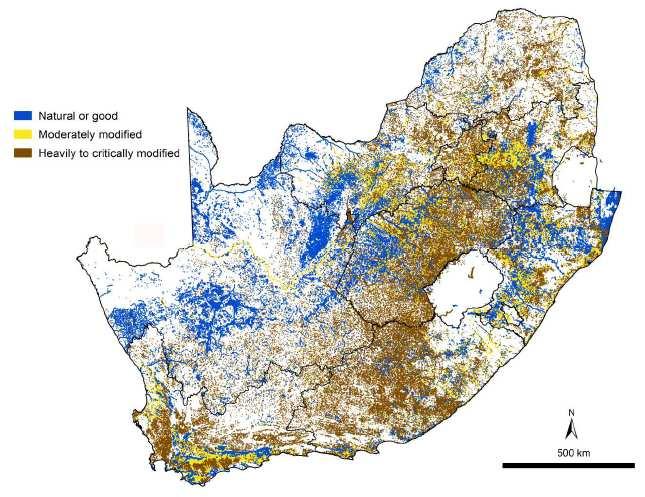
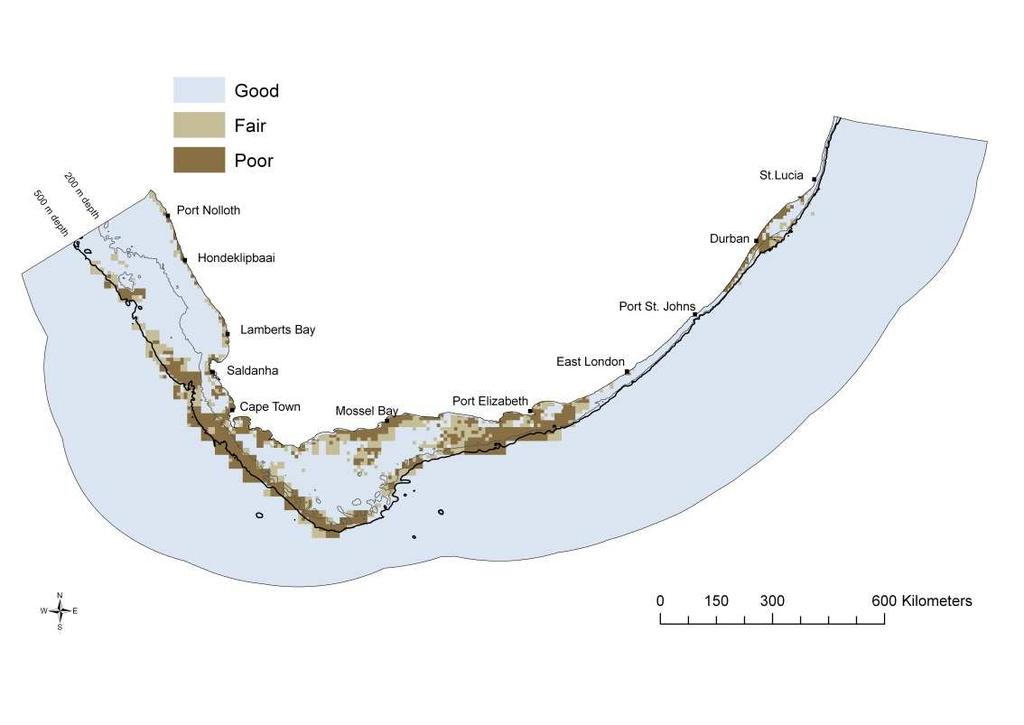
21 Maps of ecological condition Terrestrial Rivers Wetlands Marine & coastal
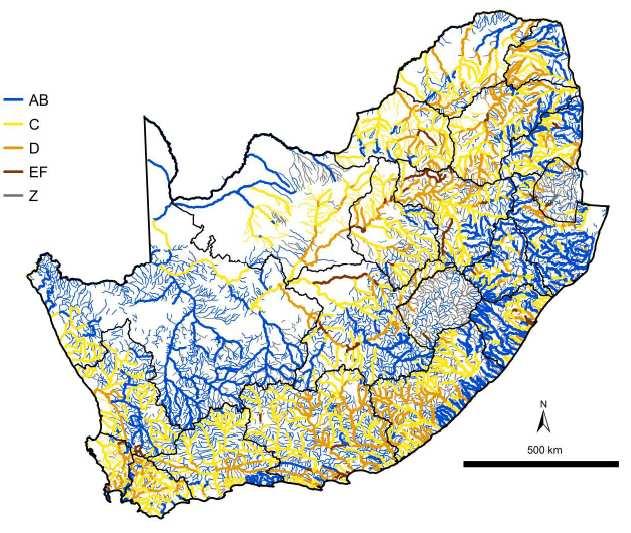
22 More detail for rivers: Dept of Water Affairs system of ecological condition categories Ecol condition A B C D E F Description Unmodified, natural Largely natural, with few modifications. A small change in natural habitats & biota may have taken place but the ecosystems functions are essentially unchanged Moderately modified. A loss and change of natural habitat & biota have occurred but the basic ecosystem functions are still predominantly unchanged Largely modified. A large loss of natural habitat, biota & basic ecosystems functions has occurred Seriously modified. The loss of natural habitat, biota & basic ecosystems functions is extensive Extremely modified. Modifications have reached a critical level & the system has been modified completely with an almost complete loss of natural habitat & biota. Worst instances: the basic ecosystem functions have been destroyed & the changes are irreversible
23 Based on 6 attributes / drivers of condition Attributes: Flow (e.g. quantity, timing, velocity) Inundation (dams, weirs, other obstructions in the channel) Water quality Stream bed condition Introduced instream biota Riparian or stream bank condition For each attribute: Extent of modification from natural is assessed Based on data and expert input, with a confidence rating

24 Spatial scale: sub-quaternary catchments Quaternaries Average size ~650 km 2 Sub-quaternaries 8547 Average size ~170 km 2 Results can be aggregated to a range of scales/units e.g. municipalities, provinces, water management areas
25 OR river reaches (within sub-quaternary catchments) Can be as long as the Orange River reaches..process River network topology Sub-quaternaries
26 National river ecosystem accounts Freshwater ecosystems are the most threatened ecosystems in SA water scarce country River ecosystem assets support a range of provisioning, regulating and cultural services Dept of Water Affairs has just completed a national revision of ecological condition data for rivers Hope to be able to draw links with national water accounts, as well as recent census data on e.g. access to water Physical accounts rather than monetary
27 Application of key EEA concepts Basic spatial unit: sub-quaternary catchments Ecosystem unit: river ecosystem types Ecosystem accounting unit: municipalities, water management areas, or any other set of administrative units
28 Next steps StatsSA & CSIR currently working with data from Department of Water Affairs Work session early 2014 to explore initial results Discussion document during 2014