Today s Energy Landscape:
|
|
|
- Bryan Tyler
- 5 years ago
- Views:
Transcription
1 Today s Energy Landscape: Exploring economic, environmental and technological trends October 11, 2010 Presentation to the PJM Board Sue Tierney Managing Principal BOSTON CHICAGO DALLAS DENVER LOS ANGELES MENLO PARK MONTREAL NEW YORK SAN FRANCISCO WASHINGTON
2 Disclaimer for today s remarks: I am here speaking for myself and no other party or interest. Analysis Group has clients who are PJM market participants. I am a member of the board of directors of EnerNOC. I am representing none of those parties here; no one is paying for my participation today. Out of an abundance of caution relating to potential appearance of conflicts, I will not directly raise issues relating to demand response activities. Page 2
3 Today s Energy Landscape An overview The big features of the terrain hazy overcast Michael Hajjar - high altitude Page 3
4 A dozen points on the landscape with implications for electricity markets The overall setting Washington, the states Natural gas EPA regulations Green technologies Prices part 1 Transmission Other infrastructure Prices part 2 Markets Climate issues Big gorillas Page 4


5 #1 The overall setting Energy is back on the back pages behind the economy, tea parties, most everything else: A temporary reprieve or a change in luck..? Page 5
6 The economic recovery: timing, i pace, implications Page 6

7 Buckle up era of continued high uncertainty DOE EERE Wind Power Budget ( 75 10) (75 Average Natural Gas Spot Price Henry Hub ($/MMBtu) Era of big investment In generation. e Roller coaster: Gas prices, climate Legislation, ARRA Era of uncertainty Regarding electric Industry restructuring ; ; Page 7


8 #2 Public Policy. The States leading Washington: Back to the future? Page 8
9 Prospects for action on energy, climate: Climate? Transmission? Renewable portfolio standard? What a difference 24 Efficient i energy months standard? R&D? Oil and gas legislation? makes.. Page 9


10 Issues on states agenda: Green jobs Rate cases Smart grid Energy efficiency Concerns about prices Page 10
11 /KWh Average Retail Electricity Price All Customers by State Relatively low percentage coal-fired generation Relatively high percentage coal-fired generation Data: Energy Information Administration, 826 database Page 11
12 (kwh/person) Electricity Use Per Person (KWh) by State and US: WY KY DC AL WV ND SC LA TN IN AR MS MT NE ID OK IA NC MO VA KS GA TX OH NV DE SD WA MN OR WI FL US PA AZ MD IL NM MI CO UT CT NJ VT AK ME MA NH HI NY RI CA Data: Energy Information Administration, State Energy Data System (most recent annual data available as of ) Page 12 Susan Tierney, Analysis Group, stierney@analysisgroup.com,
13 Btu (1000s) per GDP Dollars 25 Total Energy Consumed Per Dollar of Real GDP LA AK ND WV MS MT KY AL OK AR IN SC TX KS NM ID ME IA TN NE OH MO SD GA WI UT MI PA US MN NC VA WA IL OR VT FL CO NV AZ NJ HI MD NH DE RI CA MA CT NY DC Data: Energy Information Administration, State Energy Data System (most recent annual data available as Page 13 Susan Tierney, Analysis Group, stierney@analysisgroup.com,


14 #3 Natural gas: a sure-bet game changer, or something else? Page 14


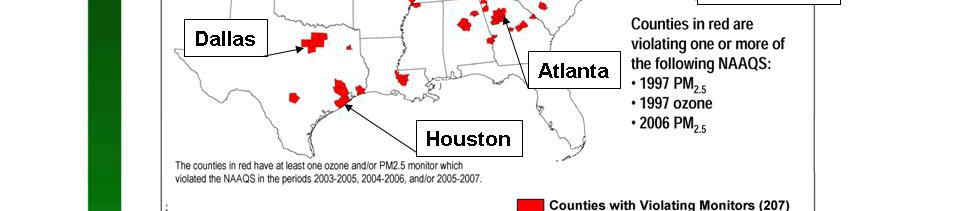
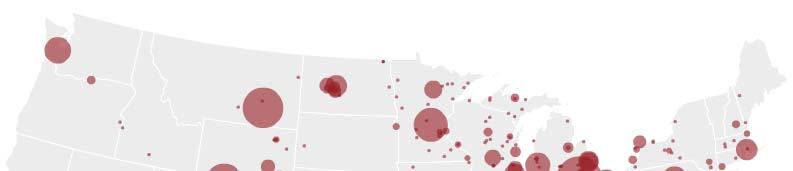

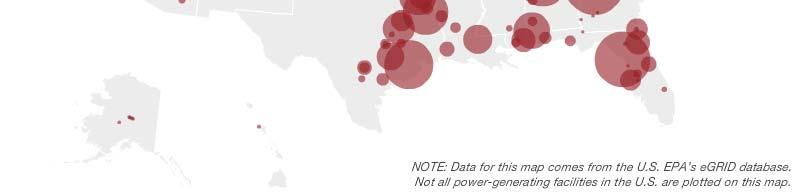
15 #4 EPA s upcoming regulations: The next big event? Page 15
16 Page 16
17 Coal capacity by emission control Page 17
")


18 Small coal plant (by vintage and controls) (<300 MW) Credit Suisse, A Thought: CATF is First Step in Changing the Coal Fleet, July 7, 2010 Page 18
19 Complying with EPA regulations: Two issues: Retirements Retrofits Many tools Federal State Industry actors Delay in not helpful Implications for: -Markets - reliability - economic activity - public health - energy transformation Page 19
20 Providing Relief in Extreme Cases: Statutory, Regulatory, and Market Safeguards Agency Regional Wholesale Electricity Markets (e.g: PJM, ISO-NE, etc.) Source of Authority / Instrument of Implementation Enforcement of Market Rules, Reliability- Must-Run (RMR) agreements, Forward Capacity Markets, etc. Measure Examples RMR agreements allow units to operate only to ensure reliability while minimizing adverse environmental impacts. Forward capacity markets provide a mechanism to signal the need for new capacity additions Rapid-response planning initiatives to address any apparent reliability issues. State Public Utility Commissions Regulatory oversight of utilities Adopt ratemaking policies that encourage system reliability and environmental goals including ones that address utilities financial disincentives es where EE and DR programs lower utility revenues. Supervision to assure prudent response to environmental requirements looking at various options (retirements, equipment additions, off-system purchases, reserve sharing, etc.) U.S. Department of Energy Section 202(c) of the Federal Power Act Override CAA-derived control requirements in limited emergency circumstances U.S. Environmental Protection Agency Cap-and-trade based regulations Section 112(i)(3)(B) of the CAA Emissions trading mechanisms enable greater compliance flexibility to manage potential reliability concerns Extend deadlines for utility MACT rule where necessary to maintain electric system reliability U.S. President Section 112(i)(4) of the CAA MJ Bradley, S Tierney, P Hibbard, C Van Atten, August 2010 Extend deadlines for utility MACT rule where necessary to maintain electric system reliability Page 20


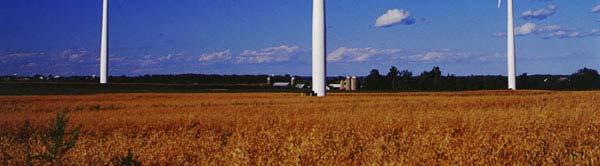
21 #5 Green technologies, clean fuels, smart grids: Will we put our money where our mouth is? Page 21


22 #6 Prices (part 1) Electricity prices: What s the new normal? - low commodity costs? - higher delivery costs? - net effects? ricity+prices+history.jpg Page 22


23 #7 Transmission. What about transmission: What, when, where, why, how? Page 23


24 What we want from transmission Goals relating directly to the electric system Electricity is a service Goals relating to national interests (e.g., domestic energy resource development, advanced anced technology development and deployment) Electricity has strategic attributes Goals relating to other external systems (e.g., local economic development) Page 24


25 #8 Other Infrastructure, old and new? Page 25


26 #9 Prices Part 2 Rate design NERC, Long-Term Reliability Assessment, 2009, Figure 7 Page 26


27 #10 Competitive markets: What do they look like this decade? d Page 27
28 #11 Climate issues: For the moment, focus on adaptation issues Assessing adaptation to climate change with implications for energy Climate Change in the Northeast, A Report of the Northeast Climate Impacts Assessment, October Page 28
29 Natural Systems and The Energy Systems illustrative ti Fuel inputs energy transformation delivery use Water supply Fossil Fuel Extraction Retail Fuel Drought Fuel Transport Fuel Transport Vehicles Refining, Air quality Processing Thermal Power- Temperature Production Power Renewable (air, water) Transmission Fuels Industries Production Non- Solar radiation Thermal Solar Power Appliances Power Biomass Distribution Wind Production Wind Buildings Hydro Erratic, intense storms Page 29
30 Electric Transmission System Damage Page 30
31 Thermal and non-thermal power production water for supply, cooling Page 31 U.S. Climate Change Science Program, Effect of Climate Change on Energy Production and Use in the United States: Synthesis and Assessment Product 4.5, Public Comment Draft, November 30, 2006 ( USCCSP Energy ).
32 Energy Systems: Limited Understanding of Potential Vulnerabilities Droughts Snow pack Frequency & intensity of storms Invasive species Heating and cooling degree days Sea level rise # of days in summer heat waves Wind resources Solar radiation E.g., regional implications for: Energy facilities in coastal areas Hydroelectric supplies Transmission capacity Biomass production (e.g., forests, switchgrass Air conditioning demand and technology Peakiness of power production Loss of power production capacity Availability and location of wind, solar resources The geography of energy production & use matters Reliability of regionally concentrated facilities (e.g., Gulf oil & gas) Cost-effectiveness of technology options Page 32
33 #12 Big Gorilla. Page 33


34 Implications for energy subsidies, programmatic support, R&D funding.. Implications for new sources of federal funds Page 34
35 Susan Tierney Analysis Group 111 Huntington Avenue, 10 th Floor Boston, MA Page 35