Physics, Chemistry, and Biology in Ponds and Lakes
|
|
|
- Josephine Leslie Owens
- 5 years ago
- Views:
Transcription
1 11//1 Physics, Chemistry, and Biology in Ponds and Lakes Ponds and Lakes Dominated by Heterotrophic Processes Example. A well mixed lake with V = x1 8 L is fed by a stream flowing at Q=.x1 7 L/d that contains 8mg/L DO and has L =1mg/L. Waste from a small municipality (L =9mg/L, DO = mg/l) enters the lake at.8 x 1 L/d. k d, k r, and DO* in the lake are.1 d 1,. d 1, and 11. mg/l, respectively. Assuming that the lake is at steady state: a) Determine L and DO in the lake. b) Compute the rates (kg/d) at which advection, reaeration, and biological reaction, each acting alone, increase or decrease DO and L in the lake. Q 1 (stream), L 1, DO 1 Q (waste), L, DO V, k d L in lake Q 3, L 3, DO 3 DO in lake, k r Q 1 =. x 1 7 L/d Q 3 = Q 1 + Q =.88 x 1 7 L/d DO 1 = 8 mg/l DO 3 =? L 1 = 1 mg/l L 3 =? Q =.8 x 1 L/d DO = mg/l L = 9 mg/l k r =. d 1 k d =.1 d 1 DO* = 11. mg/l Q 1 (stream), L 1, DO 1 Q (waste), L, DO V, k d L in lake Q 3, L 3, DO 3 DO in lake, k r MB on L: = QL 1 1+ QL QL 3 3 kvl d in lake L mg L mg = + d L d L 7.x1 1.8x1 9 L.88 1 (.1 d )( 1 L) d L x x L L 3 = L in lake = 8.83 mg/l
, L, DO V, k d L in lake Q 3, L 3, DO 3 DO in")
 V Q Q Q k L V k V in lake 1 1 3 3 d in lake")

 8.83 ( x1 L) (. d ) 11.")

 (1 kg/mg) = kg/d Rate")

 (8.83 mg/l) ( x 1 8 L) =.")
 Lake Bioactivity Outlet (b) 19")
2 11//1 MB on DO: d dt Q 1 (stream), L 1, DO 1 Q (waste), L, DO V, k d L in lake Q 3, L 3, DO 3 DO in lake, k r ( DO ) = ( DO ) + ( DO ) ( DO ) ( ) + ( DO* DO ) V Q Q Q k L V k V in lake d in lake r in lake ( ) ( ) ( ) ( ) ( ) = Q DO + Q DO Q DO k L V + k DO* DO V d 3 r 3 L mg L mg L = + d L d L d mg mg + L L ( ) 7 7.x1 8.8x1.88x1 DO (.1 d ) 8.83 ( x1 L) (. d ) 11. DO3 ( x1 L) Q 1 (stream), L 1, DO 1 Q (waste), L, DO V, k d L in lake Q 3, L 3, DO 3 DO in lake, k r Advective outflow of biochemical oxygen demand: (.88 x 1 7 L/d)(8.83 mg/l) (1 kg/mg) = kg/d Rate of L utilization (i.e., the rate of DO utilization by biochemical reactions): r L V = k d (L in lake ) V = (.1 d 1 ) (8.83 mg/l) ( x 1 8 L) =. x 1 8 mg/d = kg/d DO 3 = DO in lake =.7 mg/l Stream (a) Lake Bioactivity Outlet (b) 19 Stream Reaeration Lake Bioactivity 1 Outlet Waste Waste Mass Balance Terms for L (kg/d) Mass Balance Terms for DO (kg/d)

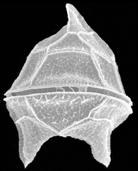
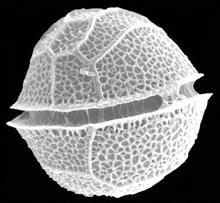
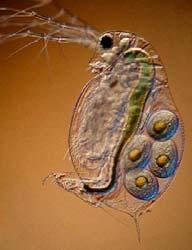
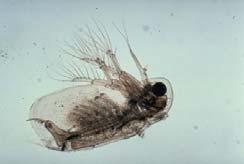
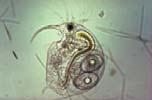
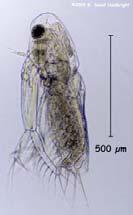
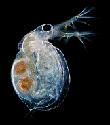
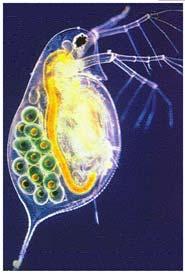
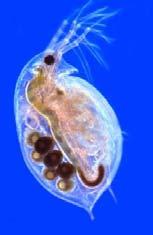
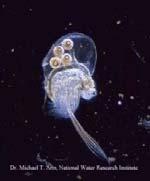
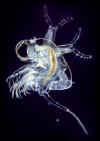
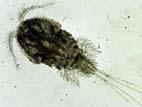
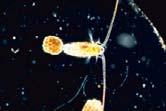
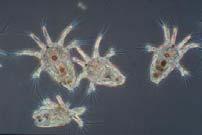
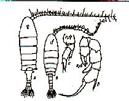
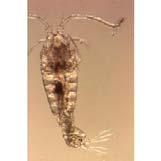
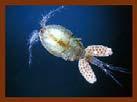
3 11//1 Copepods Cyclopoid Cladocerans Calanoid nauplii 3
![11//1 Limiting Nutrients for Algal Growth and Lake Productivity: Nitrogen, Phosphorus & Carbon Nutrient Source Cycling Nitrogen [Atmosphere], Biological Geologic Phosphorus Geologic Physical,](/docs-images/93/113463856/images/4-0.jpg "Chemical Carbon Atmosphere Chemical, Biological Redfield Ratio C: N : P P limited N limited 1 : 1: 1 N:P > N:P < 1 Carbon: rarely limiting due to ready availability from the atmosphere Nitrogen: can")
4 11//1 Limiting Nutrients for Algal Growth and Lake Productivity: Nitrogen, Phosphorus & Carbon Nutrient Source Cycling Nitrogen [Atmosphere], Biological Geologic Phosphorus Geologic Physical, Chemical Carbon Atmosphere Chemical, Biological Redfield Ratio C: N : P P limited N limited 1 : 1: 1 N:P > N:P < 1 Carbon: rarely limiting due to ready availability from the atmosphere Nitrogen: can be limiting especially at very high phosphorus loading rates Phosphorus: most common limiting nutrient and best predictor of algal biomass Colimitation: very common for both nitrogen and phosphorus in combination to be limiting in short term (3- day) bioassays Chlorophyll(µg L -1 ) Phosphorus vs. Phytoplankton Biomass y =.8x 1. r = Total Phosphorus (µg L -1 ) Jones and Bachmann (197)


.999.998 Max. Density @ C.")
5 11//1 Common Threats to Lake and Stream Water Quality CAFOs = Factory Farms Point Sources: sewage and industrial effluent Non-Point Sources: fertilizers, animal wastes, erosion, failing septic systems, Canada geese Point sources have for the most part been controlled A key area for future research in limnology and lake management is the development of methods for quantifying and controlling non-point source nutrients The Impact of Temperature on Water Density 1. Density (grams/cm 3 ) Max. C Temperature (C )

6 11//1 Summer Stratification Epilimnion 1 1 Metalimnion Hypolimnion 1 1 Temperature (C ) Temperate Lakes 1 Deep = usually Dimictic 3 Shallow = often Polymictic Time of Year Temperature ( C)
 Fall Mixing 1 1 1 1")


7 11//1 Thermal Stratification in a Dimictic Lake Summer Stratification Temperature (C ) Fall Mixing Temperature (C ) A Eutrophic Dimictic Lake During the Summer Temperature 1 1 Light 1 1 Winter Inverse Stratification Temperature (C ) Spring Mixing Temperature (C ) 1 1 Dissolved Oxygen 1 1 Nutrients Eutrophication and Nuisance algal blooms 7
8 11//1 Chlorophyll vs. Water Clarity 8 Secchi depth (m) 1 3 Chlorophyll a (µg L 1 ) 8
 Lake Washington Temperature Chlorophyll 13 7 1 11 1 9 3 8 7 1....8 1 Time of Year Vol. Wt. Chlorophyll Conc.")
9 11// Time of Year 8 1 Chlorophyll concentration (µg/l) Vol. Wt. Temperaure ( C) Lake Washington Temperature Chlorophyll Time of Year Vol. Wt. Chlorophyll Conc. (µg/l) Aquatic foodweb top consumers planktivores zooplankton phytoplankton 9
 Mem. Ist.")
10 11//1 Fish Zooplankton Phytoplankton Clear Lake Peruvian Upwelling The phytoplankton-zooplankton interrelationship appears to be particularly dependent on the species composition of the biota; hence, if the phytoplankton is composed primarily of species edible [and of nutritional value] for zooplankton, one may find a relatively low phytoplankton standing crop R.A. Vollenweider (197) Mem. Ist. Ital. Idrobiol. 33: Hypereutrophy and N limitation Anoxic hypolimnion (bottom layer) Denitrification (NO 3 converted to N ) Reduced conditions in sediments (Fe 3+ Fe + ) Supply of NO 3 and PO 3-1


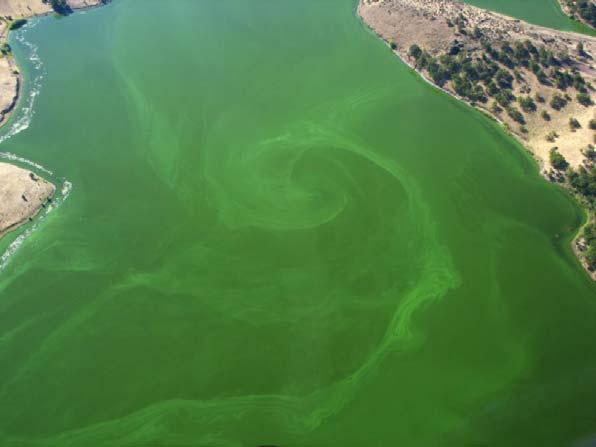
11 11//1 Cyanobacteria Competitive Advantages Can fix atmospheric nitrogen Buoyancy regulation Luxury P uptake (polyphosphate crystals) Poor food quality and edibility to zooplankton Competitive Disadvantages Slow growers relative to other phytoplankton "On May, 1878, George Francis of Adelaide, Australia, published the first scholarly description of the potentially lethal effects produced by cyanobacteria... in a letter to Nature... Symptoms--stupor and unconsciousness, falling and remaining quiet, as if asleep, unless touched, when convulsions come on, with head and neck drawn back by rigid spasm, which subsides before death. Time--sheep, from one to six or eight hours; horses, eight to twenty-four hours; dogs, four to five hours; pigs, three or four hours." 11


 source of vitamin B-1,")


12 11//1 From the website for CellTech, the company harvesting and selling Super Blue Green Algae. 1. Super Blue Green Algae is over % high quality (complete) protein. and is the richest source of chlorophyll known to man. 3. It is a (vegetable) source of vitamin B-1, and in fact contains more B-1 than any other vegetable!. Super Blue Green Algae is 1% vegetarian, 1% natural and 1% wildgrown.. It is enzyme active for super absorption by your body and, it contains over minerals and trace minerals.. Are there any medically proven health benefits? Super Blue Green is a food, not a drug or medicine. Therefore, we cannot promote it as having proven health consequences. Mean depth 3 m Max depth 1 m HRT =. yr -1 Lake Washington Story 1
 1 1 7 Sewage Effluent Watershed Loading 19 197 197 198 198 199 Year Phyto. Bioviol.")
 Lake & Reservoir Management 1: 7-8.")
13 11//1 Case Study: Lake Washington Change in Lake Washington phytoplankton composition and biomass Dissolved P Inputs (metric tons yr. -1 ) Sewage Effluent Watershed Loading Year Phyto. Bioviol. (mm 3 L -1 ) 3 1 Cyanobacteria Other Phytoplankton Year From: W.T. Edmondson (199) Lake & Reservoir Management 1: 7-8. From: W.T. Edmondson (199) Lake & Reservoir Management 1: 7-8. Change in Lake Washington nutrient concentrations, and phytoplankton biomass after waste water diversion 1 Percent of 19 Value 1 7 Inorganic Carbon Nitrate Phosphate Phytoplankton Year From: W.T. Edmondson (1991) The Uses of Ecology. 13
14 11//1 Secchi (m) Daphnia Trophic Equilibrium 1 1 Daphnia L -1 Secchi (m) Daphnia Trophic Equilibrium 1 1 Daphnia L -1 8 Secchi Depth 8 Secchi Depth Year Year Secchi (m) Daphnia Trophic Equilibrium 1 1 Daphnia L -1 8 Secchi Depth Year 1
15 11//1 Biomass (µg Chla/l) 1 8 Lake Washington seasonal phytoplankton succession Diatoms Cryptos Greens Cyanos Others Time of Year 1