COMMERCIAL WASTE MANAGEMENT STUDY VOLUME III CONVERTED MARINE TRANSFER STATIONS - Commercial Waste Processing and Analysis of Potential Impacts
|
|
|
- Diane Dean
- 5 years ago
- Views:
Transcription
1 COMMERCIAL WASTE MANAGEMENT STUDY VOLUME III CONVERTED MARINE TRANSFER STATIONS - Commercial Waste Processing and Analysis of Potential Impacts March 2004 Prepared for: New York City Department of Sanitation for submission to the New York City Council Prepared by: Henningson, Durham & Richardson Architecture and Engineering, P.C. and its Subconsultants

2 This report was prepared by Henningson, Durham & Richardson Architecture and Engineering, P.C. and its Subconsultants
3 PREFACE Local Law 74 of 2000 (LL74) mandated the conduct of a comprehensive study of commercial waste management (Commercial Waste Management Study or Study) in New York City (City) by a Consultant funded by the City Department of Sanitation (DSNY). This Study undertaken to comply with LL74 will assist the City in managing the commercial waste stream in the most efficient and environmentally sound manner, and assist in the development of the City s Solid Waste Management Plan (New SWMP) for the New SWMP Planning Period. As stated in LL74, the Study should include an analysis of whether putrescible and non-putrescible solid waste transfer stations and city-owned marine transfer stations should receive and process both residential and commercial solid waste and the options for transporting such solid waste to and from such transfer stations, including an analysis of potential environmental, economic and public health impacts. The Commercial Waste Management Study Final Scope of Work describes the approach used to address this issue. In addition to this Volume III, the Study consists of five other volumes: Volume I: Private Transfer Station Evaluations; Volume II: Commercial Waste Generation and Projections; Volume IV: Evaluation of Waste Disposal Capacity Potentially Available to New York City; Volume V: Manhattan Transfer Station Siting Study; and Volume VI: Waste Vehicle Technology Assessment. This volume, Volume III: Converted Marine Transfer Stations (MTSs) Commercial Waste Processing and Analysis of Potential Impacts, reports on: (i) the capacity required by DSNY for DSNY-managed Waste at each of the Converted MTSs; (ii) the quantity of capacity potentiallyavailable for private carters delivering commercial waste; and (iii) the results of the Commercial Waste Management Study ES-1 March 2004 Volume III Converted Marine Transfer Stations: Executive Summary
4 environmental review evaluating whether that capacity can be used without causing potentially unmitigatible adverse environmental impacts. The reports and appendices that provide the analyses and data in support of this Executive Summary are: Summary Report on Commercial Waste Processing at Converted MTSs and its Appendix: Appendix A: MTS Environmental Evaluation Technical Backup for the MTS Environmental Evaluation is available on request by contacting the office of the DSNY Assistant Commissioner, Harry Szarpanski, P.E., (917) Commercial Waste Management Study Volume III Converted Marine Transfer Stations Commercial Waste Processing and Analysis of Potential Impacts: Executive Summary ES-2
5 EXECUTIVE SUMMARY Scope of Analysis/Approach LL74 requires the Study to consider whether the City s MTS system could accommodate commercial waste as well. When LL74 was adopted, the concept of developing an MTS Conversion Program for containerizing waste for long-term export was not established as a policy objective of the City. Given this policy objective, addressing the issue of processing commercial waste at the Converted MTSs first required, as a foundation, an environmental review of the potential impacts associated with processing DSNY-managed Waste at the new facilities. That environmental review, using City Environmental Quality Review (CEQR) methodologies, is reported in Volume III, Appendix A, MTS Environmental Evaluation, to this report. It concludes that the DSNY-managed Waste generated in the wastesheds that historically delivered to the MTS system can be containerized for export without causing potentially unmitigatible significant adverse environmental impacts. The next step was to analyze what impacts would result from the potential delivery of commercial putrescible waste to the Converted MTSs. It is important to emphasize that this assessment focuses solely on environmental considerations. It should not be interpreted as a general conclusion that export of commercial waste through the Converted MTSs is feasible. Some of the additional factors that bear on the issue of feasibility that are not addressed in this report are: The economics of export through the MTSs, which will be determined in part by proposals from private vendors for transport and disposal of containerized waste from the Converted MTSs. The City has just received and begun evaluating these proposals. Thus the economics of commercial waste export through the Converted MTSs is not yet known. The types of business arrangements that the City would enter into with carters for exporting commercial waste through the MTSs, which are not yet defined. Whether further development of the designs for the Converted MTSs will substantiate the operational assumptions or necessitate that the assumed operational capacity be reduced. Commercial Waste Management Study Volume III Converted Marine Transfer Stations Commercial Waste Processing and Analysis of Potential Impacts: Executive Summary ES-3
6 The comparative cost of exporting through the existing private Transfer Stations, which could be more attractive. The potential permit limitations that NYSDEC may place on the operation of the Converted MTSs. The location of some MTSs in relation to the sources of commercial waste generation, which may not provide the same efficiencies and consequently be as attractive to private carters as delivering to private Transfer Stations. The evaluation of processing commercial putrescible waste at the Converted MTSs is an incremental analysis, complying with the CEQR procedures, that builds on the foundation of the Volume III, Appendix A, MTS Environmental Evaluation report. The analysis of the potential on-site-related impacts associated with processing DSNY-managed Waste is based on the design capacities of the Converted MTSs and concluded that there were no unmitigatible significant adverse impacts. Since commercial putrescible waste deliveries would not exceed these facility design capacities, the potential processing of some quantities of the City s commercial putrescible waste would not cause any incremental significantly adverse impacts attributable to on-site operations. The analysis of off-site impacts associated with processing putrescible commercial waste required an incremental environmental review of the potential for on-site air quality and off-site (mobile) air quality and noise impacts attributable to delivery of such commercial waste. The starting point in evaluating the potential capacity available for commercial putrescible waste was defining a scenario for DSNY s capacity requirements that reserved the block of time from 8:00 a.m. to 8:00 p.m. for processing DSNY-managed Waste and assumed that deliveries of DSNY-managed Waste during the 8:00 p.m. to 8:00 a.m. period would have priority over deliveries of commercial waste. Table ES-1 summarizes: The design capacity in tons per day (tpd) that each Converted MTS is capable of processing under a normal operations scenario; The capacity reserved for DSNY-managed Waste; and The potential available excess capacity at each of the Converted MTSs. Commercial Waste Management Study Volume III Converted Marine Transfer Stations Commercial Waste Processing and Analysis of Potential Impacts: Executive Summary ES-4
7 The column showing DSNY-managed Waste reserved capacity reflects the historical average peak day generation in the respective MTS wastesheds. Under conditions of high peak generation, the MTSs can be operated to process DSNY-managed Waste in excess of the tpd quantities shown in the table. Table ES-1 DSNY-managed Waste Reserved Capacity Scenario Converted MTS Design Capacity (1) (tpd) DSNY-managed Waste Reserved Capacity (tpd) Excess Capacity, 8:00 a.m. to 8:00 p.m. (tons) Excess Capacity, 8:00 p.m. to 8:00 a.m. (tons) Converted MTS Facility West 135th Street 4,290 1,180 1,211 1,853 East 91st Street 4, ,227 2,183 West 59th Street (2) 2, South Bronx 4,290 2, ,732 North Shore 4,290 2, ,000 Greenpoint 4,290 2, ,145 Hamilton Avenue 4,290 2, ,337 Southwest Brooklyn 4,290 1,090 1,418 1,725 Totals 32,175 13,120 6,295 11,931 Notes: (1) Based on operating MTSs under normal operating conditions. Spare operating lines are not used to process waste. (2) West 59 th Street is a lift and load operation, not an open top-loading slot system. Given the DSNY-managed Waste Reserved Capacity Scenario, a Commercial Waste Capacity Scenario was defined to determine the potential available capacity that could be used by private carters delivering waste from commercial sources. This scenario identified the potential available capacity on an hourly basis at each Converted MTS, and provided the basis for evaluating the potential on-site air quality, off-site air quality and off-site noise impacts associated with the delivery of commercial waste in nighttime hours. The maximum capacity potentially available for processing commercial waste was evaluated with a spreadsheet model that incorporates both Converted MTS design and operating parameters developed by the DSNY s Consultant design team and arrival profiles for DSNY-managed Waste. It is assumed that, between the hours of 8:00 p.m. and 8:00 a.m., both DSNY-managed Waste and commercial waste could be received and processed at the Converted MTSs. Table ES-2 summarizes the Commercial Waste Management Study Volume III Converted Marine Transfer Stations Commercial Waste Processing and Analysis of Potential Impacts: Executive Summary ES-5
8 results of this evaluation. As shown in the Potential Available Capacity, 8:00 p.m. to 8:00 a.m. column, the total capacity potentially available for processing commercial waste during this period totals 11,931 tons, allocated among the eight MTSs. This does not take into account any environmental constraints that may limit the potential delivery of commercial waste. Table ES-2 Available Potential Excess Capacity at Converted MTSs Based on the Capacity Reserved for DSNY-managed Waste Converted MTS Facility Average Day Design Capacity (1) (tpd) Potential Available Capacity, Average Peak Day (tpd) Potential Available Capacity, 8:00 a.m. to 8:00 p.m. (tons) Average Peak Day Potential Available Capacity, 8:00 p.m. to 8:00 a.m. (tons) Potential Additional Number of Commercial Vehicles, 8:00 p.m. to 8:00 a.m. (2) (per day) Maximum Number of DSNY Collection Vehicles, 8:00 a.m. to 8:00 p.m. (peak hour) Potential Range of Maximum Number of Collection Vehicles (3) 8:00 p.m. to 8:00 a.m. (peak hour) West 135 th Street 4,290 3,110 1,211 1, East 91 st Street 4,290 3,410 1,227 2, West 59 th Street (4) 2,145 1, South Bronx 4,290 2, , North Shore 4,290 1, , Greenpoint 4,290 1, , Hamilton Avenue 4,290 2, , Southwest Brooklyn 4,290 3,200 1,418 1, Totals 32,175 19,055 6,295 11,931 1,123 Notes: (1) Based on operating the MTSs under normal operating conditions. Spare operating line is not used to process waste. (2) Assuming commercial collection vehicles deliver an average of 11 tons per truck. (Field data indicates commercial collection vehicles average between 11 and 13 tons per truck.) (3) DSNY collection vehicles and commercial Waste Hauling Vehicles. (4) West 59 th Street is a lift and load operation - not an open top-loading slot system. Commercial Waste Management Study Volume III Converted Marine Transfer Stations Commercial Waste Processing and Analysis of Potential Impacts: Executive Summary ES-6
9 Findings Processing of Commercial Waste at the Converted MTSs 1. The CEQR analyses in the MTS Environmental Evaluation show there are no potentially significant unmitigatible adverse environmental impacts associated with on-site processing of DSNY-managed Waste. This would also apply to processing of commercial waste at each converted MTS in the quantities shown in Table ES-2. However, further evaluation of potential on-site air quality, off-site noise and off-site air quality impacts from nighttime deliveries of commercial waste was required. 2. The on-site air quality analysis of processing DSNY-managed Waste at some of the Converted MTS sites showed that using the facility average design capacity (including the processing of commercial waste) to estimate pollutants did not cause an exceedance of annual average standards. 3. The off-site air quality analysis of processing DSNY-managed Waste at some of the Converted MTS sites showed that using the conservative assumption that peak hour conditions occur 24 hours per day (a Tier I analysis) resulted in unmitigatible environmental impacts for PM 10 and PM 2.5. (See Section 10 of the individual chapters in the MTS Environmental Evaluation for these analyses.) Therefore, a Tier II air quality analysis was also performed for deliveries of commercial waste at intersections near each of the Converted MTS sites. The analysis used data on actual hourly traffic volumes on routes to and from the site and included the higher number of commercial collection vehicles assumed to deliver to each Converted MTS during the 8:00 p.m. to 8:00 a.m. period. No significant adverse unmitigatible environmental off-site air quality impacts were identified. 4. Evaluating the potential for off-site noise impacts required the use of a second-level noise screening analysis. (See Section of Volume III, Appendix A for a detailed explanation.) The results of this analysis indicate that the number of potential commercial Waste Hauling Vehicles that could be routed to the MTSs during various hours within the 8:00 p.m. to 8:00 a.m. period must be limited to less than the available Commercial Waste Management Study Volume III Converted Marine Transfer Stations Commercial Waste Processing and Analysis of Potential Impacts: Executive Summary ES-7
10 excess capacity to avoid causing potential impacts at sensitive receptors on the analyzed routes these vehicles might take to the MTSs. The amount of available capacity that can potentially be used to process commercial waste during the hours of 8:00 a.m. to 8:00 p.m. without causing any significant adverse noise impacts is summarized in Table ES-3. Table ES-3 Converted MTS Potential Commercial Waste Capacities Summary Table Location Total Potential Commercial Vehicles (per day) Converted MTS Design Capacity Potential Commercial Waste Tonnage 8:00 p.m. to 8:00 a.m. (tons) DSNYmanaged Waste Delivered 8:00 p.m. to 8:00 a.m. (tons) Potential Converted MTS Capacity with Off-Site Noise Constraints Total Potential Commercial Vehicles (per day) Potential Commercial Waste Tonnage 8:00 p.m. to 8:00 a.m. (tons) West 135 th Street 175 1, ,029 East 91 st Street (1) 199 2, West 59 th Street (2) South Bronx (1) 163 1, ,611 North Shore (3) 95 1, ,000 Greenpoint (1) 109 1, ,145 Hamilton Avenue (1) 129 1, ,306 Southwest Brooklyn (4) 162 1, Total 1,123 11,931 3, ,656 Notes: (1) Need to use different routes for potential commercial Waste Hauling Vehicles to deliver the full amount of excess capacity for commercial waste. (2) Can take all potential commercial Waste Hauling Vehicles without any noise constraints. (3) There is a route to the North Shore Converted MTS that does not pass sensitive receptors that must be used from 12:00 a.m. to 6:00 a.m. to deliver the full amount available for commercial capacity. The route should not be used at other times upon request from the City Department of Transportation (NYCDOT) due to congestion that occurs at certain intersections along the route during daytime traffic hours. (4) Outbound trucks passing 26 th Street between Cropsey Avenue and Shore Road limit the number of inbound commercial Waste Hauling Vehicles that can be accommodated at the Southwest Brooklyn Converted MTS. Commercial Waste Management Study Volume III Converted Marine Transfer Stations Commercial Waste Processing and Analysis of Potential Impacts: Executive Summary ES-8
11 Since these results are based on a second-level screening for noise impacts, a detailed off-site noise analysis, utilizing the Federal Highway Administration (FHWA) Traffic Noise Model (TNM) Version 2.1, is being performed to determine if noise impacts would actually occur at these sensitive receptor locations and/or if additional potential commercial Waste Hauling Vehicles could be routed to the MTS during the 8:00 p.m. to 8:00 a.m. hour, without causing unmitigatible significant adverse off-site noise impacts, to fully utilize the potentially available capacity of the MTSs. The results of the off-site detailed noise analyses will be available at a later date. 5. This evaluation of potential processing commercial waste at the Converted MTSs was limited to an environmental review that focused on traffic, on-site and off-site air quality and noise, and on-site odor impacts. Processing of DSNY-Managed Waste at the Converted MTSs This section summarizes key findings from Volume III, Appendix A, MTS Environmental Evaluation, an environmental review of operations for the Converted MTSs in processing DSNY-managed Waste. 1. Table ES-4 summarizes the facility design capacity assumptions and the assumed tons of DSNY-managed Waste processed during average peak days that were the basis of the MTS Environmental Evaluation. The assumed tons of DSNY-managed Waste in this table vary from the tons shown in the DSNY-managed Waste Reserved Capacity Scenario Table ES-1. This reflects a contingency added to DSNY average peak day deliveries to provide a margin of conservatism in the analysis. 2. Based on the design capacity and operating assumption, described in more detail in Volume III, the MTS Environmental Evaluation found there were no unmitigatible significant adverse environmental impacts associated with processing the average peak day deliveries of DSNY-managed Waste. The environmental evaluation demonstrates the Converted MTSs will enable export of DSNY-managed Waste in an efficient and environmentally sound manner. This summary conclusion is supported by the environmental evaluation that addressed: Land Use, Zoning and Public Policy; Commercial Waste Management Study Volume III Converted Marine Transfer Stations Commercial Waste Processing and Analysis of Potential Impacts: Executive Summary ES-9
12 Table ES-4 MTS Environmental Analysis Information Total Number of Loading Slots DSNYmanaged Waste Average Peak Day Deliveries, (tons) (1) Number of DSNY- Managed Vehicles, Average Peak Day Average Day Design Capacity (2) (tpd) Peak-Hour Number of DSNY Collection Vehicles Converted MTS Facility West 135 th Street 4 1, , East 91 st Street 4 1, , West 59 th Street (3) 3 1, , South Bronx 4 2, , North Shore 4 2, , Greenpoint 4 3, , Hamilton Avenue 4 2, , Southwest Brooklyn 4 1, , Totals 16,076 2,024 32,175 Notes: (1) All MTSs based on scale data from Fiscal Year 1998 received from the DSNY Bureau of Cleaning and Collection with a 20% contingency allowance, except for the South Bronx MTS. South Bronx MTS data is based on Fiscal Year 1997 with a 20% contingency allowance. (2) Based on operating the MTS under normal operating conditions. Spare operating line is not used to process waste. (3) West 59 th Street is a lift and load operation - not an open top-loading slot system. ES-10 Commercial Waste Management Study Volume III Converted Marine Transfer Stations Commercial Waste Processing and Analysis of Potential Impacts: Executive Summary
13 Socioeconomic Conditions; Neighborhood Character; Community Facilities and Services; Open Space and Parklands; Cultural Resources; Traffic and Transportation; Air Quality; Noise; Infrastructure and Energy and Solid Waste; Natural Resources (including Endangered Species and Habitats); Water Quality; Waterfront Revitalization Program; Hazardous Materials; and Urban Design and Visual Quality. For the eight MTSs, the following measures were identified to mitigate estimated adverse impacts for traffic and on-site noise: Traffic signal timing adjustments would mitigate estimated traffic impacts identified at five intersections near the South Bronx Converted MTS; three intersections near the Southwest Brooklyn Converted MTS; three intersections near the Greenpoint Converted MTS; two intersections near the Hamilton Avenue Converted MTS; one intersection near the West 135 th Street Converted MTS; two intersections near the East 91 st Street Converted MTS; and two intersections near the North Shore Converted MTS. No traffic impacts were estimated at traffic study intersections identified near the West 59 th Street Converted MTS. Construction of a 20-foot-tall (from the ramp surface) noise barrier located on the southern side of the ramp at the South Bronx Converted MTS would mitigate the potential noise impact on a nearby prison barge. A 20-foot-tall (from the ramp surface) noise barrier located on the southeast property line of the Southwest Brooklyn Converted MTS and a restriction on the number of nighttime arrivals of collection vehicles queuing on trucks and ramps would mitigate the potential noise impact on a nearby residential complex. Subsurface site investigations at the Southwest Brooklyn, Greenpoint, and Hamilton Avenue Converted MTS sites are underway. Results will be provided at a later date. These analyses and findings are detailed in the MTS Environmental Evaluation, the appendix to this volume. ES-11 Commercial Waste Management Study Volume III Converted Marine Transfer Stations Commercial Waste Processing and Analysis of Potential Impacts: Executive Summary
14 TABLE OF CONTENTS 1.0 PROCESSING COMMERCIAL WASTE AT THE CONVERTED MARINE TRANSFER STATIONS AND RELATED POTENTIAL IMPACTS INTRODUCTION SUMMARY OF ON-SITE IMPACT ANALYSES IN THE MTS ENVIRONMENTAL EVALUATION DSNY CAPACITY REQUIREMENTS AND AVAILABLE COMMERCIAL WASTE CAPACITY DSNY-MANAGED WASTE RESERVED CAPACITY SCENARIO COMMERCIAL WASTE CAPACITY SCENARIO SUMMARY OF OFF-SITE IMPACT ANALYSES TRAFFIC AIR QUALITY NOISE Noise Impact Analysis of Commercial Waste Deliveries ATTACHMENTS Attachment 1 Full Capacity Analysis for Each Converted MTS, Hourly Results of Modeling Attachment 2 Assumed Commercial Waste Vehicle Truck Routes Attachment 3 Commercial Waste Vehicle Allocation by Approach Direction Attachment 4 On- and Off-Site Air Quality Analysis Results, DSNY-managed Waste Plus Commercial Waste Collection Vehicles Attachment 5 Commercial Waste Trucks Allowed Based on Second-Level Noise Screening LIST OF TABLES Table MTS Environmental Analysis Information Table DSNY-managed Waste Reserved Capacity Scenario Table Available Potential Excess Capacity at Converted MTSs Based on the Capacity Reserved for DSNY-managed Waste Table Converted MTS Commercial Waste Capacities Summary Table Commercial Waste Management Study i March 2004 Volume III Converted Marine Transfer Stations: Summary Report
15 List of Acronyms/Definitions Acronyms CD CEQR CO DEIS DSNY FHWA LL74 MTS NAAQS NYCDOT NYSDOT PCE ppm PM 10 PM 2.5 STV SWMP TNM tpd community district City Environmental Quality Review carbon monoxide Draft Environmental Impact Statement New York City Department of Sanitation Federal Highway Administration Local Law 74, effective December 19, 2000, enacted by the City Council, requiring a comprehensive assessment of commercial solid waste management in New York City marine transfer station National Ambient Air Quality Standards New York City Department of Transportation New York State Department of Transportation passenger car equivalent parts per million particulate matter less than 10 microns in diameter particulate matter less than 2.5 microns in diameter screening threshold value Solid Waste Management Plan Traffic Noise Model tons per day Commercial Waste Management Study ii March 2004 Volume III Converted Marine Transfer Stations: Acronyms and Definitions
16 µg/m 3 Acronyms micrograms per cubic meter Commercial Waste Management Study iii March 2004 Volume III Converted Marine Transfer Stations: Acronyms and Definitions
17 City Commercial Waste Capacity Scenario Converted MTS DSNY-managed Waste Definitions New York City Scenario which identifies the available capacity on an hourly basis at each Converted MTS, and provides the basis on which potential air quality and noise impacts associated with the delivery of commercial waste in nighttime hours can be evaluated One of DSNY s eight marine transfer stations, modified to containerize waste for out-of-city export by barge or rail Solid waste that DSNY collects from all residential households in the City and the institutional waste of City, state and federal agencies that DSNY collects and/or for which DSNY arranges disposal DSNY-managed Waste Reserved Capacity Scenario Final Study Scope or Final Scope of Work MTS Conversion Program Scenario which determines the Converted MTS capacity that would be required for DSNY-managed Waste to provide for an adequate margin to meet its peak demand requirements under all conditions except declared waste disposal emergencies Commercial Waste Management Study Final Scope of Work issued on July 31, 2003 The City's initiative to develop, at the sites of the existing marine transfer stations (MTSs), new converted MTSs that will containerize solid waste for long-term export by barge with the potential for additional intermodal transfers to enable delivery of containerized waste to disposal facilities outside of the City Commercial Waste Management Study iv March 2004 Volume III Converted Marine Transfer Stations: Acronyms and Definitions
18 New SWMP Definitions The new comprehensive Solid Waste Management Plan to be developed in 2004 for both DSNY-managed Waste and commercial waste for the planning period 2004 through 2024 New SWMP Planning Period The 20-year period from 2004 to 2024 addressed by the City s New Solid Waste Management Plan Study Transfer Station(s) Waste Hauling Vehicles Commercial Waste Management Study Privately owned and operated transfer station in New York City that accepts, transfers and transports some portion of municipal solid waste or construction and demolition (C&D) debris or fill material generated in the private sector for out-of- City disposal Collection vehicles/transfer trailers that are used to transport municipal solid waste, C&D debris or fill material to or from the Transfer Stations Commercial Waste Management Study v March 2004 Volume III Converted Marine Transfer Stations: Acronyms and Definitions
19 1.0 POTENTIAL PROCESSING OF COMMERCIAL WASTE AT THE CONVERTED MARINE TRANSFER STATIONS AND RELATED POTENTIAL IMPACTS 1.1 Introduction This report evaluates the capacity that would potentially be available at the Converted Marine Transfer Stations (MTSs) to containerize commercial waste delivered by private carters. When Local Law 74 (LL74) was adopted, the concept of developing an MTS Conversion Program for containerizing waste for long-term export was not established as a policy objective of New York City (City). Given this policy objective, addressing the issue of processing commercial waste at the Converted MTSs first required, as a foundation, an environmental review of the potential impacts associated with processing City Department of Sanitation (DSNY)-managed Waste. That environmental review, using City Environmental Quality Review (CEQR) methodologies, is reported in Volume III, Appendix A, MTS Environmental Evaluation. It addressed: Land Use, Zoning and Public Policy; Socioeconomic Conditions; Neighborhood Character; Community Facilities and Services; Open Space and Parklands; Cultural Resources; Traffic and Transportation; Air Quality; Odor; Noise; Infrastructure and Energy and Solid Waste; Natural Resources (including Endangered Species and Habitats); Water Quality; Waterfront Revitalization Program; Hazardous Materials; and Urban Design and Visual Quality. It demonstrates the Converted MTSs will enable export of DSNY-managed Waste in an efficient and environmentally sound manner and provides the basis on which the incremental environmental effects of containerizing and exporting commercial waste from the Converted MTSs are evaluated. The Converted MTSs, if included in the new Solid Waste Management Plan (New SWMP), would be developed at up to eight of the existing MTS sites with the tons per day (tpd) design capacities indicated below: West 135 th Street (Manhattan) 4,290 tpd East 91 st Street (Manhattan) 4,290 tpd West 59 th Street (Manhattan) 2,145 tpd Commercial Waste Management Study 1 March 2004 Volume III Converted Marine Transfer Stations: Summary Report
20 South Bronx (Hunts Point) 4,290 tpd North Shore (Queens) 4,290 tpd Greenpoint (Brooklyn) 4,290 tpd Hamilton Avenue (Brooklyn) 4,290 tpd Southwest Brooklyn 4,290 tpd Based on these design capacities and the operating assumption, described in more detail in Appendix A, MTS Environmental Evaluation, there were no unmitigatible significant adverse environmental impacts associated with processing the average peak day deliveries of DSNY-managed Waste. For the eight MTSs, the following measures were identified to mitigate estimated adverse impacts for traffic and on-site noise: Traffic signal timing adjustments would mitigate estimated traffic impacts identified at five intersections near the South Bronx Converted MTS; three intersections near the Southwest Brooklyn Converted MTS; three intersections near the Greenpoint Converted MTS; two intersections near the Hamilton Avenue Converted MTS; one intersection near the West 135 th Street Converted MTS; two intersections near the East 91 st Street Converted MTS; and two intersections near the North Shore Converted MTS. No traffic impacts were estimated at traffic study intersections identified near the West 59 th Street Converted MTS. Construction of a 20-foot-tall (from the ramp surface) noise barrier located on the southern side of the ramp at the South Bronx Converted MTS would mitigate the potential noise impact on a nearby prison barge. A 20-foot-tall (from the ramp surface) noise barrier located on the southeast property line of the Southwest Brooklyn Converted MTS and a restriction on the number of nighttime arrivals of collection vehicles queuing on trucks and ramps would mitigate the potential noise impact on a nearby residential complex. Subsurface site investigations at the Southwest Brooklyn, Greenpoint, and Hamilton Avenue Converted MTS sites are underway. Results will be provided at a later date. These analyses and findings are detailed in the MTS Environmental Evaluation, the appendix to this volume. This report evaluates the use of available Converted MTS capacity, after processing all DSNY-managed Waste on a priority basis, to potentially containerize commercial waste without causing potentially significant unmitigatible adverse impacts. Commercial Waste Management Study 2 March 2004 Volume III Converted Marine Transfer Stations: Summary Report
21 It is important to emphasize that this assessment focuses solely on environmental considerations. It should not be interpreted as a general conclusion that export of commercial waste through the Converted MTSs is feasible. Some of the additional factors that bear on the issue of feasibility that are not addressed in this report are: The economics of export through the MTSs, which will be determined in part by proposals from private vendors for transport and disposal of containerized waste from the Converted MTSs. The City has just received and begun evaluating these proposals, thus the economics of commercial waste export through the Converted MTSs are not yet known. The types of business arrangements that the City would enter into with carters for exporting commercial waste through the MTSs, which are not yet defined. Whether further development of the designs for the Converted MTSs will substantiate the operational assumptions or necessitate that the assumed operational capacity be reduced. The comparative cost of exporting through the existing private Transfer Stations, which could be more attractive. The potential permit limitations that NYSDEC may place on the operation of the Converted MTSs. The location of some MTSs in relation to the sources of commercial waste generation, which may not provide the same efficiencies and consequently be as attractive to private carters as delivering to private Transfer Stations. 1.2 Summary of On-Site Impact Analyses in the MTS Environmental Evaluation On-site air quality, odor and noise impacts in the MTS Environmental Evaluation were evaluated assuming that the Converted MTSs operated at their design capacities. Appropriate CEQRbased methodologies were applied to evaluate the potential for any significant unmitigatible adverse environmental impacts. As noted in Table 1.2-1, the design capacities are significantly higher than the anticipated quantities of DSNY-managed Waste. The MTS design capacities were based on, among other things, the following considerations: Ensuring a facility design with the capacity to containerize DSNY-managed Waste at the peak hourly arrival rates of DSNY collection vehicles; Commercial Waste Management Study 3 March 2004 Volume III Converted Marine Transfer Stations: Summary Report
22 Providing redundancy in the system to deal with upset conditions affecting operations at a facility or with weather-related emergencies; and Allowing for future growth. Table MTS Environmental Analysis Information Total Number of Loading Slots DSNYmanaged Waste Average Peak Day Deliveries, (tons) (1) Number of DSNYmanaged Vehicles, Average Peak Day Average Day Design Capacity (2) (tpd) Peak-Hour Number of DSNY Collection Vehicles Converted MTS Facility West 135 th Street 4 1, , East 91 st Street 4 1, , West 59 th Street (3) 3 1, , South Bronx 4 2, , North Shore 4 2, , Greenpoint 4 3, , Hamilton Avenue 4 2, , Southwest Brooklyn 4 1, , Totals 16,076 2,024 32,175 Notes: (1) All MTSs based on scale data from Fiscal Year 1998 received from the DSNY Bureau of Cleaning and Collection with a 20% contingency allowance, except for the South Bronx MTS. South Bronx MTS data is based on Fiscal Year 1997 with a 20% contingency allowance. (2) Based on operating the MTS under normal operating conditions. Spare operating line is not used to process waste. (3) West 59 th Street is a lift and load operation - not an open top-loading slot system. Although these peak hourly arrival rates are not sustained over a 24-hour period, the MTS Environmental Evaluation of on-site impacts conservatively modeled these peak hour conditions to predict the potential for on-site noise and odor impacts, and air quality impacts for short-term (1-hour, 3-hour, 8-hour and 24-hour) averaging periods. Because the analyses of short-term averaging periods were based on facility operations at the design capacity, no additional evaluation of on-site noise and odor impacts related to the processing of commercial waste was required. Commercial Waste Management Study 4 March 2004 Volume III Converted Marine Transfer Stations: Summary Report
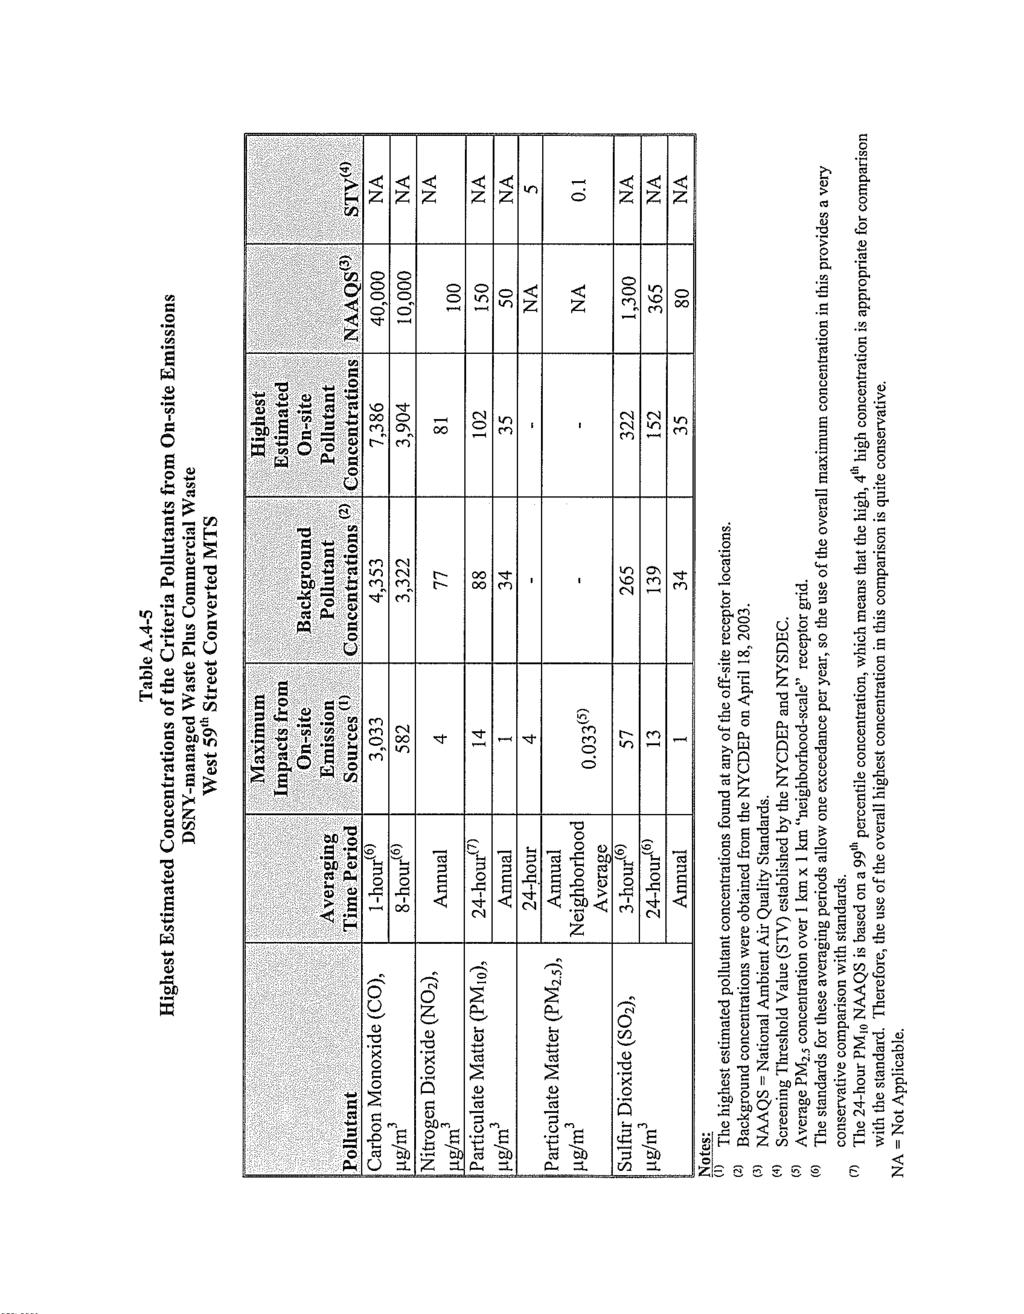
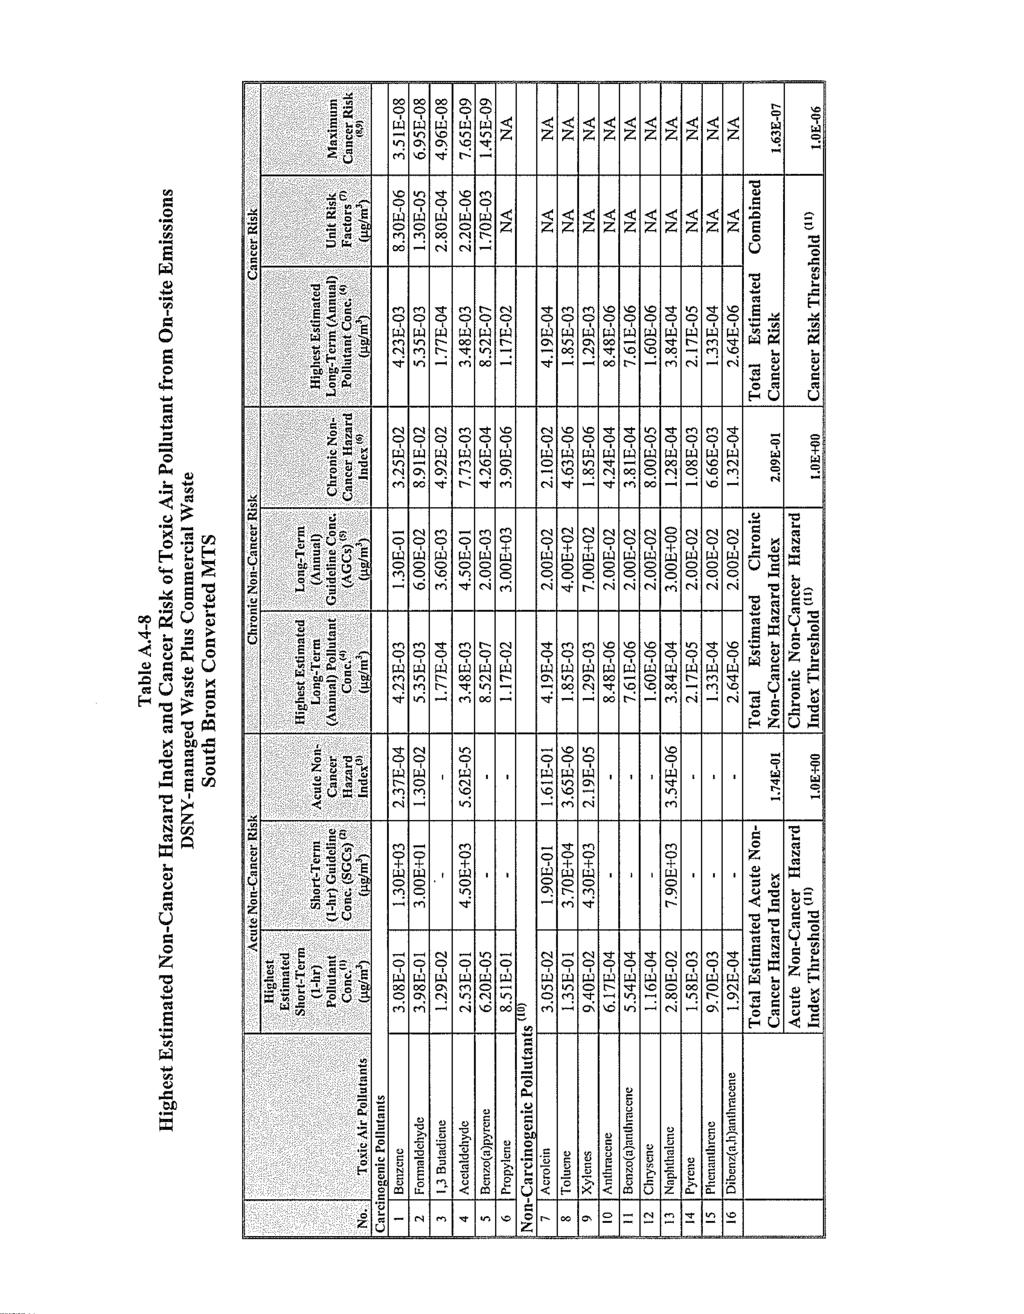
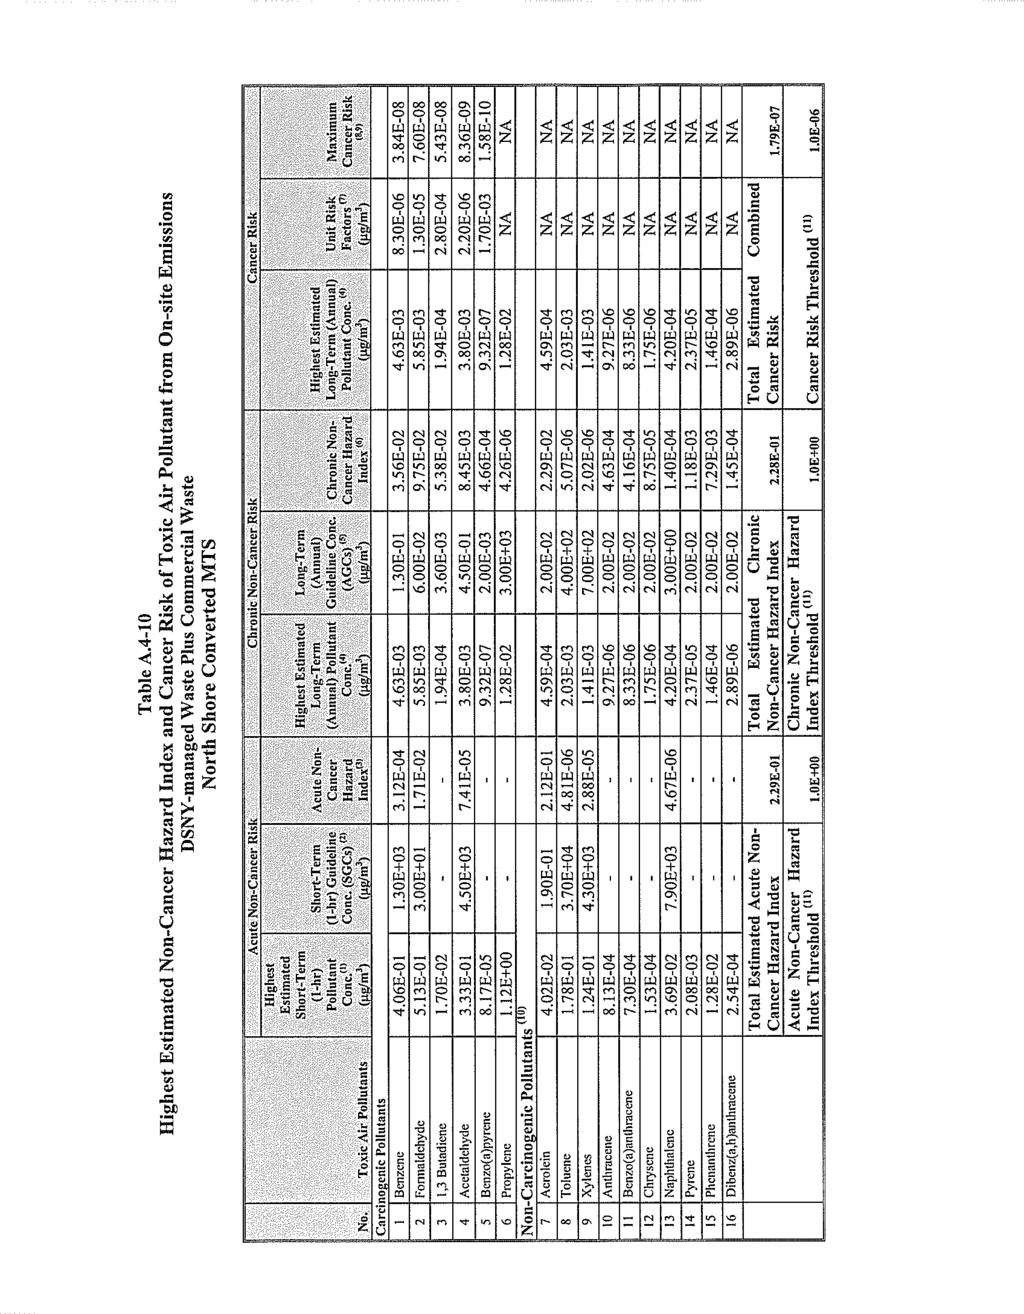
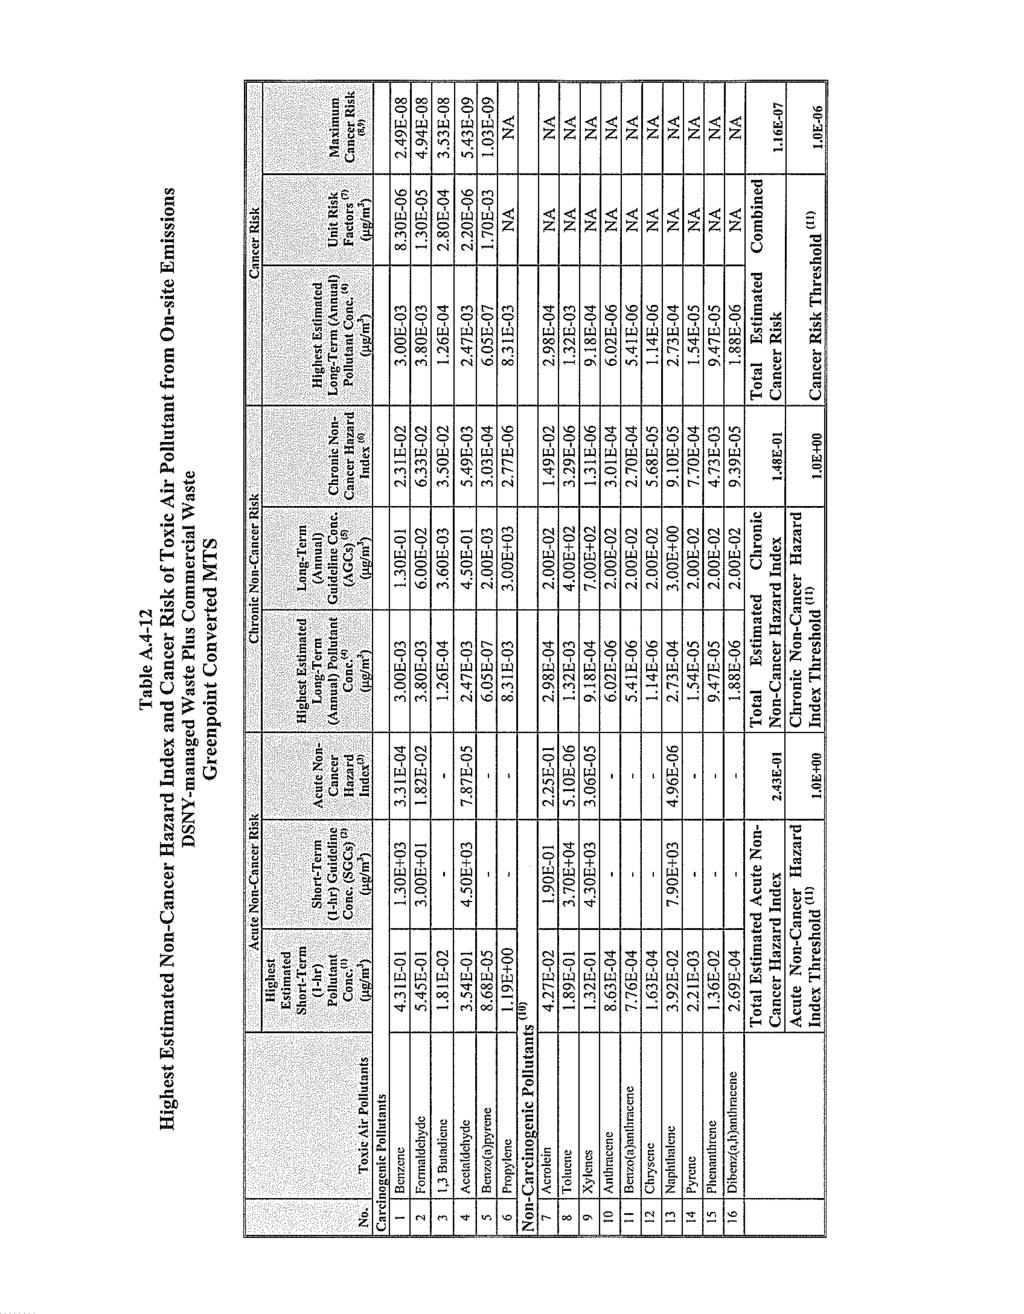
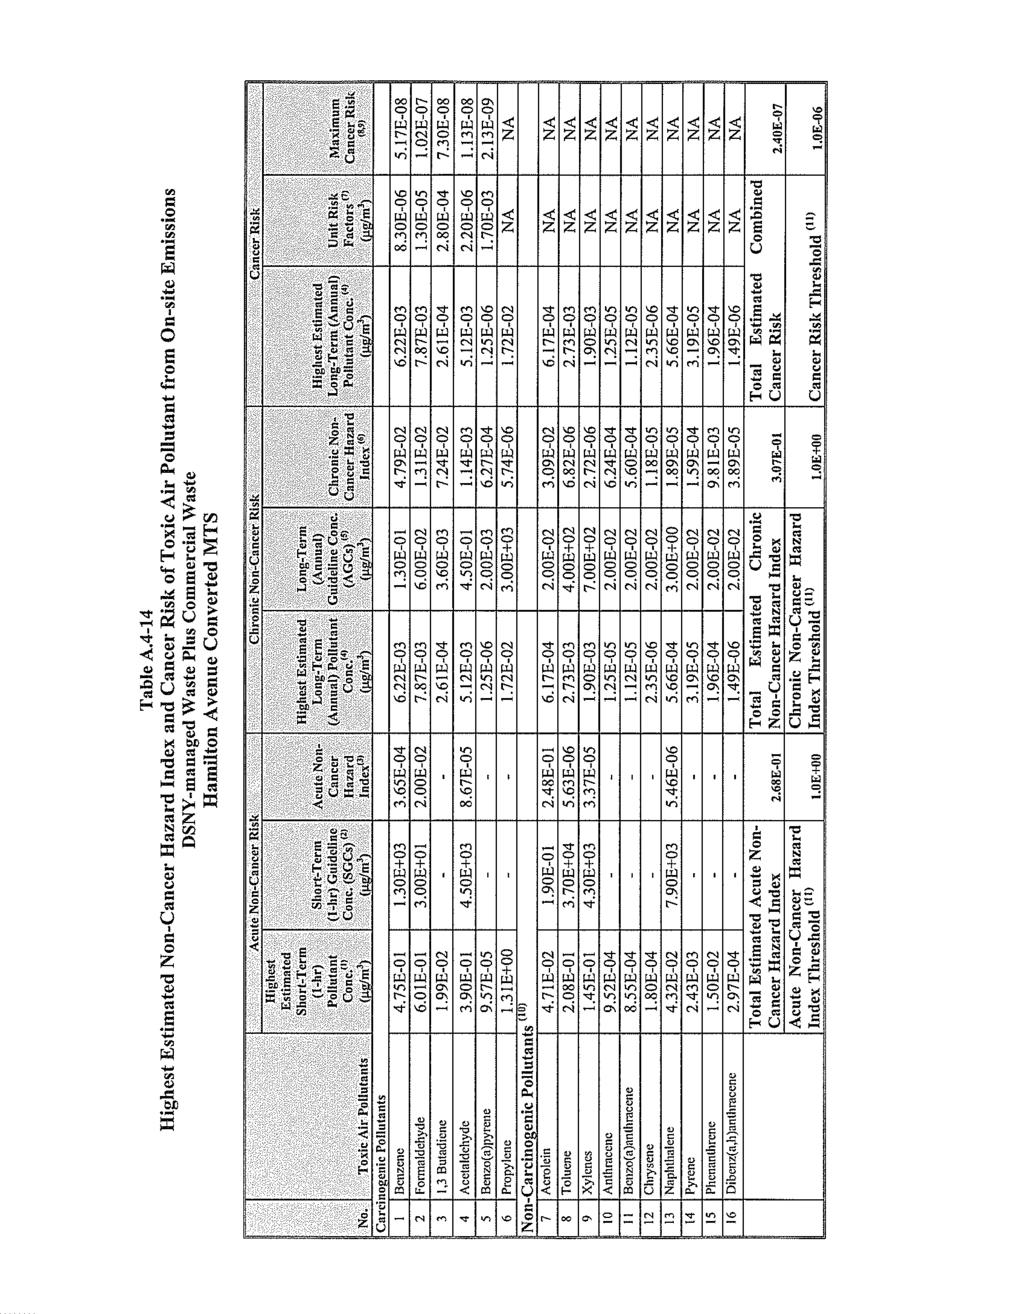
23 An evaluation of potential on-site air quality impacts for pollutants compared to annual average standards was modeled assuming commercial waste was processed at the Converted MTSs. Based on these analyses, the potential processing of some quantities of the City s commercial putrescible waste would not cause any incremental significantly adverse impacts attributable to on-site operations (see Attachment 4). Table also presents the average peak day 1 assumptions for delivery of DSNY-managed Waste used in the environmental analyses performed at each Converted MTS. For the on-site analysis, a 20% contingency factor (i.e., expected peak volumes were increased by 20%) was applied to the average peak day number of DSNY collection vehicles. 1 The average peak day is the average of historic DSNY-managed Waste delivered to the existing MTSs on the peak day each week for 52 weeks (i.e., the average of 52 Tuesdays). Commercial Waste Management Study 5 March 2004 Volume III Converted Marine Transfer Stations: Summary Report
24 2.0 DSNY CAPACITY REQUIREMENTS AND POTENTIALLY AVAILABLE COMMERCIAL WASTE CAPACITY 2.1 DSNY-managed Waste Reserved Capacity Scenario In evaluating the potential quantity of commercial waste that could be processed at the Converted MTSs, DSNY first determined the facility capacity that would be required for DSNY-managed Waste to provide for an adequate margin to meet its peak demand requirements under all conditions except declared waste disposal emergencies. This is referred to as the DSNY-managed Waste Reserved Capacity Scenario. This scenario differs in certain respects from the assumptions made in the MTS Environmental Evaluation. It is based on historical waste delivery patterns for the average peak days, not including a 20% contingency factor, and reserves all capacity between 8:00 a.m. and 8:00 p.m. for DSNY-managed Waste deliveries. Under conditions of high peak generation, the waste processing throughput of the Converted MTSs can be increased over a short period of time with the addition of personnel and extended shift operating time. DSNY has defined the allocation of the total number of loads and tons of DSNY-managed Waste that would be delivered to each Converted MTS based on each MTS s historical wasteshed. They used a historical annual average of peak day deliveries to the existing MTSs as a basis for reserving sufficient capacity for processing DSNY-managed Waste at each Converted MTS. An hourly distribution of the loads and tons delivered to each MTS was developed based on historical delivery data to the existing MTSs provided by DSNY. For each Converted MTS, a model was set up using this delivery data to simulate the operation of each MTS for processing its allotted DSNY-managed Waste on an hourly basis under normal operating conditions. The following assumptions were made about the normal operations of the Converted MTSs: The Converted MTS would process ten containers per hour with three loading slots in operation, except for the West 59 th Street MTS; The West 59 th Street MTS would process five containers per hour using a lift-and-load-type operation and two of the three loading slots; The loader level would be kept as clear of waste as possible during processing hours by loading all waste received into containers as soon as possible and keeping stockpiles at a minimum; Commercial Waste Management Study 6 March 2004 Volume III Converted Marine Transfer Stations: Summary Report
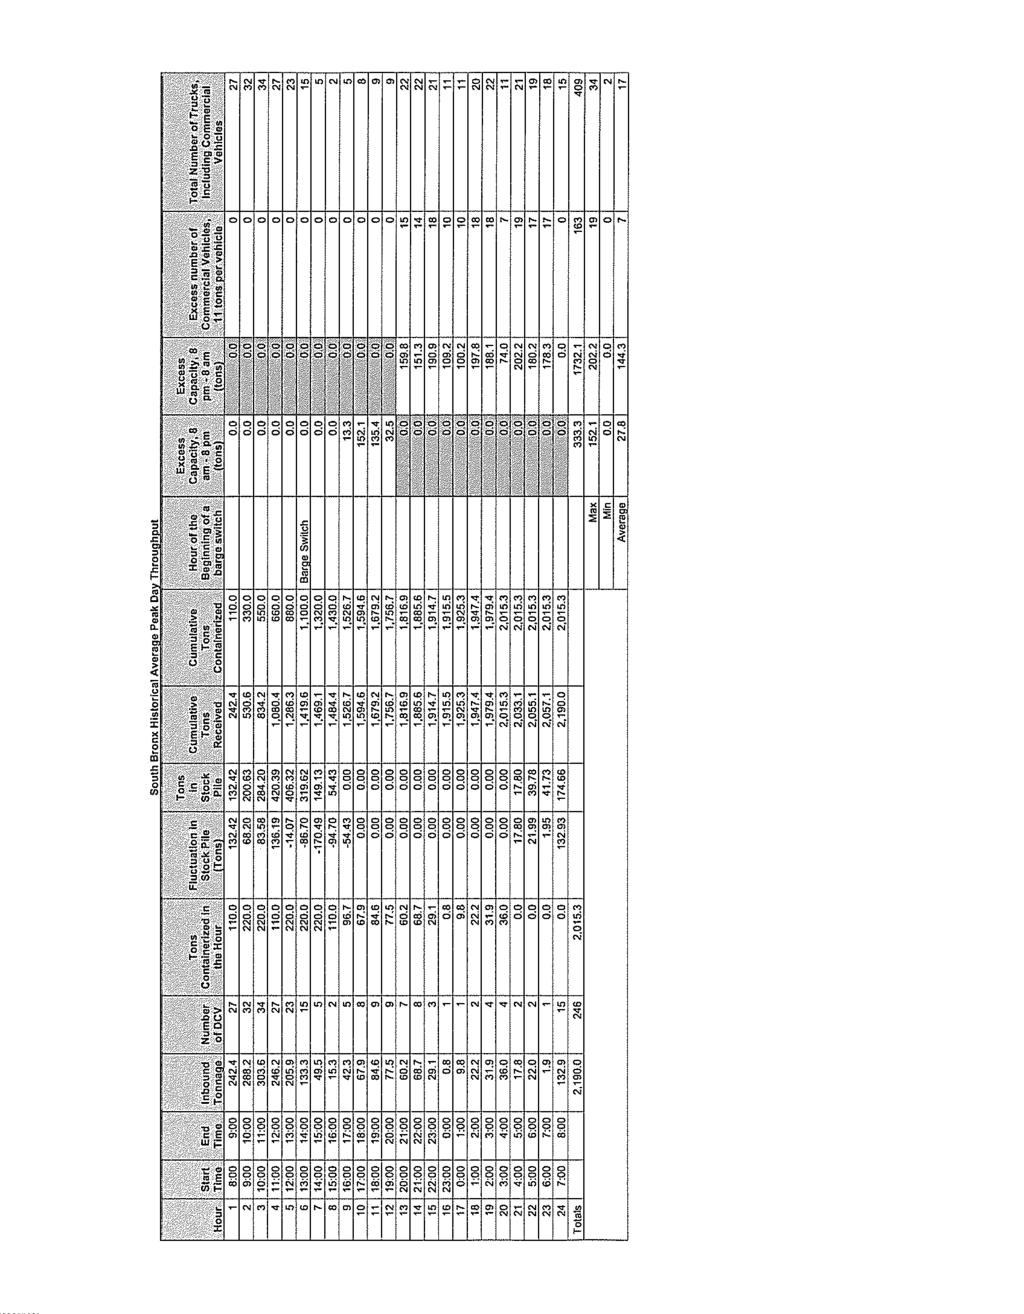
25 Each container would be loaded with approximately 20 to 22 tons of waste; Each barge would be loaded with 48 containers of waste; Barge switches would not interrupt waste processing operations; and Employees would effectively work six and one-half hours out of an eight-hour shift due to shift changes and break time during the shift. Based on these assumptions, the Converted MTSs, except for the West 59 th Street facility, would containerize a maximum of 220 tons of waste per hour and 4,290 tons of waste per day under normal operating conditions. The West 59 th Street Converted MTS would containerize a maximum of 110 tons of waste per hour and 2,145 tons of waste per day. Waste delivery profiles were established for each Converted MTS and tons and loads were allotted to each Converted MTS on an hourly basis. Facility performance was modeled on an hour-to-hour basis for 24 hours beginning with the first (8:00 a.m. to 4:00 p.m.) of three shifts. The model calculated the difference between the incoming tonnage and the maximum available processing capacity during the same hour. If the incoming tonnage exceeded the processing capacity of the Converted MTS for that hour, the excess tonnage is stockpiled. Stockpiled waste is processed during a subsequent hour, when additional capacity became available. If the total incoming waste plus any waste in the stockpile is less than the processing capacity of the Converted MTS, the model computed the capacity available during that hour to process additional waste. In addition to calculating the available waste capacity at the Converted MTSs, the model calculated the cumulative tons received, cumulative tons containerized and cumulative number of DSNY collection vehicles that delivered waste to the MTS on an hourly basis. The capacity model also calculated the fluctuation in the stockpile and tonnage in the stockpile by hour and the approximate hour in which barge switches would occur. Table presents a summary of the reserved capacity for DSNY-managed Waste and available excess capacity at each of the Converted MTSs. The column showing DSNY-managed Waste reserved capacity reflects the historical average peak day generation in the respective MTS wastesheds. Commercial Waste Management Study 7 March 2004 Volume III Converted Marine Transfer Stations: Summary Report
26 Table DSNY-managed Waste Reserved Capacity Scenario Converted MTS Design Capacity (1) (tpd) DSNY-managed Waste Reserved Capacity (tpd) Excess Capacity, 8:00 a.m. to 8:00 p.m. (tons) Excess Capacity, 8:00 p.m. to 8:00 a.m. (tons) Converted MTS Facility West 135th Street 4,290 1,180 1,211 1,853 East 91st Street 4, ,227 2,183 West 59th Street (2) 2, South Bronx 4,290 2, ,732 North Shore 4,290 2, ,000 Greenpoint 4,290 2, ,145 Hamilton Avenue 4,290 2, ,337 Southwest Brooklyn 4,290 1,090 1,418 1,725 Totals 32,175 13,120 6,295 11,931 Notes: (1) Based on operating MTSs under normal operating conditions. Spare operating lines are not used to process waste. (2) West 59 th Street is a lift and load operation, not an open top-loading slot system. tpd = tons per day 2.2 Commercial Waste Capacity Scenario Given the DSNY-managed Waste Reserved Capacity Scenario, a Commercial Waste Capacity Scenario was defined to determine the potential available capacity that could be used by private carters delivering waste from commercial sources. This scenario identified the potential available capacity on an hourly basis at each Converted MTS, and provided the basis for evaluating the potential off-site air quality and off-site noise impacts associated with the delivery of commercial waste in nighttime hours. The Commercial Waste Capacity Scenario involved the following steps: Quantifying the tons of waste and number of DSNY-managed Waste collection vehicles delivering waste to each Converted MTS on an hourly basis; Identifying hours in which additional waste could be delivered to the Converted MTSs; Calculating the additional tons of waste that could be delivered to each Converted MTS on an hourly basis; Commercial Waste Management Study 8 March 2004 Volume III Converted Marine Transfer Stations: Summary Report
27 Estimating the additional number of collection vehicles it would take to deliver the additional waste; Identifying the potential commercial waste vehicle routes by approach direction (north, south, east, or west); Identifying the potential commercial wastesheds for each MTS; Estimating the number of commercial vehicles along each route based on the location of the waste source; and Determining if additional environmental analyses are required at each Converted MTS based on the additional number of collection vehicles that would deliver commercial waste and their assumed routes. The following assumptions were made about commercial waste deliveries to the Converted MTSs: Commercial waste deliveries would occur only during the 8:00 p.m. to 8:00 a.m. period; Commercial collection vehicles would deliver an average of 11 tons per vehicle; and Commercial waste deliveries would not exceed the hourly waste processing capacity of each Converted MTS, thus commercial waste would not be stockpiled at the Converted MTSs. It was assumed that all DSNY-managed Waste would be processed before any commercial waste was accepted at the MTS. Thus, the stockpile was reduced to zero tons, and all incoming DSNY-managed Waste containerized during an hour before excess capacity was allotted for commercial waste. Based on the available commercial waste tonnage, the model calculated the additional number of commercial collection vehicles required to deliver the commercial waste totaling the excess capacity. Additionally, the model calculated the total number of DSNY-managed Waste and potential commercial waste collection vehicles that could deliver waste in each hour. Excess capacity was calculated for every hour of the day. Excess capacity on the first shift and first half of the second shift (8:00 a.m. to 8:00 p.m.) was considered additional contingency for DSNY-managed Waste. Because the hourly distribution is subject to fluctuation and cannot exactly replicate the delivery patterns of DSNY-managed Waste to the Converted MTSs, the total available capacity was summarized as a total tonnage between the hours of 8:00 a.m. to Commercial Waste Management Study 9 March 2004 Volume III Converted Marine Transfer Stations: Summary Report
28 8:00 p.m. Table shows the capacity potentially available to commercial carters, based on the capacity assumptions for processing DSNY-managed Waste. The hourly results of the modeling, provided in tables in Attachment 1 to this report, show the hour-by-hour capacity analysis for each Converted MTS. Table also presents information on the potential additional number of commercial waste collection vehicles. It assumes that delivery of commercial waste by private carters uses all the remaining available capacity during the 8:00 p.m. to 8:00 a.m. period not required for processing of DSNY-managed Waste, not taking into account any environmental constraints that might limit deliveries of commercial waste. As shown in the Potential Available Capacity, 8:00 p.m. to 8:00 a.m. column, the total capacity potentially available for processing commercial waste during this period totals 11,931 tons, allocated among the eight MTSs, not taking into account the environmental constraints. Table Available Potential Excess Capacity at Converted MTSs Based on the Capacity Reserved for DSNY-managed Waste Converted MTS Facility Average Day Design Capacity (1) (tpd) Potential Available Capacity, Average Peak Day (tpd) Potential Available Capacity, 8:00 a.m. to 8:00 p.m. (tons) Average Peak Day Potential Available Capacity, 8:00 p.m. to 8:00 a.m. (tons) Potential Additional Number of Commercial Vehicles, 8:00 p.m. to 8:00 a.m. (2) (per day) Maximum Number of DSNY Collection Vehicles, 8:00 a.m. to 8:00 p.m. (peak hour) Potential Range of Maximum Number of Collection Vehicles (3) 8:00 p.m. to 8:00 a.m. (peak hour) West 135 th Street 4,290 3,110 1,211 1, East 91 st Street 4,290 3,410 1,227 2, West 59 th Street (4) 2,145 1, South Bronx 4,290 2, , North Shore 4,290 1, , Greenpoint 4,290 1, , Hamilton Avenue 4,290 2, , Southwest Brooklyn 4,290 3,200 1,418 1, Totals 32,175 19,055 6,295 11,931 1,123 Notes: (1) Based on operating the MTSs under normal operating conditions. Spare operating line is not used to process waste. (2) Assuming commercial collection vehicles deliver an average of 11 tons per truck. (Field data indicates commercial collection vehicles average between 11 and 13 tons per truck.) (3) DSNY collection vehicles and commercial Waste Hauling Vehicles. (4) West 59th Street is a lift and load operation - not an open top-loading slot system. Commercial Waste Management Study 10 March 2004 Volume III Converted Marine Transfer Stations: Summary Report
29 3.0 SUMMARY OF OFF-SITE IMPACT ANALYSES A definitive determination of the quantity of potential commercial waste that can be processed at the Converted MTSs requires an assessment of whether commercial waste deliveries would cause any traffic, off-site air quality or off-site noise impacts. The MTS Environmental Evaluation evaluated the potential for traffic, off-site air quality and off-site noise impacts based on waste delivery profiles for DSNY-managed Waste with a 20% contingency to allow for potential variations in waste deliveries. This section identifies where those analyses were also sufficient for purposes of assessing the impacts associated with the delivery of commercial waste, and where additional analyses were required to determine whether commercial waste deliveries would potentially cause unmitigatible significant adverse environmental impacts. To perform refined traffic, off-site air quality and noise analyses, it was necessary to identify likely locations where commercial waste might originate and be delivered to each Converted MTS and to develop potential routes for commercial waste vehicles to each Converted MTS. General commercial Waste Hauling Vehicle routes were developed by approach direction (north, south, east, or west). In some cases, more than one route per direction was identified as providing access to a Converted MTS. Waste Hauling Vehicle routes were identified to and from major highways and roadways in the vicinity of each Converted MTS, along local truck routes in the vicinity of each Converted MTS, and following the most direct route along local roads to a Converted MTS from the nearest truck route. As in the MTS Environmental Evaluation, it was assumed that commercial Waste Hauling Vehicles originating in different locations and delivering to the same Converted MTS will converge along routes in close proximity to the Converted MTS where access roads become limited. To establish the approximate numbers of commercial Waste Hauling Vehicles along routes to each Converted MTS, an assessment was performed of commercial waste-generating establishments by zip code. The information developed in Volume II on commercial waste generation was used to develop commercial waste tonnages for an average peak day by zip code. Zip code boundaries for the City were plotted on a map, and commercial waste from establishments within those zip codes was assigned to each Converted MTS based on the community district (CD) assignment used in the Converted MTS Environmental Evaluation. Commercial Waste Management Study 11 March 2004 Volume III Converted Marine Transfer Stations: Summary Report
30 Those zip codes that fell within multiple CDs assigned to multiple Converted MTSs were assigned to the Converted MTS in which a greater proportion of the zip code boundary was contained. Once zip codes were assigned to a Converted MTS, the corresponding tonnage associated with that zip code was also assigned to the same Converted MTS. It was assumed that excess commercial tonnage that could not be processed at a Converted MTS would be processed at a private facility. To analyze the full commercial capacity at each Converted MTS, additional zip codes were added to the wasteshed of a Converted MTS, until enough commercial waste would be delivered to the Converted MTS to fill the excess capacity. The additional zip codes were assigned based on geographic proximity to a Converted MTS and the commercial waste generated within a zip code. It was assumed that zip codes that generate greater volumes of commercial waste would be more likely to make up the difference between the excess capacity and allotted commercial tonnage. Once sufficient commercial tonnage had been allotted to each Converted MTS, the trucks delivering tonnage from each zip code assigned to the Converted MTS were assigned along an approach to the Converted MTS. After all zip codes and their corresponding tonnages had been assigned, percentages by approach direction were calculated for each Converted MTS. These percentages were used to distribute the commercial waste vehicles along the assumed truck routes for the time period between 8:00 p.m. and 8:00 a.m. Commercial waste vehicles were assigned hourly in this manner as no hourly breakdown of commercial waste deliveries was available. The distribution of commercial waste vehicles by direction was then used for traffic, off-site air and off-site noise analyses. 3.1 Traffic In the MTS Environmental Evaluation, traffic impacts were analyzed during background peak and facility-generated peak traffic hours using the appropriate CEQR-based methodologies. In evaluating the effect of additional commercial waste deliveries on traffic conditions, the analysis assumed that all remaining available capacity (i.e., the capacity not required to process DSNY-managed Waste) during the 8:00 p.m. to 8:00 a.m. period was used to process commercial waste. Commercial Waste Management Study 12 March 2004 Volume III Converted Marine Transfer Stations: Summary Report
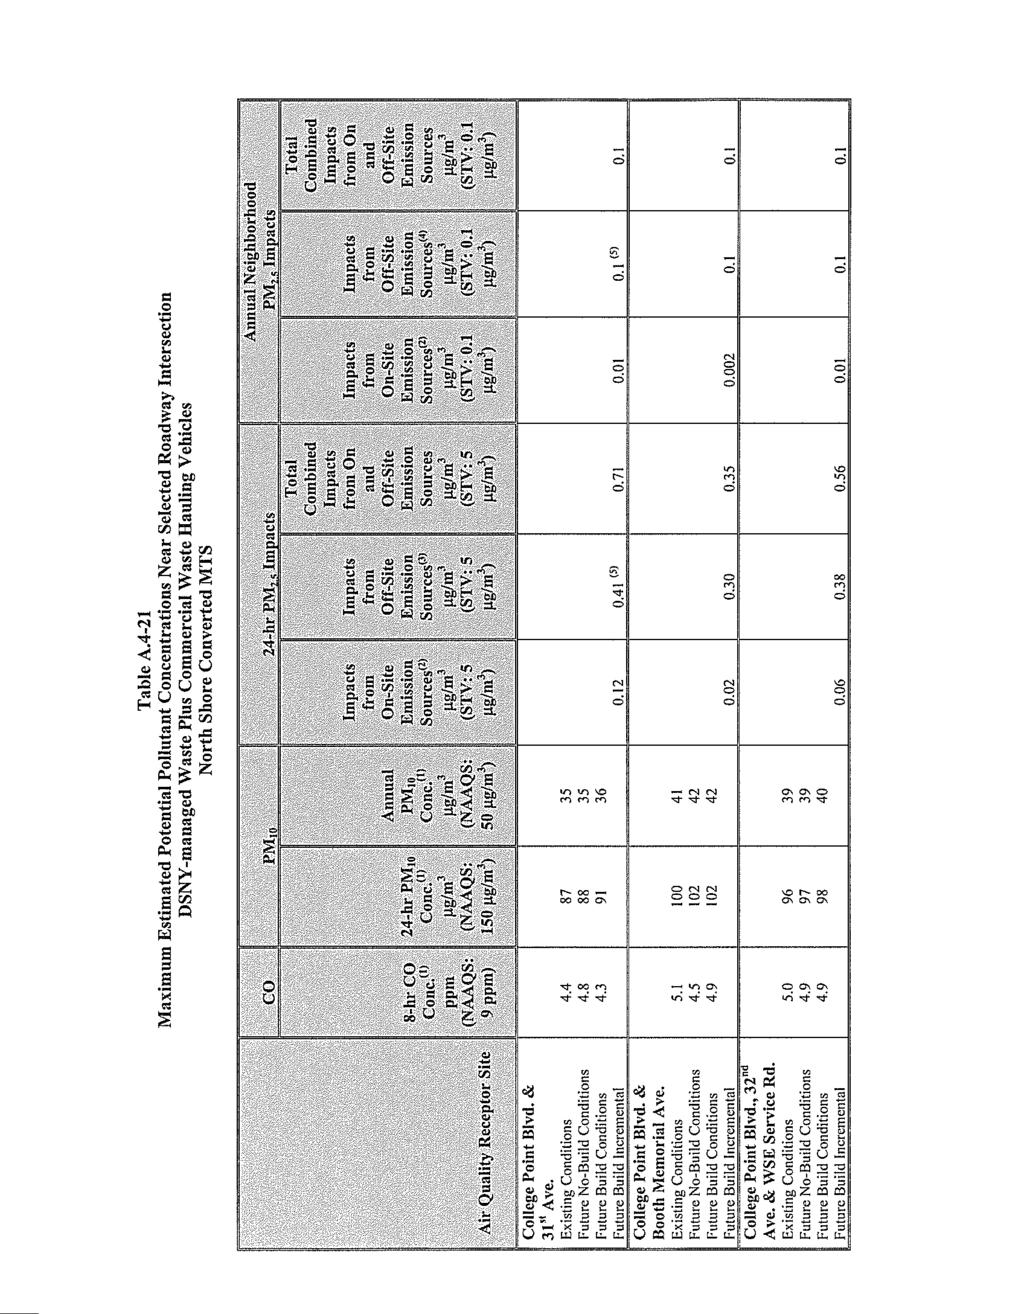
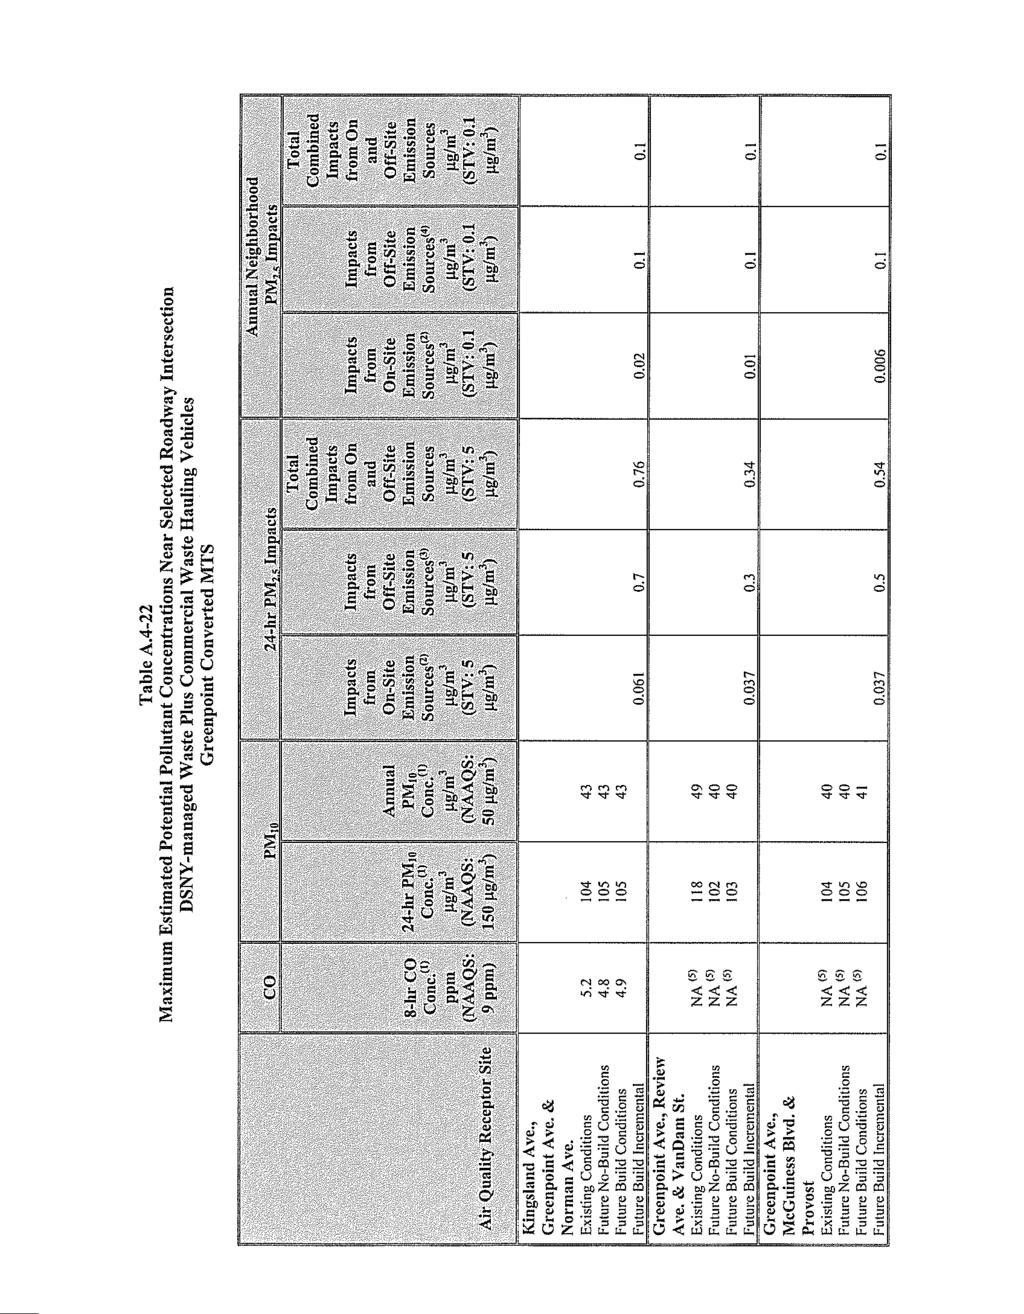
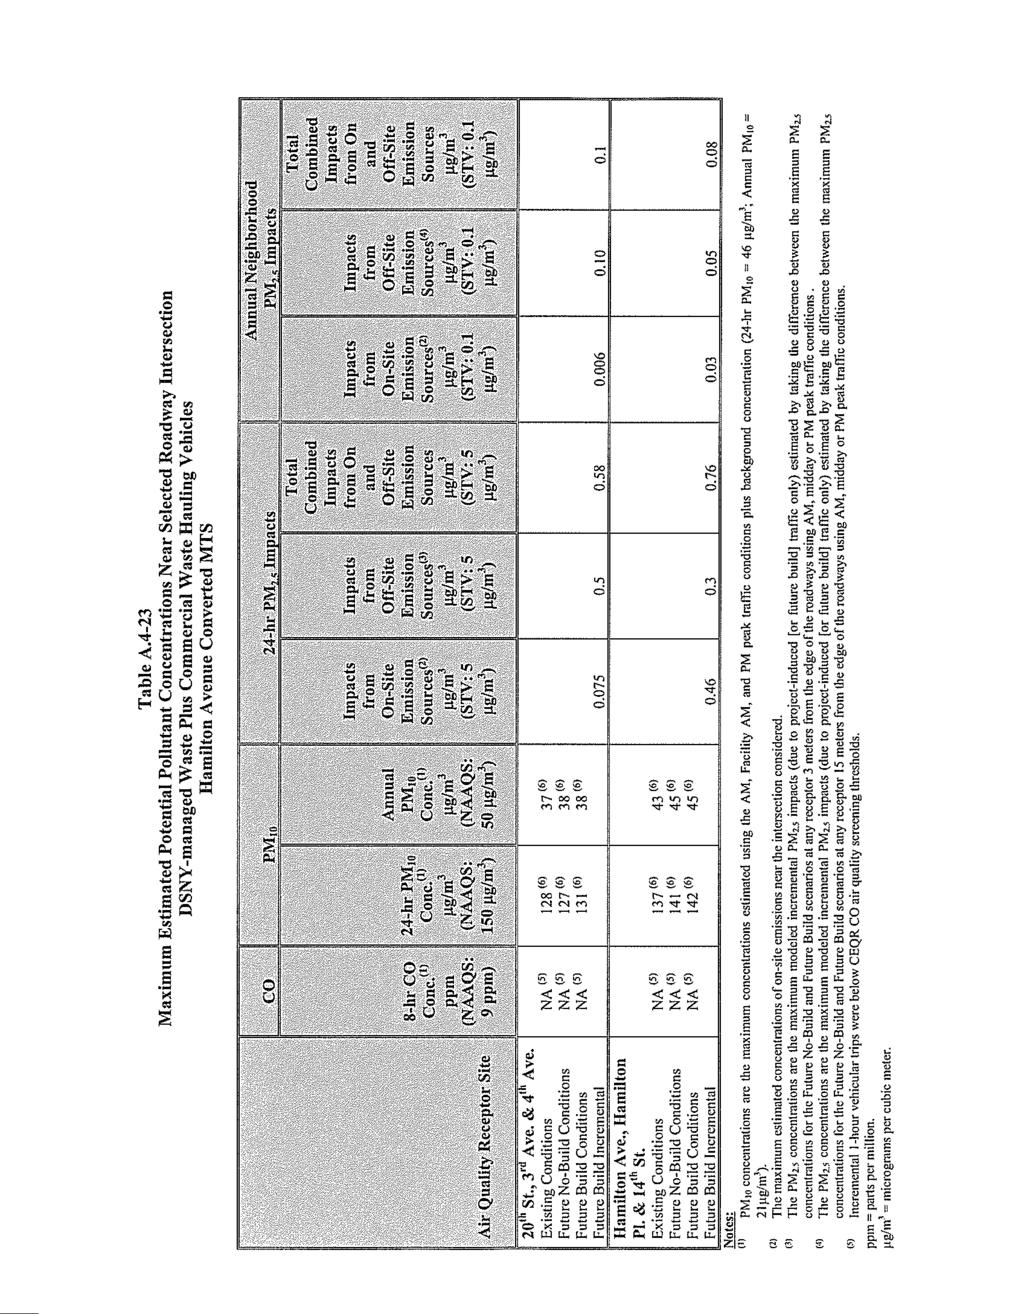
31 The results of the analysis show that peak hour assumptions for processing of DSNY-managed Waste had higher background traffic volumes, lower (poorer) levels of service and a higher number of collection vehicles than would apply to commercial waste deliveries during the 8:00 p.m. to 8:00 a.m. period. (See Section 9 of the individual MTS chapters in the MTS Environmental Evaluation for these analyses.) Peak hour truck arrival rates during the 8:00 p.m. to 8:00 a.m. period (commercial waste plus DSNY collection vehicles) are lower than the peak hour number of DSNY collection vehicles analyzed during the peak hours at all eight Converted MTSs. Table illustrates the number of peak hour DSNY collection vehicles evaluated for the MTS Environmental Evaluation and the potential range of peak hour vehicles during commercial waste delivery hours. The peak hour number of vehicles during commercial delivery hours represents both DSNY collection vehicles and commercial Waste Hauling Vehicles. Since the traffic analysis in the MTS Environmental Evaluation found no significant adverse unmitigatible traffic impacts, there would also be no significant adverse unmitigatible environmental traffic impacts related to processing commercial waste during a peak period between 8:00 p.m. and 8:00 a.m., when there are lower background traffic volumes, higher (better) levels of service and a lower number of collection vehicles. As noted in Section 1.1, for the eight MTSs, traffic signal timing adjustments would mitigate estimated traffic impacts identified at certain intersections related to delivery of DSNY-managed Waste. 3.2 Air Quality The off-site air quality analyses during the peak hours for processing DSNY-managed Waste at each Converted MTS were based upon higher background traffic volumes, lower (poorer) levels of service and a higher number of collection vehicles than would be the case for deliveries of commercial waste during the 8:00 p.m. to 8:00 a.m. period. (See Section 10 of the individual chapters in the MTS Environmental Evaluation for these analyses.) Commercial Waste Management Study 13 March 2004 Volume III Converted Marine Transfer Stations: Summary Report
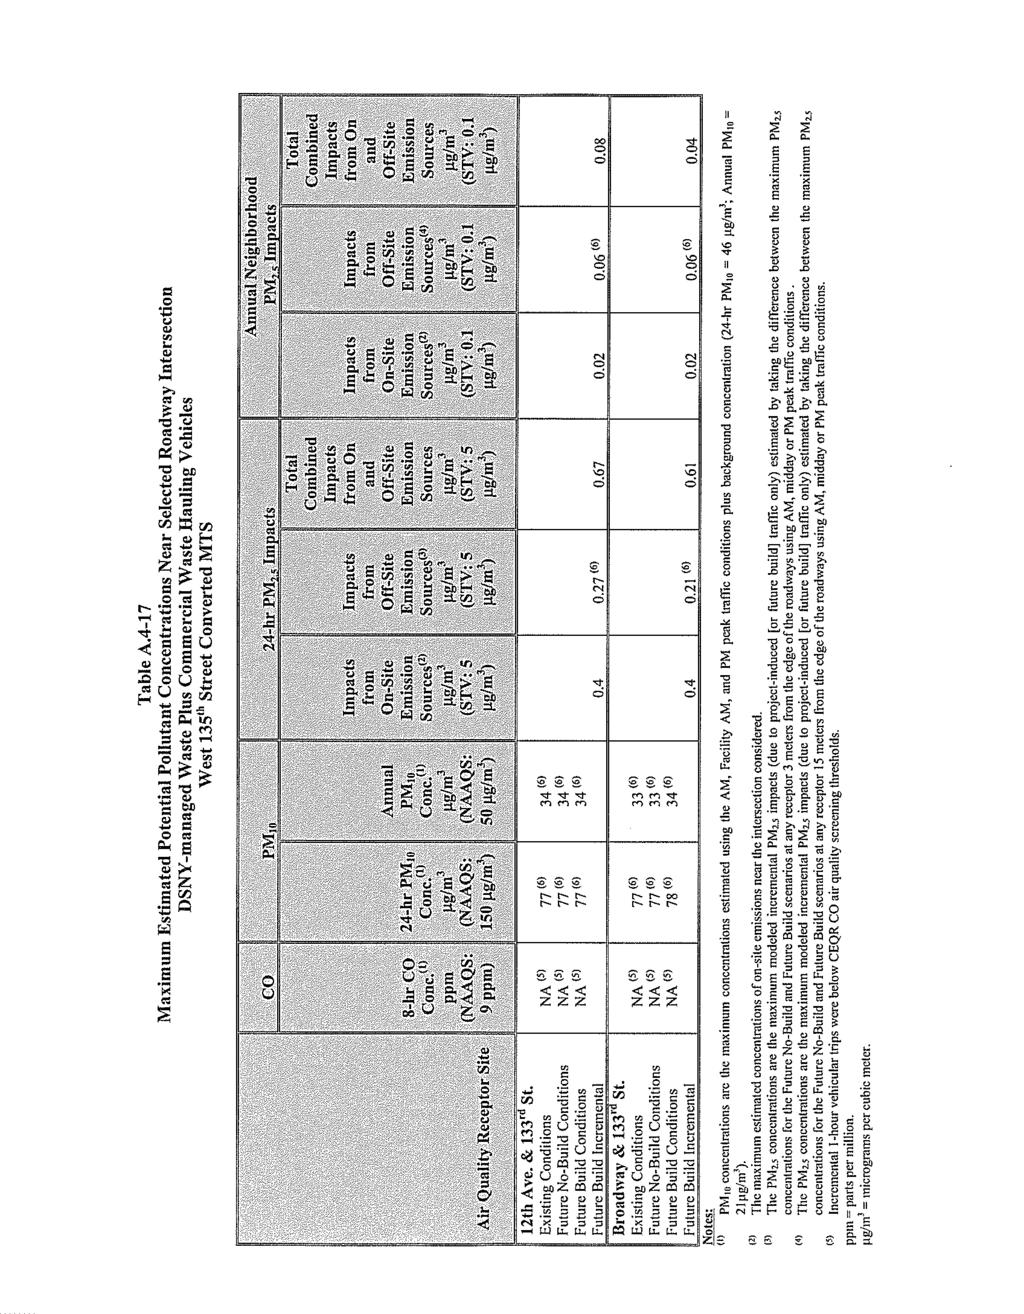
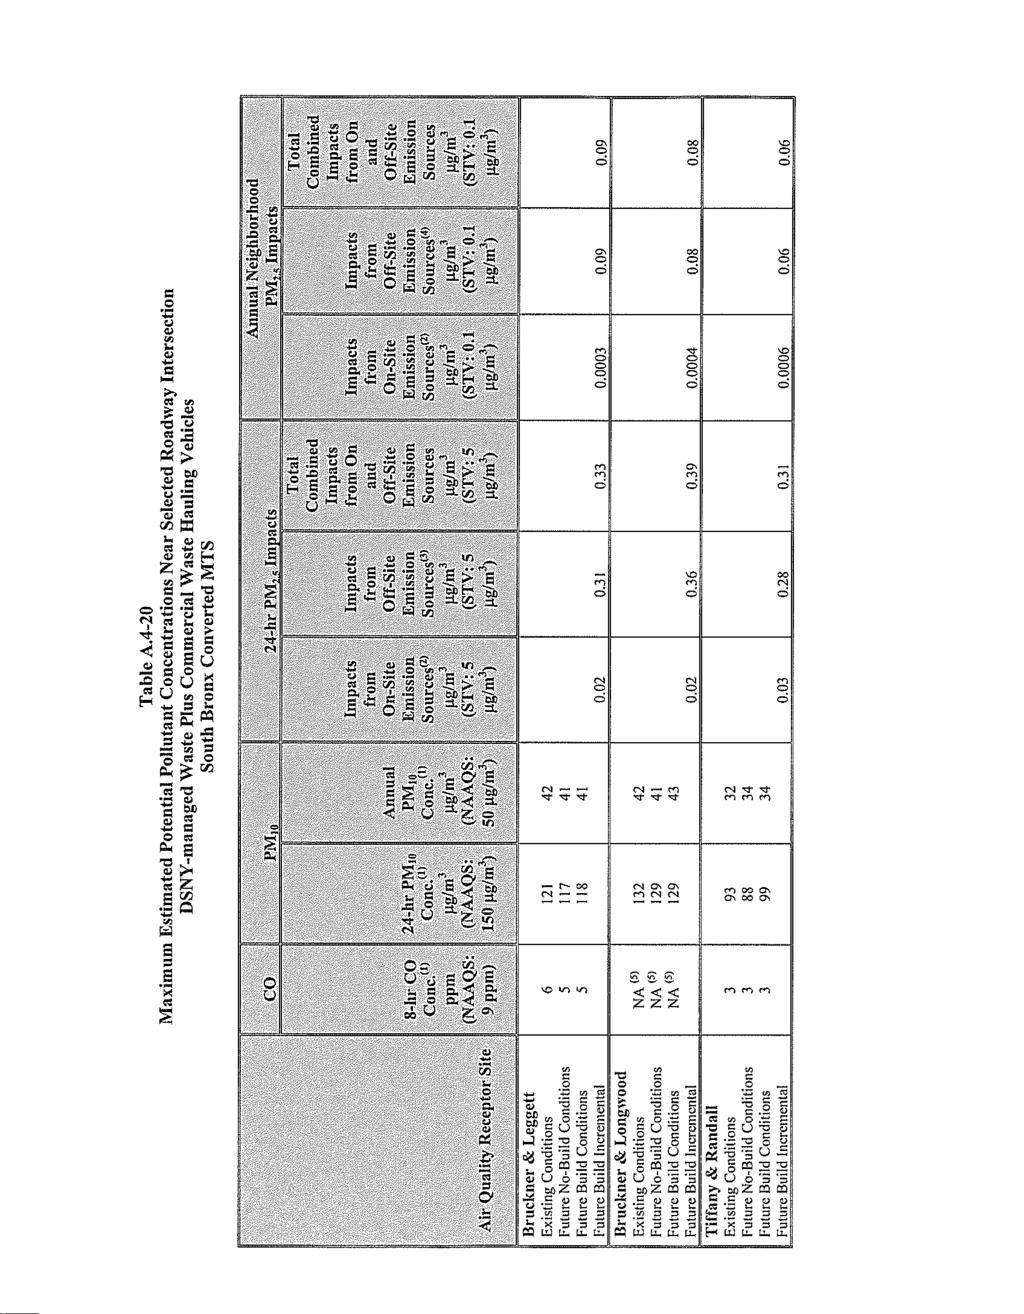
32 The peak hour conditions over 24 hours per day were conservatively assumed to occur under a Tier I 2 air quality analysis. Under these assumptions, there were no significant adverse unmitigatible environmental impacts. Therefore, there would also be no significant adverse unmitigatible air quality impacts related to processing commercial waste during an 8:00 p.m. to 8:00 a.m. peak period, when there are lower background traffic volumes, higher (better) levels of service and a lower number of collection vehicles. The off-site air quality analysis of processing DSNY-managed Waste at some of the Converted MTS sites showed that using the conservative assumption that peak hour conditions occur 24 hours per day under a Tier I analysis resulted in unmitigatible environmental impacts for particulate matter less than 10 microns in diameter (PM 10 ) and less than 2.5 microns in diameter (PM 2.5 ). (See Section 10 of the individual chapters in the MTS Environmental Evaluation for these analyses.) Therefore, a Tier II air quality analysis was performed at intersections near these Converted MTS sites that utilized actual hourly traffic volumes, including the higher number of collection vehicles used for deliveries of commercial waste to each Converted MTS during the 8:00 p.m. to 8:00 a.m. period, and there were no significant adverse unmitigatible environmental impacts. Tables in Attachment 4 provide more detailed information on the results of the off-site air quality analyses. 3.3 Noise In the MTS Environmental Evaluation, off-site noise impacts were screened over a 24-hour period at intersections where sensitive receptors exist near convergence points along truck routes to and from the Converted MTSs. If required, based on screening, noise analyses were conducted for the worst hour (the hour when the greatest difference in noise levels was expected) during daytime (7:00 a.m. to 10:00 p.m.) and nighttime (10:00 p.m. to 7:00 a.m.) hours. (See Section 3.14 in the MTS Environmental Evaluation for a detailed description of the off-site screening and analyses.) 2 The Tier I air quality analysis conservatively assumed that the peak hour traffic conditions occur 24 hours per day. Commercial Waste Management Study 14 March 2004 Volume III Converted Marine Transfer Stations: Summary Report
33 The screening analyses identified the potential for DSNY-managed Waste collection vehicles to double passenger car equivalents (PCEs) at two locations for the 91 st Street Converted MTS, two locations for the North Shore Converted MTS, one location for the Hamilton Avenue Converted MTS and one location for the Southwest Brooklyn Converted MTS, at various hours during the nighttime. Off-site noise analyses were conducted during the worst daytime and nighttime hours identified through the screening process at these six locations with the potential to double PCEs. The off-site noise analyses results indicate an impact at one access road to the 91 st Street Converted MTS, two locations on one access road to the North Shore Converted MTS and one access road to the Hamilton Avenue Converted MTS. Adjustments in the distribution of trucks and truck routes were made at these four locations. The screening, and, if required, the off-site noise analyses, were performed based on the adjusted lower levels of DSNY-managed Waste collection vehicles at these four locations. The results show that processing DSNY-managed Waste at any of the Converted MTSs would not cause any unmitigatible significant adverse off-site noise impacts. Results of the screening analyses and off-site noise analyses are provided in Sections 4.12 through of the MTS Environmental Evaluation. The off-site noise analysis of DSNY-managed Waste deliveries is not sufficient for purposes of assessing any impacts that would be associated with delivery of commercial waste. To determine if an adverse impact would be caused by the delivery of commercial waste, a screening level analysis was performed for each hour where additional truck volumes are estimated to determine if an off-site noise analysis would be required of commercial Waste Hauling Vehicle quantities and routes to and from the Converted MTSs Noise Impact Analysis of Commercial Waste Deliveries A sequence of analyses were performed to determine if an adverse noise impact would be caused by the delivery of commercial waste to the MTSs, utilizing the noise methodology for the off-site screening, monitoring and detailed analysis provided in Section 3.14 of the MTS Environmental Evaluation. Results of the second-level noise screening analyses limit the number of commercial Waste Hauling Vehicles that could be routed to the MTSs during various hours within the 8:00 p.m. to 8:00 a.m. period without causing potentially significant adverse impacts at sensitive Commercial Waste Management Study 15 March 2004 Volume III Converted Marine Transfer Stations: Summary Report
34 receptors. Although a Converted MTS may have available capacity to process commercial waste during the hours of 8:00 a.m. to 8:00 p.m., the potential for off-site noise impacts, based on second-level screening, limits the use of that available processing capacity. Noise-sensitive receptors were identified along the proposed commercial collection vehicle routes and existing traffic data were gathered for those locations. A first-level screening analysis (based on total traffic volumes and axle factors from the New York State Department of Transportation [NYSDOT]) and a second-level screening analysis (based on actual vehicle classification counts) were performed. The Future Build PCEs -- including DSNY-managed Waste collection vehicles, employee vehicles and commercial collection vehicles -- were compared to the Future No-Build PCEs for each hour during the 8:00 p.m. to 8:00 a.m. period, to determine if the proposed action would double PCEs and therefore cause a possible impact. Table summarizes the results of that analysis. Since these results are based on a second-level screening for noise impacts, a detailed off-site noise analysis, utilizing the Federal Highway Administration (FHWA) Traffic Noise Model (TNM) Version 2.1, is being performed to determine if noise impacts would actually occur at these sensitive-receptor locations and/or if additional potential commercial Waste Hauling Vehicles could be routed to the MTS during the 8:00 p.m. to 8:00 a.m. hour, without causing unmitigatible significant adverse off-site noise impacts, to fully utilize the potentially available capacity of the MTSs. The results of this off-site detailed noise analyses will be provided in the Solid Waste Management Plan (SWMP) Draft Environmental Impact Statement (DEIS). Tables in Attachment 5 provide more detailed information on the results of the second-level screening analysis, identifying the estimated range of commercial collection vehicles that can be routed through each of the roadways without causing an unmitigatible significant adverse off-site noise impact. (See Section of the MTS Environmental Evaluation for a detailed description of the second-level screening analysis.) Commercial Waste Management Study 16 March 2004 Volume III Converted Marine Transfer Stations: Summary Report
35 Table Converted MTS Potential Commercial Waste Capacities Summary Table Location Total Potential Commercial Vehicles (per day) Converted MTS Design Capacity Potential Commercial Waste Tonnage 8:00 p.m. to 8:00 a.m. (tons) DSNYmanaged Waste Delivered 8:00 p.m. to 8:00 a.m. (tons) Potential Converted MTS Capacity with Off-Site Noise Constraints Total Potential Commercial Vehicles (per day) Potential Commercial Waste Tonnage 8:00 p.m. to 8:00 a.m. (tons) West 135 th Street 175 1, ,029 East 91 st Street (1) 199 2, West 59 th Street (2) South Bronx (1) 163 1, ,611 North Shore (3) 95 1, ,000 Greenpoint (1) 109 1, ,145 Hamilton Avenue (1) 129 1, ,306 Southwest Brooklyn (4) 162 1, Total 1,123 11,931 3, ,656 Notes: (1) Need to use different routes for potential commercial Waste Hauling Vehicles to deliver the full amount of potential excess capacity for commercial waste. (2) Can take all potential commercial Waste Hauling Vehicles without any noise constraints. (3) There is a route to the North Shore Converted MTS that does not pass sensitive receptors that must be used from 12:00 a.m. to 6:00 a.m. to deliver the full amount available for commercial capacity. The route should not be used at other times upon request from the City Department of Transportation (NYCDOT) due to congestion that occurs at certain intersections along the route during daytime traffic hours. (4) Outbound trucks passing 26 th Street between Cropsey Avenue and Shore Road limit the number of inbound commercial Waste Hauling Vehicles that can be accommodated at the Southwest Brooklyn Converted MTS. Commercial Waste Management Study 17 March 2004 Volume III Converted Marine Transfer Stations: Summary Report
36 ATTACHMENT 1 FULL CAPACITY ANALYSIS FOR EACH CONVERTED MTS HOURLY RESULTS OF MODELING
37
38
39
40
41
42
43
44
45 ATTACHMENT 2 ASSUMED COMMERCIAL WASTE VEHICLE TRUCK ROUTES
46
47
48
49
50
51
52
53
54 ATTACHMENT 3 COMMERCIAL WASTE VEHICLE ALLOCATION BY APPROACH DIRECTION
55
56
57
58
59
60
61
62
63
64
65
66
67
68
69
70
71
72
73
74
75
76
77
78
79
80
81
82
83
84
85
86
87
88
89
90
91
92