Basics of the European Gas Market
|
|
|
- Antonia Francis
- 5 years ago
- Views:
Transcription

1 Winter Academy February 2018 Trading, Sales and Financing in the European Energy Market and Industry Basics of the European Gas Market Eva Hennig, Thüga Winter Academy Feb 2018 Brussels 1
2 Agenda Who is Thüga Gas Infrastructure Legal Framework Gas Application Gas Prices Role of renewable Gas Winter Academy Feb 2018 Brussels 2


3 The Thüga Group constitutes the largest alliance of municipal utilities Born 150 years ago with the company philosophy of minority shares in ~ 100 companies in the energy sector Turnover 19.0 billion Gas sales billion kwh Heating sales 9.0 billion kwh Investments 1.0 billion Electricity sales 49.8 billion kwh Gas customers 2.0 million Water sales billion m³ Electricity customers 4.0 million Employees 17,200 Heating customers 0.1 million Water customers 0.9 million Winter Academy Feb 2018 Brussels 3

4 Overview over the Gas Market in Europe Winter Academy Feb 2018 Brussels Source: Eurogas 4

5 Existing infrastructure is a very precious assets 2,2 Mio. km of pipes and TWh storage capacity is a lot of infrastructure Gas is produced in Europe or travels from various regions of the world to Europe per pipeline or ship. In the future renewable and decarbonized gas in addition will be produced in Europe. Winter Academy Feb 2018 Brussels Source: GIE 5

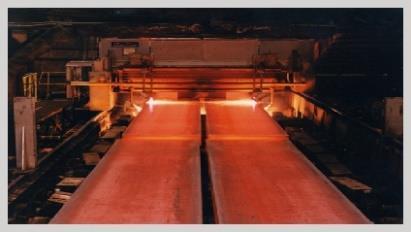
6 In less than 50 years the transport gas system has been developed After Groningen was discovered the TSO grids began to grow the connection to Russia was built and in 1977 the first offshore pipes to Norway Winter Academy Feb 2018 Brussels Source: GIE 6

7 Imports from Norway have seen a very strong increase of the last 20 a Gas Import into EU 28 from external in TWh And LNG adds to diversification Russia Norway Algeria Qatar Libya others Winter Academy Feb 2018 Brussels Source: EC Stat. Pocketbook


8 3.730 TWh LNG were produced in the world 4 countries in the EU imported in 2016 relevant volumes, but due to new ports and a growing market for ship fuel these numbers will increase Winter Academy Feb 2018 Brussels Source: IGU World LNG Report

9 At important crossroads storages exist with 1065 TWh working gas Salt caverns: created with freshwater injection into underground salt deposits and afterwards pumped onto the earth's surface. The emerging holes are similar to underground tanks and can be filled with natural gas. Salt caverns can be found mainly in middle and north Germany. Aquifers are - like depleted fields - underground porous, permeable rock formations but filled with water and not with gas or oil Winter Academy Feb 2018 Brussels Source: GSE Storage Map 9

10 The working gas in the storages follow the seasonal patterns Winter Academy Feb 2018 Brussels Source: GSE Storage data 10

11 In Spring 17 the maximum of GWh/day withdrawl was reached Max. withdrawl of GWh/day divided by 24 hours flat = minimum of 417 GW Comparison: all power plants in EU GW installed capacity Winter Academy Feb 2018 Brussels Source: GSE Storage data 11
12 All underground storages are usable for SNG. Hydrogen has to be tested. Many innovative storage technologies are discovered each month, but the capacity, time scale and extensiveness make the gas grid the largest storage available Winter Academy Feb 2018 Brussels Source:ITM Power 12
13 Legal Framework and stakeholders Winter Academy Feb 2018 Brussels 13


14 Continuous adaptation of rules keeps energy people on their toes A regulation for the future Data communication, DSO entity, sector coupling, Governance, use of flexibility Clean energy package Network Codes I Marketdesign internal market, grid acces rules, balancing, capacity allocation, congestion management Smart World Interoperability between everyone and everything, TSO-DSO relations, data Network Codes II, Cyber safety, Roadmap Vision 2020 The costumer Decentralized production, free choice, good service, active in the market, the internet of things Decarbonisation Valid for all sectors, Winter Academy Feb 2018 Brussels 14

15 We have come a long way from the first gasdirective in 1998 With 800 suppliers in gas and electricity Germany is unique in the world regarding competition on the retail market Winter Academy Feb 2018 Brussels 15
16 Legal environment for Gas in 2018 The gas sector in embedded in many prominent directives and regulations: 5 Network Codes on Capacity, Congestion, TSO Tariffs, Balancing, Interoperability GasReg+GasDir Consumer Rights+Data Security EPBD+EED Governance RED I/II + ETS State aid REMIT, MIFID SOSReg Renewables Horizon 2020 Energy Efficiency, Building, smart metering Gasdirective- and regulation, Networkcodes SOS-Security of Supply, Governance Customer relation, data security, dispute resolution Winter Academy Feb 2018 Brussels 16
17 Network Codes and Guidelines are the backbone of EU regulation The creation of the network codes was foreseen in the gasregulation of In particular, increased cooperation and coordination among transmission system operators is required to create network codes for providing and managing effective and transparent access to the transmission networks across borders, and to ensure coordinated and sufficiently forward looking planning and sound technical evolution of the transmission system in the Community, including the creation of interconnection capacities, with due regard to the environment. Guidelines on Congestion Management Procedures, Commission Decision (EU) 2012/490 Network Code on Capacity Allocation Mechanisms, Commission Regulation (EU) 2013/984 Network Code on Gas Balancing of Transmission Networks, Commission Regulation (EU) 2014/312 Network Code on Harmonised Transmission Tariff Structures for Gas, Commission Regulation (EU) 2017/460 Network Code on Interoperability and Data Exchange Rules, Commission Regulation (EU) 2015/703 Chapter 3 of Annex 1 to Regulation (EC) No 715/2009 (Transparency Annex) Winter Academy Feb 2018 Brussels 17
18 Stakeholders are linked through regulation, contracts and processes Stakeholders are connected through contracts, processes, dataflows Meter operator Interactions are diverse in the countries as they depend on many national laws But, the main objective should always be the customers, for her/him all stakeholders are doing all this Supplier Shipper Consumer Gas Producer DSO TSO 18


19 The wide range of various gasutilization Winter Academy Feb 2018 Brussels 19
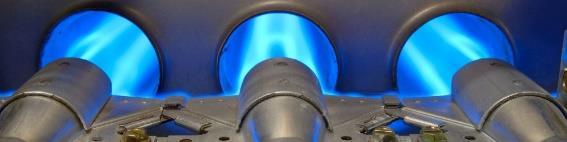
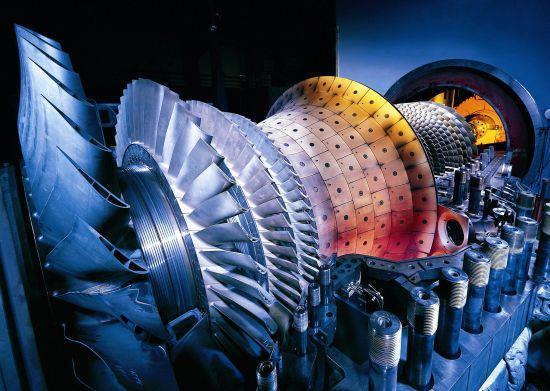
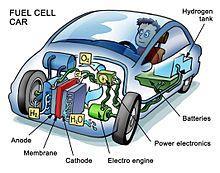
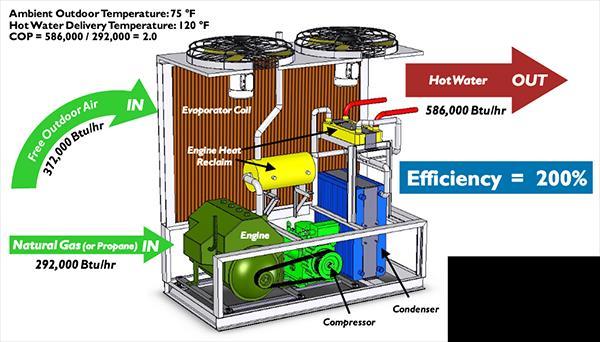
20 There are many different ways to use gas Condensing boiler Gas heat pump CHP Industrial + commercial applications Gas BBQ + Cooking Hybrid Heating Gasturbines and motors Fuel Cells Passenger Cars Trucks and busses Ships.... Winter Academy Feb 2018 Brussels 20


21 Final energy consumption Mtoe The final EU end energy consumption is still dominated by oilproducts ~2750 TWh Winter Academy Feb 2018 Brussels Source: EC Stat. Pocketbook

22 Gas utilization is especially high in heating and industrial usage average usage in 2015: 41 % Residential+Commercial 33 % Industrial 23 % Power Plants <1 % Transport 2 % others Winter Academy Feb 2018 Brussels Source: EC Stat. Pocketbook
 Gas demand (15,000 KWh per annum) Source: Thuga Winter Academy Feb 2018")
23 Delivered Capacity in kwh/h Especially in winter a gas heating needs a lot of capacity A Typical German Household Electricity demand (3,000 KWh per annum) Gas demand (15,000 KWh per annum) Source: Thuga Winter Academy Feb 2018 Brussels 23

24 The gross inland consumption differs greatly between the member states Winter Academy Feb 2018 Brussels Source: EC Stat. Pocketbook

25 Gas prices Winter Academy Feb 2018 Brussels 25
26 The prices at the Gas hubs in Europe have aligned over the years European markets US - Market Winter Academy Feb 2018 Brussels 26
27 Gas prices vary between the MS and years Gas prices for end consumers are comprised of wholesale prices, transportation and distribution grid fees and taxes and levies. In Germany for example taxes and levies account for 53 % of price in Winter Academy Feb 2018 Brussels Source: Eurostat 27

28 In the future renewable and decarbonized gas will come to the grid Winter Academy Feb 2018 Brussels Source Gas Naturally 28

29 Final Energy consumption Mtoe And the transport sector has long bypassed the industrial consumption Winter Academy Feb 2018 Brussels Source: EC Stat. Pocketbook


: CO2 is added to hydrogen in a process")
30 There are several ways to produce renewable and decarbonized gases Fermentation: fermentation of biomass through bacteria similar to those in cow stomach. Feedstocks: agricultural substrates such as liquid or stable manure, energy crops, organic wastes e.g. cut grass, waste food, by-products of the food industry.. Gasification: conversion of organic carbonaceous materials into CO, H2 and CO2 at temperatures >700 C. Feedstock: biomasses, wood chips, waste wood, plastics, municipal/agricultural and industrial wastes, sewage sludge, switch grass, crop residues Biomethane: cleaning and upgrading of biogas to inject it into the grid Power-to-Gas: Hydrogen produced in an electrolysis with renewable electricity SNG (synthetic natural gas): CO2 is added to hydrogen in a process called methanization. Decarbonized gas: Natural gas+o2+water react with the help of a catalyst and heat to H2, CO2 and water. Winter Academy Feb 2018 Brussels 30

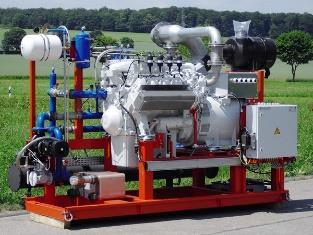
 WindGas Hamburg Reitbrook 1,5 MW e")

31 RES-Gas adds to the diversification and help security of supply Ameland 8 kw e Assess impacts of injecting H2 into a local network Main objectives of the demonstrators / pilots: Test performance and viability of technologies in real condition Build a return on experience, work on business model Study impact of H2 injection on network infra and/or end-user equipments Compare different valuation options of H2 (technically and economically) Rozenburg 8 kw e Test P2G and methanation, assess global performance of this injection chain BioCat 1 MW e Prove technical performance of biocatalytic process at industrial scale Ibbenbüren 150 kw e Build technical and economical return on experience (improved performance, cost reduction, business model) WindGas Hamburg Reitbrook 1,5 MW e Demonstrate high performance of electrolysis at industrial scale GRHYD 90 kw e Study technical feasibility of H2 injection into the distribution grid and work on business models Frankfurt am Main 320 kw e Study impact of intermittency on network functionning Renovagas 15 kw e Prove that quality of gas produced is suitable to be directly injected in the natural gas network Energiepark Mainz 6 Mw e Assess technical feasibility and economical value brought by different uses of P2G Jupiter MWe Test performance of two electrolysis technologies, direct injection and methanation WindGas Falkenhagen 2 MW e Build a return on experience of injection into the gas grid with a large scale project BioPower2Gas 300 kw e Prove technical performance of biocatalytic process at demonstration scale and analyze different valuation options for H 2 INGRID / STORE&GO 1 MW e Built a return on experience of H2 solid storage and of methanation with CO2 absorption from atmosphere 4 Winter Academy Feb 2018 Brussels 31
32 Batteries improve fast, but seasonal storage is another league Many innovative storage technologies are discovered each month, but the capacity, time scale and extensiveness make the gas grid the largest storage available Winter Academy Feb 2018 Brussels 32
. Result: a dual world gas + electricity is cheaper and reduces the CO2 faster.")
33 Primes simulated the development of renewable gas until % PRIMES assumptions are on the price of technology and cost of production. The scenario is based on a limited role of nuclear energy on the long-term (baseload provision). Result: a dual world gas + electricity is cheaper and reduces the CO2 faster. Winter Academy Feb 2018 Brussels Source:Primes Scenario for Eurogas,
34 Thank you for your attention! Winter Academy Feb 2018 Brussels 34
35 Contact: Eva Hennig Thüga Aktiengesellschaft Munich Tel Mail Winter Academy Feb 2018 Brussels 35

36 Winter Academy Feb 2018 Brussels 36

37 Good examples in the EU Winter Academy Feb 2018 Brussels 37