WaterNSW Water Operations Report. Murray-Lower Darling November 2017
|
|
|
- Sheryl Lang
- 5 years ago
- Views:
Transcription


1 WaterNSW Water Operations Report Murray-Lower Darling
2 110% 100% Dam Storages Dartmouth Dam Storage 2013/ / / / /18 90% 80% 70% 60% 50% 40% 30% 20% 10% 0% Jul Aug Sept Oct Nov Dec Jan Feb Mar Apr May Jun 2
3 Dam Storages 110% Hume Dam Storage 2013/ / / / /18 100% 90% 80% 70% 60% 50% 40% 30% 20% 10% 0% Jul Aug Sept Oct Nov Dec Jan Feb Mar Apr May Jun 3
4 Dam Storages 110% Lake Victoria Storage 2013/ / / / /18 100% 90% 80% 70% 60% 50% 40% 30% 20% 10% 0% Jul Aug Sept Oct Nov Dec Jan Feb Mar Apr May Jun 4
5 Dam Storages 120% Menindee Lakes Storage 2013/ / / / /18 110% 100% 90% 80% 70% 60% 50% 40% 30% 20% 10% 0% Jul Aug Sept Oct Nov Dec Jan Feb Mar Apr May Jun 5
6 Supplementary Access No supplementary events in the Murray or Lower Darling since the start of 2017/18. 6
7 2017/18 Water Availability NSW Murray Licence Category Sum of Share Component Sum of Account Balance Sum of AWD Volume Sum of Carryover In Sum of Allocation Assignments In Sum of Allocation Assignments Out DOMESTIC AND STOCK 13,756 8,990 13, ,758 DOMESTIC AND STOCK [DOMESTIC] 1,247 1,083 1, DOMESTIC AND STOCK [STOCK] 2,068 1,750 2, LOCAL WATER UTILITY 33,497 27,510 33, , REGULATED RIVER (CONVEYANCE) 330,000 79, ,847-54, ,183 20,093 REGULATED RIVER (GENERAL SECURITY) 1,673, , , , , , ,191 REGULATED RIVER (HIGH SECURITY) 189, , ,017-40,718 30,932 85,836 REGULATED RIVER (HIGH SECURITY) [COMMUNITY AND EDUCATION] REGULATED RIVER (HIGH SECURITY) [RESEARCH] REGULATED RIVER (HIGH SECURITY) [TOWN WATER SUPPLY] 3,195 3,195 3, SUPPLEMENTARY WATER 252, , , TOTAL 2,500,756 1,368,072 1,286, , , , ,680 General Security Available Water Determination Date AWD ML/Share Total % 1-Jul % 17-Jul % 1-Sep % 15-Sep % 3-Oct % 16-Oct % 1-Nov % 15-Nov % Sum of Usage Of the total use, 145 GL is use from environmental licences this does not include any e-water use on private landholdings. In addition the Murray Additional Allowance 5,812 ML has been delivered in July 2017 Data as at 24. 7
8 2017/18 Water Availability Lower Darling Licence Category Sum of Share Component Sum of Account Balance Sum of AWD Volume Sum of Carryover In Sum of Allocation Assignments In Sum of Allocation Assignments Out Sum of Usage DOMESTIC AND STOCK DOMESTIC AND STOCK [DOMESTIC] DOMESTIC AND STOCK [STOCK] LOCAL WATER UTILITY 10,135 7,900 10, ,235 REGULATED RIVER (GENERAL SECURITY) 79,507 58,659 79,507 65,997 87, ,832 38,175 REGULATED RIVER (HIGH SECURITY) 7,771 2,256 7, , SUPPLEMENTARY WATER 250, , , TOTAL 348, , ,784 65,997 88, ,624 41,332 General Security Available Water Determination Date AWD ML/Share Total % 1-Jul % Of the total use, 17.2 GL is use from environmental licences. Data 24. 8

9 2017/18 Water Availability NSW Murray 9
10 Resource Assessment NSW Murray Resource Distribution for /11/ /11/ /10/ /09/2017 Total Available Resource ,980 1,740 1,540 Less Carryover Rules based Environmental Water Essential Supplies (Towns, Stock, Domestic) Announced High Security subcategory (education, research) AWD Announced High Secutrity AWD Conveyance Reserves Announced General Security AWD Surplus / Shortfall
11 IVT Account 11
12 IVT Account 12

13 6 Month Rainfall 13

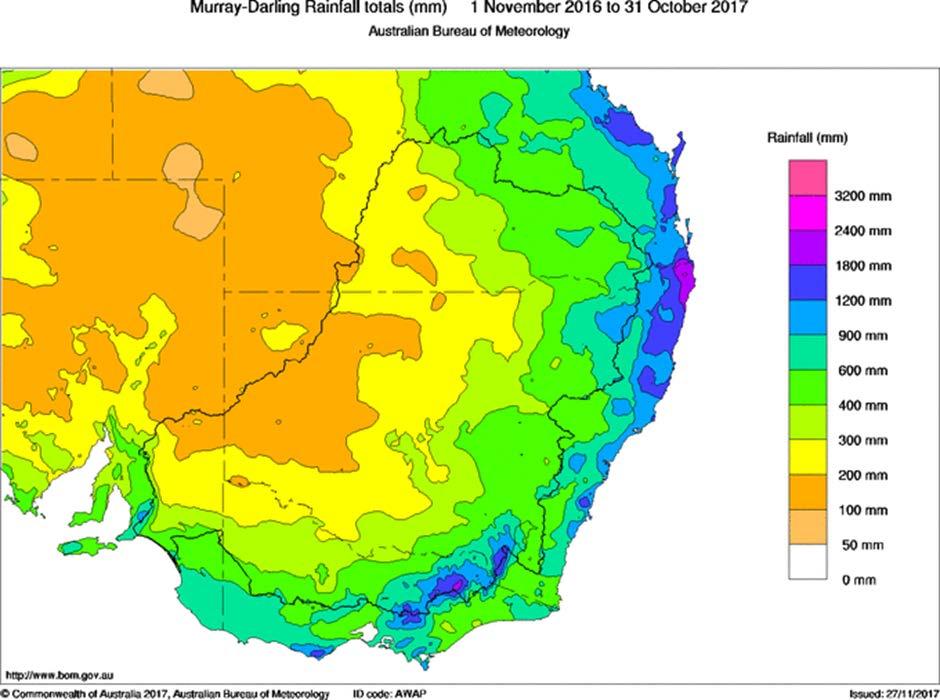
14 12 Month Rainfall 14
15 Inflow Volume (GL) Storage Inflows Dartmouth Dam - 6 month inflows/statistical inflows 99 percentile 75 percentile 50 percentile 25 percentile Actual Inflow 0 May-17 Jun-17 Jul-17 Aug-17 Sep-17 Oct-17 Inflows are consistent with rainfall over the past 12 month period. Actual inflow for the 12 months is 602GL equal to 75 th percentile (603GL): while the minimum is 166GL. Inflow Volume (GL) Inflows are consistent with rainfall over the past 6 month period. Actual inflow for the 6 months is 382GL just above the 90 th percentile inflows (340GL): while the minimum is 119GL. 0 Dartmouth Dam - 12 month inflows/statistical inflows 99 percentile 75 percentile 50 percentile 25 percentile Actual Inflow 15
16 Storage Inflows Hume Dam - 6 month inflows/statistical inflows Inflow Volume (GL) percentile 75 percentile 50 percentile 25 percentile Actual Inflow May-17 Jun-17 Jul-17 Aug-17 Sep-17 Oct-17 Inflows are consistent with rainfall over the past 6 month period. Actual inflow for the 6 months is 888GL just above the 90 th percentile inflows (741GL): while the minimum is 105GL. Inflows are consistent with rainfall over the past 12 month period. Actual inflow for the 12 months is 1,481GL just below 75 th percentile (1,530GL): while the minimum is 124GL. Inflow Volume (GL) Hume Dam - 12 month inflows/statistical inflows 99 percentile 75 percentile 50 percentile 25 percentile Actual Inflow 16
17 Storage Inflows Inflow Volume (GL) Menindee Lakes - 6 month inflows/statistical inflows 99 percentile 75 percentile 50 percentile 25 percentile Actual Inflow Inflows have been very low over the past 6 months. Actual inflow for the 6 months is 61GL; the minimum is 0GL, while the 50 th percentile is 379GL. 0 May-17 Jun-17 Jul-17 Aug-17 Sep-17 Oct-17 Inflows over the past 12 month period are influenced by Nov Dec 2016 inflows from the wet 2016 Spring in central NSW. Actual inflow for the 12 months is 1,006GL just above 50 th percentile (797GL): while the minimum is 0GL. Inflow Volume (GL) Menindee Lakes - 12 month inflows/statistical inflows 99 percentile 75 percentile 50 percentile 25 percentile Actual Inflow 17
18 Inflow Volume (GL) Tributary Inflows Total Tribs - 6 month inflows/statistical inflows 99 percentile 75 percentile 50 percentile 25 percentile Actual Inflow 0 May-17 Jun-17 Jul-17 Aug-17 Sep-17 Oct-17 Inflows are consistent with rainfall over the past 12 month period. Actual inflow for the 12 months is 4,322GL equal to 50 th percentile (4,223GL): while the minimum is 575GL. Inflow Volume (GL) Inflows are consistent with rainfall over the past 6 month period. Actual inflow for the 6 months is 1,900GL just above the 75 th percentile inflows (1,699GL): while the minimum is 398GL Total Tribs - 12 month inflows/statistical inflows 99 percentile 75 percentile 50 percentile 25 percentile Actual Inflow 18
19 Storage Forecast 110% Dartmouth Dam - Forecast Storage Capacity 100% 90% 80% Storage Capacity (%) 70% 60% 50% 40% 30% 20% 10% Actual Extreme dry scenario (99%) Dry scenario (90%) Near average scenario (50%) Wet scenario (25%) 0% 01-Jul Oct Jan Apr Jul Oct Jan Apr Jul Oct Jan Apr-18 19
20 Storage Forecast Storage Capacity (%) 110% 100% 90% 80% 70% 60% 50% 40% 30% Actual Extreme dry scenario (99%) Dry scenario (90%) Near average scenario (50%) Wet scenario (25%) Hume Dam - Forecast Storage Capacity 20% 10% 0% 01-Jul Oct Jan Apr Jul Oct Jan Apr Jul Oct Jan Apr-18 20
21 Storage Forecast 110% Lake Victoria - Forecast Storage Capacity 100% 90% Storage Capacity (%) 80% 70% 60% 50% 40% 30% 20% Actual Extreme dry scenario (99%) Dry scenario (90%) 10% 0% Near average scenario (50%) 01-Jul Oct Jan Apr Jul Oct Jan Apr Jul Oct Jan Apr
22 Storage Forecast Storage Capacity (%) 120% 110% 100% 90% 80% 70% 60% 50% 40% 30% 20% 10% Actual Extreme dry scenario (99%) Dry scenario (90%) Menindee Lakes - Forecast Storage Capacity Near average scenario (50%) Wet scenario (25%) 0% 01-Jul Oct Jan Apr Jul Oct Jan Apr Jul Oct Jan Apr
23 System Outage Plan Dam maintenance impacting supply Planned outage none. Weirs Planned outage Stevens Weir Winter Regulators Planned outage none.
24 System Operations Plan Murray E-water delivery to Barmah Millewa coming to an end. Standard summer operations planned. Lake Victoria approaching FSL reducing risk of a system shortfall. Short term shortfalls remain a risk to be managed through standard operating practices. Use of Goulburn IVT will be an important tool. Lower Darling Storage approaching 480 GL Releases restricted to 700 ML/day at Weir 32 to provide fish outcomes Releases from Cawndilla being made to meet irrigation demands Management of release at Weir 32 post 480 GL is subject to approval of an operations plan 24
 (90% inflows: 90 chances in 100) (75% inflows: 75 chances in 100) (50% inflows: 50 chances in 100) (25% inflows: 25 chances in 100) NSW Murray General Security")
25 Prognosis Chances Of Improvement The chances of improved General Security allocation, based on different inflow scenarios are as follows: Potential Inflow Conditions Extreme Dry Very Dry Dry Average Wet (99% inflows: 99 chances in 100) (90% inflows: 90 chances in 100) (75% inflows: 75 chances in 100) (50% inflows: 50 chances in 100) (25% inflows: 25 chances in 100) NSW Murray General Security AWD (%) 1-Dec-17 1-Feb