Urban Solar Rooftop Utility Feasibility Study for City of Vancouver
|
|
|
- Rosalind Underwood
- 5 years ago
- Views:
Transcription

1 Urban Solar Rooftop Utility Feasibility Study for City of Vancouver Prepared by: M.K. Anand, UBC Greenest City Scholar, 2018 Prepared for: Nicole Chan, Junior Engineer, Neighborhood Energy Utility, Engineering Services August, 2018
2 Acknowledgements The author would like to thank the following individuals for their contribution, feedback, and support throughout this project. City of Vancouver: Nicole Chan, Ashley St. Clair, Chris Barber, Sean Pander, Ian Neville, Craig Edwards. Terratek Inc., Penfolds Inc., Rikur Energy, BC Hydro, University of British Columbia City of New Westminster
3 Contents Executive Summary 1 Introduction 4 Solar Technology 5 Solar prices and viability 6 Project Scope 6 Project Methodology 7 Independent Electricity Generation in British Columbia 8 BC Hydro agreements 8 Electricity resale in British Columbia 9 Ownership Models 9 Option 1: City-owned Roof Model 10 Option 2: Third Party Roofs 11 Option 3: University of British Columbia Partnership 12 Technical Feasibility 13 Financial Analysis for Ownership Models 16 Option 1: City-owned Roofs 16 Option 2: Third Party Roofs 18 Option 3: UBC Partnership 19 Summary of financial analysis and recommendations 21 Lessons learned from installed examples 22 New Westminster 22 PV Feasibility Study for Sample location 23 Possible locations for Solar farms 27 Community partners 28 Conclusion and Recommendations 28 References 30 Appendix A Sample RetScreen Financial Model (City Owned Ownership Model, Scenario C) 32 Appendix B Major learnings from suppliers 37 Appendix C- Roof Structural considerations 39 APPENDIX D BC Hydro Historical Price Escalation Rates 45
4 Executive Summary Vancouver has a goal to have zero emission new buildings by 2030 [1] and for 100% of the city s energy to come from renewable energy by 2050 [2], as per the Renewable City Strategy. To support these goals, the city is exploring solar energy generation on underutilized rooftop spaces and business models that would make this possible. This report investigates administrative and legal structures of successfully operating rooftop solar utilities and co-operatives, including ownership models and rate structures. It also provides options for models that could be implemented in Vancouver under the umbrella of a City-owned solar energy utility, including the identification of business drivers, administrative and legal limitations, incentives, and exceptions that could benefit the City. This report also explores the options the City has for partnerships with BC Hydro and the University of British Columbia for establishing a Solar Energy utility. A technical and financial feasibility study was done establishing how much energy could be generated by the typical array, panel requirements, space restrictions, operations and maintenance (O&M) expenses, replacement costs, and revenue sharing options. Options to generate portion of the O&M expenses through additional panels were also explored. Financial metrics including net present value (NPV) and payback period were calculated for different scenarios and a sensitivity analysis was performed optimizing for variables like revenue sharing and personnel hours. The three business models explored were: 1. City-owned roof model: 100 KW solar farms established on roofs of City-owned buildings connected with BC Hydro s net metering program. 2. Third party roof model: 100 KW solar farms established on third-party owned buildings with power purchase agreements (PPA) and net metering agreements. 3. UBC Model: 1 MW solar farms established on UBC-owned rooftops with PPA and a BC Hydro standing offer program agreement. Page 1
5 In each model, three cost scenarios were evaluated: 1. Low-Cost scenario: Using optimistic values for costs based on the low end of spectrum quoted by local suppliers and high BC hydro escalation rate values. 2. High Cost scenario: Using pessimistic values for costs based on the higher end of spectrum quoted by local suppliers and low BC hydro escalation rate values. 3. Typical solar installation scenario: Using values for discount rate, escalation rate commonly used by local suppliers instead of values commonly used in City calculations. This scenario also doesn t include revenue like grants from a developer or costs like personnel hours, revenue back to developer/strata society since these are not typical to a solar installation project. The results indicate that both the city owned roof and third-party roof model can be commercially viable with positive net present values, especially if a typical solar installation scenario is pursued which the city-owned model yielding higher returns with less complexity. A summary table of the results can be seen below in Table 1. LOW-COST HIGH-COST TYPICAL SOLAR OPTION SCENARIO SCENARIO INSTALLATION NOTES NPV NPV SCENARIO NPV City-owned roof $70K $3K $250K Least complex with most reward if Typical solar installation scenario is pursued. Third Party owned roof $18K $5K $12K More complex than City-owned roof option with less return. UBC Model $804K $103K $436K This option also involves costly and lengthy interconnection studies with BC Hydro. Table 1: Summary table of the results comparing all options and cost scenarios Following the analysis, specific locations were identified and evaluated as possible locations for establishing 100 KW solar farms. A more in-depth feasibility study was performed on Manitoba Works yard based on its electricity consumption and location characteristics like roof area available, shading, roof orientation etc. 3D models and a possible layout for a 100 KW were Page 2
6 created with the help of Rikur Energy and presented in the report. Manitoba yards was found to have adequate space and a suitable energy demand profile for an installation for a 100 KW solar farm. Structural roof assessments have to be performed to confirm roof acceptability. The key recommendations based on the analysis would be to pursue the City-owned roof strategy first and to structure the project based on the Typical solar installation scenario where personnel costs and revenue sharing are not costs to the project. Further recommendations for the city include exploring community-based participation and exploring government incentives for capital solar projects. Page 3
7 Introduction The City of Vancouver is looking to meet two ambitious goals in the upcoming future as per the Renewable City Strategy: All new buildings to have no operational greenhouse gas emissions by 2030 [1]. All energy produced in the city to come from renewable sources by 2050 [2]. To meet these goals, the City is exploring options to leverage underutilized roof spaces by adding electricity-generating solar panels, which would be owned and operated by the City of Vancouver. The electricity consumed in British Columbia and the city of Vancouver primarily comes from BC Hydro. While the electricity from BC Hydro is 98% from renewable sources, there is still 2% nonrenewable energy that needs to be offset to claim zero emissions from electricity consumption. The Zero Emissions Building Plan (ZEBP) [1] provides a roadmap for developers to implement improvements and is aligned with the BC step code which is a provincial guide to energy improvements that can be adopted by municipalities. A target for total energy use intensity is established within the 2017 Metrics research Full Report [8] that is the target for developers to meet. The solar energy utility can help developers meet this target of 100 kwh/m 2 /year energy (electricity and heating) shown in Table 2 by offsetting emissions from electricity consumption through solar energy generation. Page 4
![Table 2: Energy Step Code Implementation recommendations and targets [8] Solar Technology Photovoltaic (PV) devices or cells connected in chains and arrays are used to make panels called solar panels.](/docs-images/93/113521139/images/8-0.jpg "These then convert sunlight into electrical energy. PV systems can be arranged modularly and with each cell having a capacity of 1 or 2 watts of power, they can meet large electrical needs.")
8 Table 2: Energy Step Code Implementation recommendations and targets [8] Solar Technology Photovoltaic (PV) devices or cells connected in chains and arrays are used to make panels called solar panels. These then convert sunlight into electrical energy. PV systems can be arranged modularly and with each cell having a capacity of 1 or 2 watts of power, they can meet large electrical needs. Other components of a PV system include the mounting system for the panels, possible tracking system so that the panels point towards the sun and components that convert direct-current (DC) electricity produced by the panels into alternating-current (AC) electricity that can be used by most commonly used devices. Figure 1 shows a typical schematic of a rooftop solar arrangement. Page 5
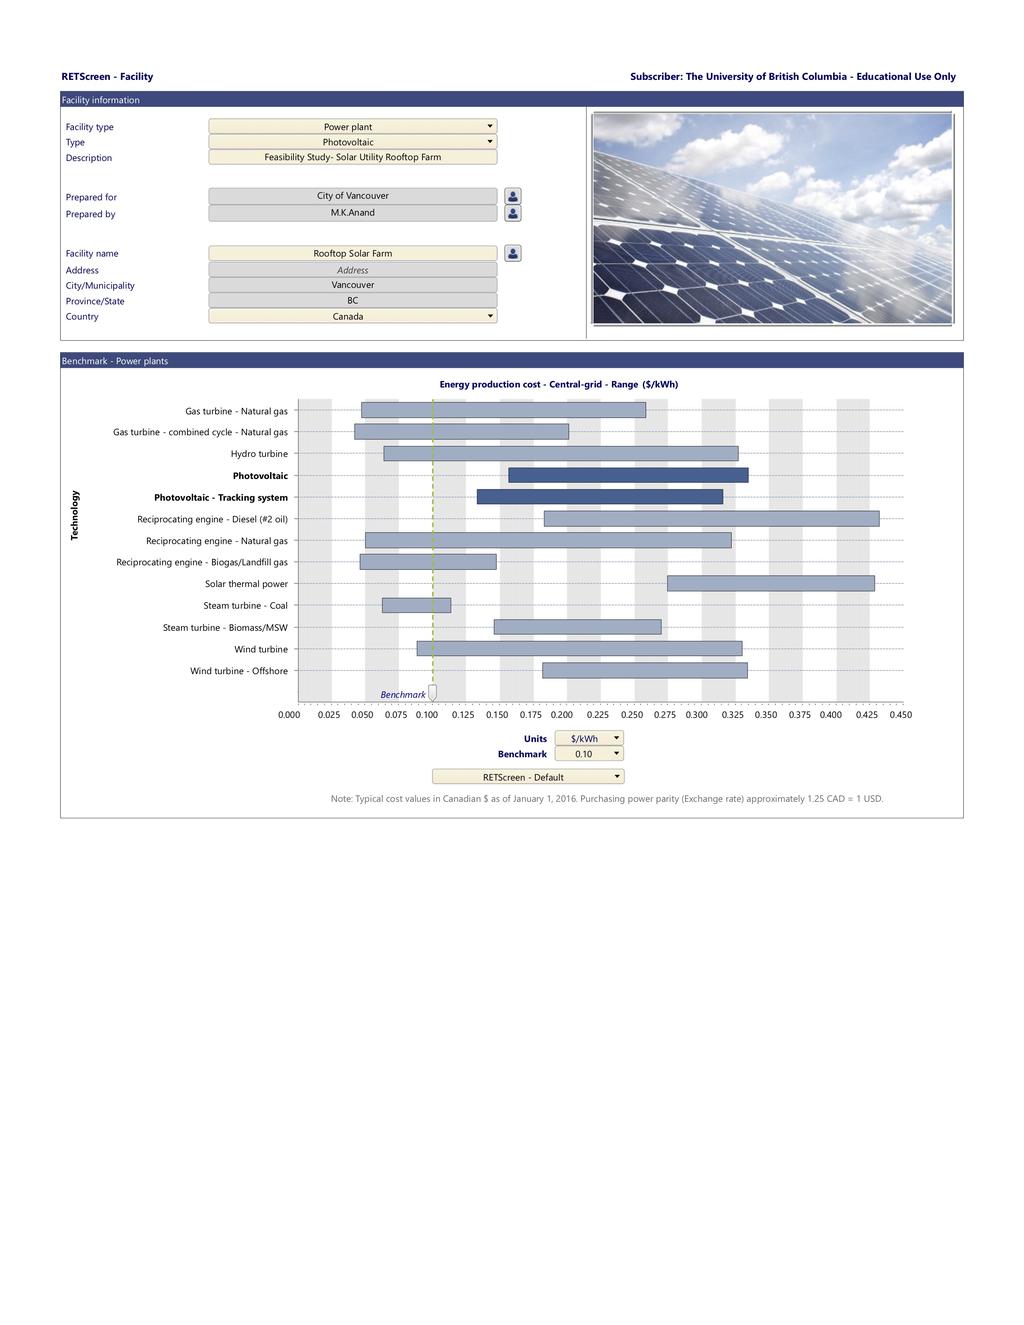
9 Figure 1: Typical solar rooftop schematic [3] Solar prices and viability The cost of solar energy has been declining recently and is nearly the cheapest the method of generating electricity in North America. The cost of generating one MWh of electricity is now approaching 50 USD/MWh increasing the viability of solar generation (see Figure 2). Figure 2: Price of Solar generation compared to other sources [4] Project Scope The project scope involved exploring the possibility of establishing a City-owned Solar energy utility from the perspective of helping developers meet the ZEBP by offsetting the nonrenewable component of their electricity consumption. As part of meeting policy, developers Page 6
10 would provide the initial capital costs of a solar farm that would offset the 2% of electricity consumption that comes from non-renewable sources. The building occupants would get a nominal share of the revenue generated by the savings from solar electricity generation. The project scope involved the following sections: 1. Background research 2. Ownership Models 3. Technical Feasibility 4. Financial analysis 5. Location analysis and possible partners Project Methodology The project methodology for each section of the project scope are as follows: 1. Background Research The administrative and legal structures of successfully operating rooftop solar utilities and cooperatives were investigated including ownership models and rate structures. 2. Exploring options for different ownership models This involved identification of business drivers that could support a solar farm utility owned by the city. Administrative and legal limitations that could affect the ownership model were investigated, including but not limited to the sale of power to BC Hydro and compliance with British Columbia Utility Commission (BCUC) regulations. 3. Determining the technical feasibility For determining the energy goal to be met by one solar farm, offsetting the emissions from the electricity generation for one new residential building (50 floors +) was chosen to be a base case. Certain assumptions had to be made and validated regarding the floor area, height and energy consumption of a building based on typical values. This requirement was used to then model a solar farm that would offset the non-renewable energy consumption from one such higher building. Page 7
11 The technical feasibility also included: Determining how much power a PV array could produce based on Vancouver s solar potential. Optimizing panel array for panel mounting, roof requirements, maintenance or replacement activities and ease of relocating equipment. Determining the capital requirements including bulk cost of panels, grid connection and installation costs for optimized arrays. Include estimated replacement costs and lifetime of arrays. 4. Performing a financial analysis for each cost scenario A financial analysis was performed for each ownership model that would meet the needs of the base case while analyzing the technical feasibility and financial health. Optimization was performed on input variables including personnel cost and revenue stream to building residents. This was performed using the software RETScreen a clean energy management software suitable for feasibility analysis for solar projects developed by the Government of Canada. A financial analysis tool was built in Excel based on the values from RetScreen to allow for ease in future modelling. 5. Locations and possible partners Potential rooftops in the city were identified that would be ideal first locations for establishing a solar farm that meet the technical, financial, legal and administrative constraints analyzed. Some possible partners in the city were identified by approaching socially responsible corporations that may consider buying solar panels or shares in a Vancouver based solar utility. Independent Electricity Generation in British Columbia BC Hydro agreements BC Hydro allows for independent power producers who generate solar electricity to connect to their grid using a variety of programs that are differentiated based on the size of projects [5]: 1. Standing Offer program for projects 1 MW and above Page 8
12 2. Micro Standing Offer program (100 KW 1 MW) 3. Net metering program (<100 KW) Of these options, net metering is the most feasible for the city since the application is much simpler than options like the standing offer program. The standing offer program is also on hold pending legislative review and it involves expensive interconnection studies to ensure that the large amount of electricity entering the grid from the facility will not create instability for BC Hydro transmission. Under the net metering program, an independent power producer can generate electricity from solar sources to be consumed on site. Any extra electricity will be sent back to the grid and credits against the electricity bill will be earned and paid out by BC Hydro at the end of the year to the owner of the net metering application. For qualification for the net metering program, the project has to be under 100 KW per AC meter and at the time of application, the project must demonstrate that the electricity consumption matches generation over the period of a year. Electricity resale in British Columbia While the resale of electricity is restricted in British Columbia under the Clean Energy Act and regulated by the BCUC, there is an exception [6] granted by the BCUC where small renewable energy (solar or wind) projects under $500K are allowed to resell electricity using a PPA. Since a 100 KW farm (the maximum allowed under the net metering program) generally falls under the $500K limit (validated through supplier consultation) for capital costs under the exception, this exception can be used by the City as an option to generate revenue under different ownership models that are covered in further sections. Ownership Models Numerous ownership models were explored for establishing a solar energy utility. Given the scope of this project and the technical and legal constraints in the City of Vancouver the following options were analyzed. Page 9
13 Option 1: City-owned Roof Model One of the big variables with establishing an urban rooftop solar energy utility is the cost and conditions for using underutilized roof spaces in the city. In Toronto for example, a typical commercial roof space used for solar generation under the feed-in tariff program costs as much as $25,000 per year in rent [7]. This would be an additional expense for the solar energy utility and should be avoided if possible. Additionally, mounting solar panels on third party roofs introduces risk to the Project regarding liability and requires complex negotiation. Therefore, this option looks at City-owned buildings where rental expenses and roof usage agreements would not be an issue. The roles of each stakeholder are shown in Figure 3 and outlined below: The Developer: Provides the initial capital for the installation of the solar farm that will offset the 2% of non-renewable electricity generation to meet ZEB policy requirements. Revenue from power generation is shared with the building occupants. City-owned Roof: Provides the roof space for the solar facility and receives clean power to help meet energy needs with self-generated clean electricity. The revenue generated is the energy purchases that are offset that is generated using solar. The City-owned building roof will be evaluated for structural integrity. The building will be connected to the grid using the BC Hydro Net Metering Agreement. Solar Energy Utility: Collects the offset revenue from the facility hosting the solar panels, oversees the operations and maintenance of the solar facility and provides revenue sharing to the building residents. The utility also signs the net metering agreement with BC Hydro. The building can also use the facility as an educational tool to demonstrate solar electricity generation to the public. BC Hydro: Provides the necessary interconnections required for connecting the solar facility to the grid and receives clean electricity generated by the solar facility. At the end of one year of generation, should there be any excess generation with respect to consumption, BC Hydro pays back the solar energy utility at an agreed cost of electricity. Page 10
14 Figure 3: Schematic of City-owned Roof option [12] Option 2: Third Party Roofs While there are numerous City-owned roofs like work yards, community centers, public libraries that would fall under Option 1, the City might decide to explore options beyond City owned roofs to underutilized roof spaces owned by third parties. The stakeholders are the same as Option 1 except instead of City-owned roofs hosting the solar facility, it will be third party owned roofs. There will be a PPA signed between the solar energy utility and the third party, agreeing to a cost of electricity sale. This could be based on avoidance of cost increase in electricity rate relative to BC Hydro escalation rate or it could be priced at a slight discount to the commercial rate paid to BC Hydro. The third-party roof owner benefits by having a lower cost of electricity and the positive publicity that comes with having a solar facility on their property without having to pay the upfront capital costs. The City benefits by avoiding cost prohibitive rental agreements. The third party will be connected to the BC Hydro grid using the standard net metering agreement. Figure 4 shows a schematic of the thirdparty roof option. Page 11
15 Figure 4: Third party roof option [12] Option 3: University of British Columbia Partnership The University of British Columbia (UBC) has two grids within its campus the Academic and Market housing grids. UBC has an interest in increasing its resiliency, increasing energy generation on campus and improving energy efficiency on campus. A developer backed solar energy farm on rooftops in campus could be a win-win proposition for both the City and UBC. Figure 5 shows a schematic of such a facility. UBC would host a large solar facility on its rooftops and a PPA would be drawn up between the solar energy utility and UBC stating a negotiated cost of electricity. The Solar energy utility and UBC would have an agreement with BC Hydro to produce this energy and conduct any interconnection studies needed as required. Page 12
16 Figure 5: UBC Partnership option [12] Technical Feasibility To ensure technical feasibility of the project, requirements were established for the energy production goal for a single solar facility. Assumptions were made about the capabilities of the solar facility based on available City information and information from local suppliers. Through calculation, the feasibility of meeting the energy requirements was analyzed. Table 3 shows the assumptions, calculations and results for establishing the technical feasibility for the base case solar facility. ITEM DESCRIPTION VALUE/ CHOSEN NOTES ITEM Energy Calculation 1 Target Total Energy usage by building 100 kwh/m2/year This target [8] establishes the energy consumption goal to be met by developers. Page 13
17 2 % of total energy usage to be from electricity usage 3 Average floor area of a typical new multi-unit residential higher building 4 Percentage of electricity from BC Hydro currently generated from nonrenewable sources 5 Total electrical energy consumed 6 2% of total electrical energy consumed and what needs to be offset by solar energy generation 7 Typical solar generation potential in Vancouver KW solar farm generation potential 9 Excess electrical generation beyond goal of offsetting building 85% A thermal energy demand target of 15 kwh/m2/year [8] leaves 85 % left for electricity usage. 45,000 m 2 Estimate floor area based on other approved higher buildings in the City of Vancouver. 2% Validated by BC Hydro Carbon Neutral Action Report [10] 3,825,000 kwh/year Calculated 76,500 kwh/year Base Case solar energy requirement 1100/KW installed Validated from several local solar energy suppliers 110,000 KWh/ year 100 KW is maximum generation allowed trough BC Hydro 33,500 kwh/year This represents a 30% oversizing. This extra generation can be used to offset operations and Page 14
18 electricity generation maintenance costs of running the emissions facility. Area Calculation 1 Area needed for typical 16 m 2 / KW installed Validated from several local solar rooftop solar facility energy suppliers 2 Typical area needed for 1600 m 2 or ft 2 Calculated 100KW solar facility Equipment selection 1 Solar Panels LG 300W panels, A wide variety of solar panel 16% efficiency manufacturers and capacities exist. This model was picked since it was in the middle of the spectrum in terms of price, capacity, availability and efficiency. 2 Inverters (converting Micro-inverters (1 Studies show that microinverters DC current into AC per 4 panels) are are less like to fail and current) recommended over are cheaper to replace when they central inverters to do fail, improving the overall improve the reliability of the system [11]. reliability of the system. 3 Warranty and project years Since all major components in a life warranty on most solar facility are under warranty components. 40 and there are few moving parts, years chosen as a project life of 40 years is project life. reasonable. Table 3: Assumptions, calculations and results of technical feasibility study Page 15
19 Financial Analysis for Ownership Models Option 1: City-owned Roofs Three possible scenarios were examined for each of the ownership models: A low-cost model (optimistic) with capital costs on the lower end of the spectrum quoted by local suppliers and seen by actual installed facilities. O&M costs (mainly cleaning) is estimated to be half that of the higher cost option. An electricity escalation rate of 3.5 % was chosen at the low end based on historical average escalation rate of 4%. A high cost model (conservative) with capital costs on the higher end of the spectrum quoted by suppliers and actual installed facilities was chosen. O&M and replacement costs are estimated to be double that of the low-cost model. An electricity escalation rate of 3% is chosen resulting in lower revenue generated from offset of electricity through solar. A model was built around what a typical solar installer would quote for a similar project. This also means the initial capital costs for the project will not be paid for by a developer and be borne by the City. This eliminates costs like personnel costs, revenue back to the developer/strata society and uses values of 5% for electricity escalation rate and 3 % discount rate (both values assumed commonly by suppliers like Penfolds Roofing and Solar and Terratek). Results: We see that if we optimize for personnel costs and revenue back to the developer, we achieve $5000/ year and $2000/ year respectively while maintaining positive net present values. We also see payback times of 18.9 years if the project was a typical solar installation with a $250,000 NPV. Page 16
20 100 KW FACILITY LOW COST (A) HIGH COST (B) TYP. SOLAR INSTALLER (C) NOTES Capital $2.5/Watt $3.5/Watt $2.75/Watt Local supplier average O&M (Cleaning) $2000/yr. $4000/yr. $2000 New West solar garden and supplier info Personnel 5000$/yr. 5,000$/yr. 0$ Optimized for maximum value possible with a positive NPV Replacement costs $10,000/ 20 yrs. $20,000/ 20yrs. $10,000/ 20yrs. Micro-inverters and movement of panels during roof replacement considered. Information from suppliers. Revenue back $2000 /yr. $2000/yr. $0 Optimized for maximum value possible with a positive NPV Escalation rate 3.5% 3% 5% BC Hydro historical values (See Appendix D) and supplier info Discount rate 6% 6% 3% City values and supplier info Net Present Value Payback Period $70,401 $3157 $258, yrs. All optimized values iterated to maximize NPV. Since under scenario A and B developers pay capital cost, payback is immediate. Payback is calculated for Scenario C which doesn t have developer grant Offset Panels revenue $3350 in Year 1 $3350 in Year 1 Table 4: Option 1 City-owned Roof Model $3350 in Year 1 This value is for year 1. Revenue escalates with escalation of BC Hydro rate Page 17
21 Option 2: Third Party Roofs The same scenarios were examined for option 2 third party roofs. The difference in the analysis is that an additional value is to be optimized for - the cost of electricity the solar energy utility can afford to sell to third party roof owners. Finding this value gives the lowest possible value the City can sell electricity for to third party roof owners and still maintain a positive NPV. This allows the city to avoid cost prohibitive rental expenses for commercial roof space and provides third party roof owners with solar electricity without having to source the capital costs themselves. Results: Optimizing for the cost of electricity, the City can afford to sell electricity at a maximum discount of 8 c/kwh and 6 c/kwh if the project was completed without personnel and revenue sharing costs. Positive net present values are possible in all scenarios with a payback time of 27 years for the scenario where the City pays for the capital costs without a developer. 100 KW FACILITY LOW COST (A) HIGH COST (B) TYP. SOLAR INSTALLER (C) NOTES Capital $2.5/Watt $3.5/Watt $2.75/Watt Local supplier average O&M (Cleaning) $2000/yr. $4000/yr. $2000 New West solar garden and supplier info Personnel $5000/yr. $5,000/yr. $0 Optimized for maximum value possible with a positive NPV Replacement costs $10,000/ 20 yrs. $20,000/ 20yr. $10,000/ 20yr Micro-inverters and movement of panels during roof replacement considered. Information from suppliers. Revenue back $2000 /yr. $2000/yr. $0 Optimized for maximum value possible with a positive NPV Escalation rate 3.5% 3% 5% BC Hydro historical values (See Appendix D) and supplier info Discount rate 6% 6% 3% City values and supplier info PPA cost of electricity 8 c/ kwh 9.8 c/ kwh 6 c /kwh Optimized for maximum value possible with a positive NPV Page 18
22 Net Present Value Payback Period $18,918 $5197 $12, yrs. All optimized values iterated to maximize NPV. Since under scenario A and B developers pay capital cost, payback is immediate. Payback is calculated for Scenario C which doesn t have developer grant Offset Panels revenue $2680 in Year 1 $3283 in Year 1 Table 5: Option 2- Third Party Roof Model $2010 in Year 1 This value is for year 1. Revenue escalates with escalation of BC Hydro rate Option 3: UBC Partnership In the UBC partnership model, we consider a 1 MW solar facility for the following reasons: There is only one meter for the academic housing side of campus so if a solar facility is being considered, one facility that meets the standing offer program requirements set out by BC Hydro [5] is more cost effective than numerous facilities. The electricity generation need is large and a larger facility will make more impact on their generation goals. The underutilized roof space is large enough to support 1 MW capacity installations. Instead of cost of electricity like in option 2, we optimize for levelized cost of electricity (LCOE) along with the personnel hours and revenue back to the developers/strata society. Result: The low-cost option LCOE is calculated to be 5.7 c/kwh which is an attractive option. Page 19
23 1 MW FACILITY LOW COST (A) HIGH COST (B) SOLAR INDUSTRY (C) BULK SOLAR (D) Notes Capital $2.5/Watt $3.5/Watt $2.75/Watt $2 /Watt Local supplier average Electricity rate O&M (Cleaning) 6.5 c/kwh 6.5 c/kwh 6.5 c/kwh 10 c/ kwh $20,000/yr. $40,000/yr. $20,000/yr. 20,000$/yr. Benchmark for cost of electricity to UBC is 6.5 c/kwh. 10 c/kwh is industry average for commercial facility and is for illustration of impact of electricity rate on values New West solar garden and supplier info Personnel $5000/yr. $5,000/yr. $0 $0 Optimized for maximum value possible with a positive NPV Replacement costs $100,000/ 20 yrs. $200,000/ 20yrs. $100,000/ 20yrs. $100,000/ 20yrs. Micro-inverters and movement of panels during roof replacement considered. Information from suppliers. Revenue back $15,000 /yrs. $20,000/yrs. $0 $0 Optimized for maximum value possible with a positive NPV Escalation rate Discount rate 3.5% 3% 5% 5% 6% 6% 3% 3% BC Hydro historical values (See Appendix D) and supplier info City values and supplier info LCOE 5.7 c/kwh 9.5 c/kwh 15.2 c/kwh 12 c/kwh Optimized for maximum value possible with a positive NPV Page 20
24 Net Present Value $804,000 $103,000 $436,162 $3.3 M All optimized values iterated to maximize NPV. Payback Period yrs yrs. Table 6: Option 3 UBC Partnership Model Since under scenario A and B developers pay capital cost, payback is immediate. Payback is calculated for Scenario C and D which doesn t have developer grant Summary of financial analysis and recommendations A summary of the financial analysis options and cost scenarios, their advantages and disadvantages and recommendations are presented below in Table 7. OPTION 1) Cityowned roof 2) Third Party owned roof LOW- HIGH- TYP. SOLAR COST COST INSTALLATION NPV NPV NPV (C) (A) (B) PROS CONS RECOMMENDATIONS $70K $3K $250K Low There are This is the option that is complexity not as recommended the city many Cityowned pursue first due to the low complexity and buildings reasonable returns that as thirdparty can be achieved roofs to be used as locations $18K $5K $12K High volume of Low It is recommended that possible roofs returns the city pursue this in city and option second due to medium the high volume of complexity roofs available. Page 21
25 3) UBC Model $804K $103K $436K High return potential Table 7: Summary of financial analysis and recommendations High complexity and unknowns This is recommended to pursue last given the complexity of interconnection studies with BC Hydro and competition with BC Hydro low levelized cost of electricity. Lessons learned from installed examples New Westminster The city of New Westminster recently inaugurated their urban solar garden, a community owned solar project installed on City property. The following are valuable insights for the City of Vancouver to consider while establishing a solar energy utility. The cost of engineering and marketing personnel hours spent setting up the solar garden was accounted for under the City s energy saving initiative and not under the solar garden budget. The City of Vancouver should consider distributing the personnel hours for the solar energy utility under their other energy related initiatives. The operations and maintenance of the solar garden was agreed to be taken on by the New Westminster utility and the costs were not accounted in the solar garden budget. Considering operations and maintenance activities on the solar facility is not extensive, Page 22

26 Urban Solar Rooftop Utility Anand these activities could be part of the regular maintenance schedules of the city of Vancouver owned buildings. Figure 6: Urban Solar garden at the city of New Westminster PV Feasibility Study for Sample location Manitoba Public Works Yards is a large facility with multiple buildings owned by the city (See Figure 8) and was chosen as a sample location for the following reasons: The facility is City-owned with no additional complexity involved with rent or having to sign a PPA and has management interest to add solar generation on top of their facilities. There is a total of 14,000 m2 of roof space available amongst the 3 main buildings onsite for mounting a 100KW solar farm on top of the facilities, which only requires 1600 m2 of area. There is significant electricity consumption (see Figure 8) at the meter at Manitoba yards ensuring that there will be little risk of solar power generation exceeding energy Page 23


27 Urban Solar Rooftop Utility Anand consumption at Manitoba Yards and violating the terms of the net metering agreement with BC Hydro. It is recommended the city perform a structural analysis to evaluate roof acceptability for a solar facility. Guidelines for structural considerations of solar installations on roofs is referenced in Appendix C A map of the roof on Manitoba Works Yard is shown below in Figure 8 with available area. There are three potential buildings that can be utilized for solar generation. Figure 7: Location map at the Manitoba Yard Works The electricity consumption of Manitoba yards is shown below in Figure 8 for 2015 obtained from the City of Vancouver. Page 24
28 Electricity Usage (Kwh) Jan Feb Mar Apr May Jun July Aug Sep Oct Nov Dec Figure 8: Electricity generation at the Manitoba Works yard in 2015 The results for the financial analysis were as follows: 100 KW FACILITY LOW COST (A) HIGH COST (B) TYP. SOLAR INSTALLER (C) NOTES Capital $2.5/Watt $3.5/Watt $2.75/Watt Local supplier average O&M (Cleaning) $2000/yr. $4000/yr. $2000 New West solar garden and supplier info Personnel $5000/yr. $5,000/yr. $0 Optimized for maximum value possible with a positive NPV Replacement costs $10,000/ 20 yrs. $20,000/ 20yrs. $10,000/ 20yrs. Micro-inverters and movement of panels during roof replacement considered. Information from suppliers. Revenue back $2000 /yr. $2000/yr. $0 Optimized for maximum value possible with a positive NPV Escalation rate 3.5% 3% 5% BC Hydro historical values (See Appendix D) and supplier info Page 25

29 Discount rate 6% 6% 3% City values and supplier info Net Present Value Payback Period $ 70,401 $ 3157 $ 258, yrs. All optimized values iterated to maximize NPV. Since under scenario A and B developers pay capital cost, payback is immediate. Payback is calculated for Scenario C which doesn t have developer grant Offset Panels revenue $3350 in Year 1 $3350 in Year 1 $3350 in Year 1 Table 8: Manitoba Works Yard PV feasibility study results This value is for year 1. Revenue escalates with escalation of BC Hydro rate Results: Manitoba Yard is an ideal location for setting up a solar facility, provided the roof is able to support the load. The net present value for the project is positive in all cost scenarios and the electricity consumption by the facility is high enough that all energy produced on site will be consumed, thus making this a good candidate for the net metering program. A possible schematic for panel installation on Manitoba Yards is shown on Building 3. Figure 9: Overhead possible layout for solar panels on Manitoba yards by Rikur Energy Page 26


30 Urban Solar Rooftop Utility Anand Figure 10: Possible layout in 3D for solar panels on Manitoba yards by Rikur Energy Possible locations for Solar farms Following the recommendations from the financial analysis of pursuing the City-owned roof ownership model, Evans Yard and National Yard (shown in Figure 11 and 12) are further options for future solar facility locations that meet the area requirement for hosting a 100KW solar facility. Figure 11: Evans Yard location: Available Area 3900 m2 Page 27

31 Urban Solar Rooftop Utility Anand Figure 12: National Yard location: Available area: 1500 m2 Community partners Local businesses were contacted to gauge interest in participation in supporting a rooftop solar utility either through grants to offset initial capital costs or through their sustainability program. Local businesses like Vancity and Quad real requested the City send further information through a formal proposal and would be good partners to approach due to their sustainability values with once a concrete approach has been formalized. Conclusion and Recommendations Based on the technical feasibility study, ownership model exploration and financial analysis of cost scenarios, it is recommended that the City pursue the creation of a solar energy utility by building 100KW solar farms on City-owned roofs first since this is the least complex and has a higher net present value compared to the third party owned roof option. The UBC ownership model should be explored to fully understand the complexities and the costs involved in the interconnection studies with BC Hydro. Page 28
32 The following next steps for the city to explore in the path to establishing the solar energy utility: Evaluate if the project can be conducted without personnel costs and revenue share back to the developers. Following the model of New Westminster, the hours spent of initial project development was borne by the City energy saving program. This was a significant cost saving to the project. Since developers are benefitting from a means to meet the ZEBP targets, it might be acceptable to not have the revenue sharing program as well. Explore models where the initial capital costs are not borne by developers. Higher building approvals are rare and if solar farms can be supported through other means like community support, local businesses or grants, it should be explored. Considering that the trend for BC Hydro s electricity generation is towards cleaner energy, the City should consider if the energy generated by solar could be an offset to the energy burned by heating through natural gas. Page 29
33 References [1] City of Vancouver, Zero Emissions Building Plan, July Accessible: [2] City of Vancouver, Renewable City Action Plan, November 2017 Accessible: [3] Building integrated Photovoltaic BIPV, Picking a PV system [Online]. Accessible: [Accessed: August 5, 2018] [4] Berke, Jeremy May 2018, Business Insider, May 2018, One simple chart shows why an energy revolution is coming and who is likely to come out on top [Online], Accessible: [Accessed: August 5, 2018] [5] BC Hydro, Sell Clean energy and connect to our Grid, [Online] Accessible: [Accessed: August 5, 2018] [6] British Columbia Utilities Commission, Proceedings, Orders and Decisions /Decisions Orders Vancouver Renewable Energy Cooperative ~ Application for Exemption from Regulation as a Public Utility for Leased Solar or Wind Energy Systems under $500,000 ~ Final Order, January 2015 [Online] Accessible: [Accessed: August 5, 2018] [7] White, Shelly, The Globe and Mail, Solar deals put empty roof space to work, April 2018 [Online] Accessible: Accessed: August 5, 2018] [8] BC Housing, Energy Step Code, September 2017, 2017 Metrics research Full Report, Page 4 [9] BC Housing, March 2018, BC Energy Step Code Design Guide, Page 5 Page 30
34 [10] BC Hydro, May 2018, 2017 Carbon Neutral Action Report, Page 2 Urban Solar Rooftop Utility Anand [11] Alferidi A, Karki R. Development of Probabilistic Reliability Models of Photovoltaic System Topologies for System Adequacy Evaluation. Applied Sciences [12] Icons from Figure 3,4 and 5 are obtained the creative common license from The Noun Project. [13] Cover picture photo obtained through creative commons license through Wikimedia attributed to Christoffer Riemer. Page 31
 Page")
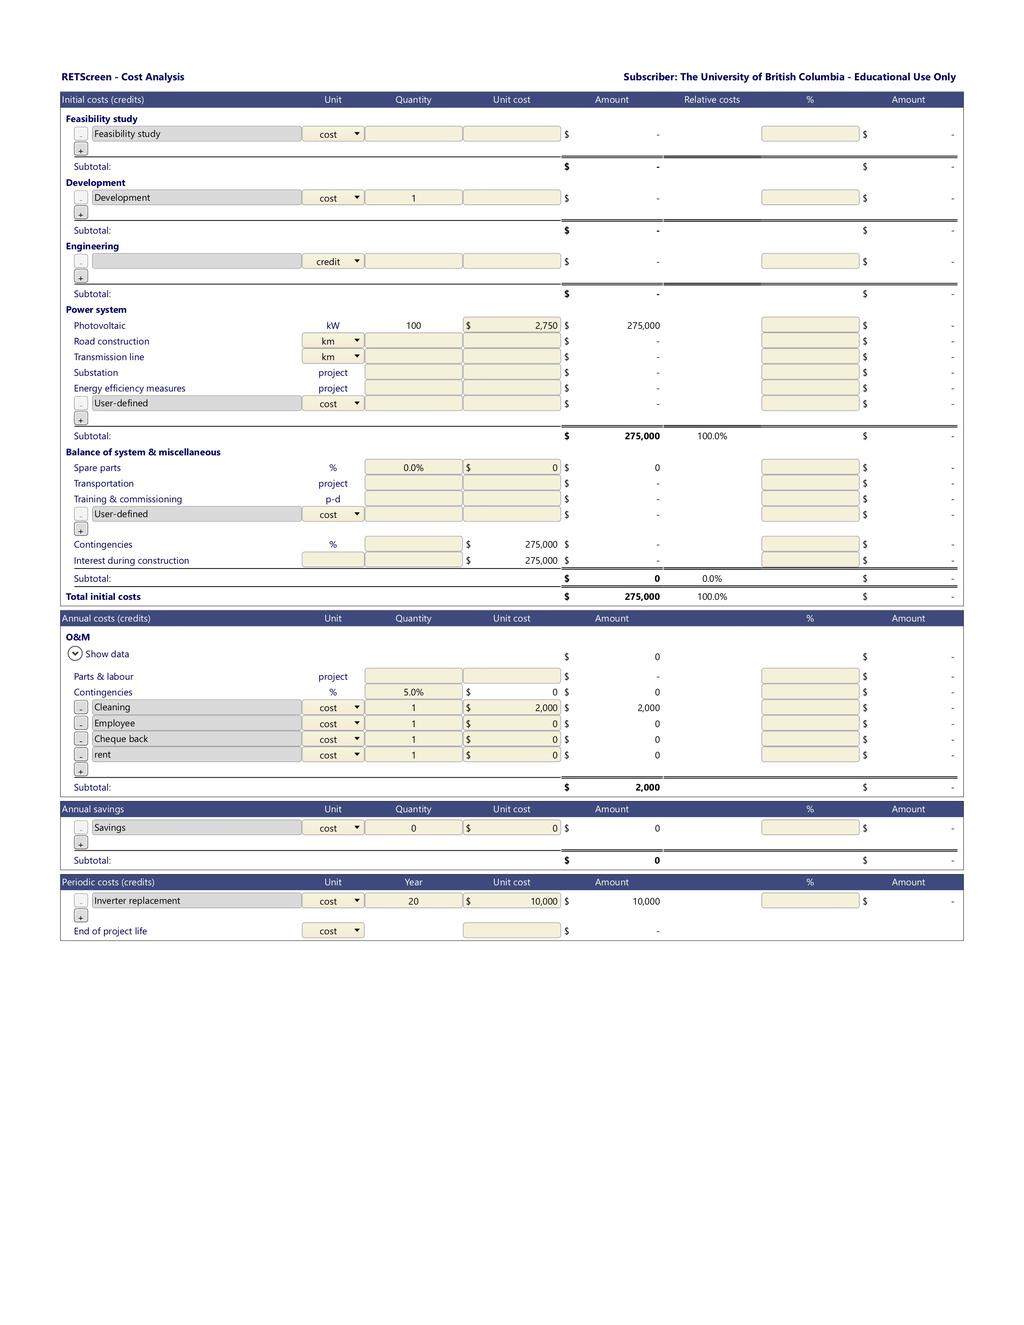
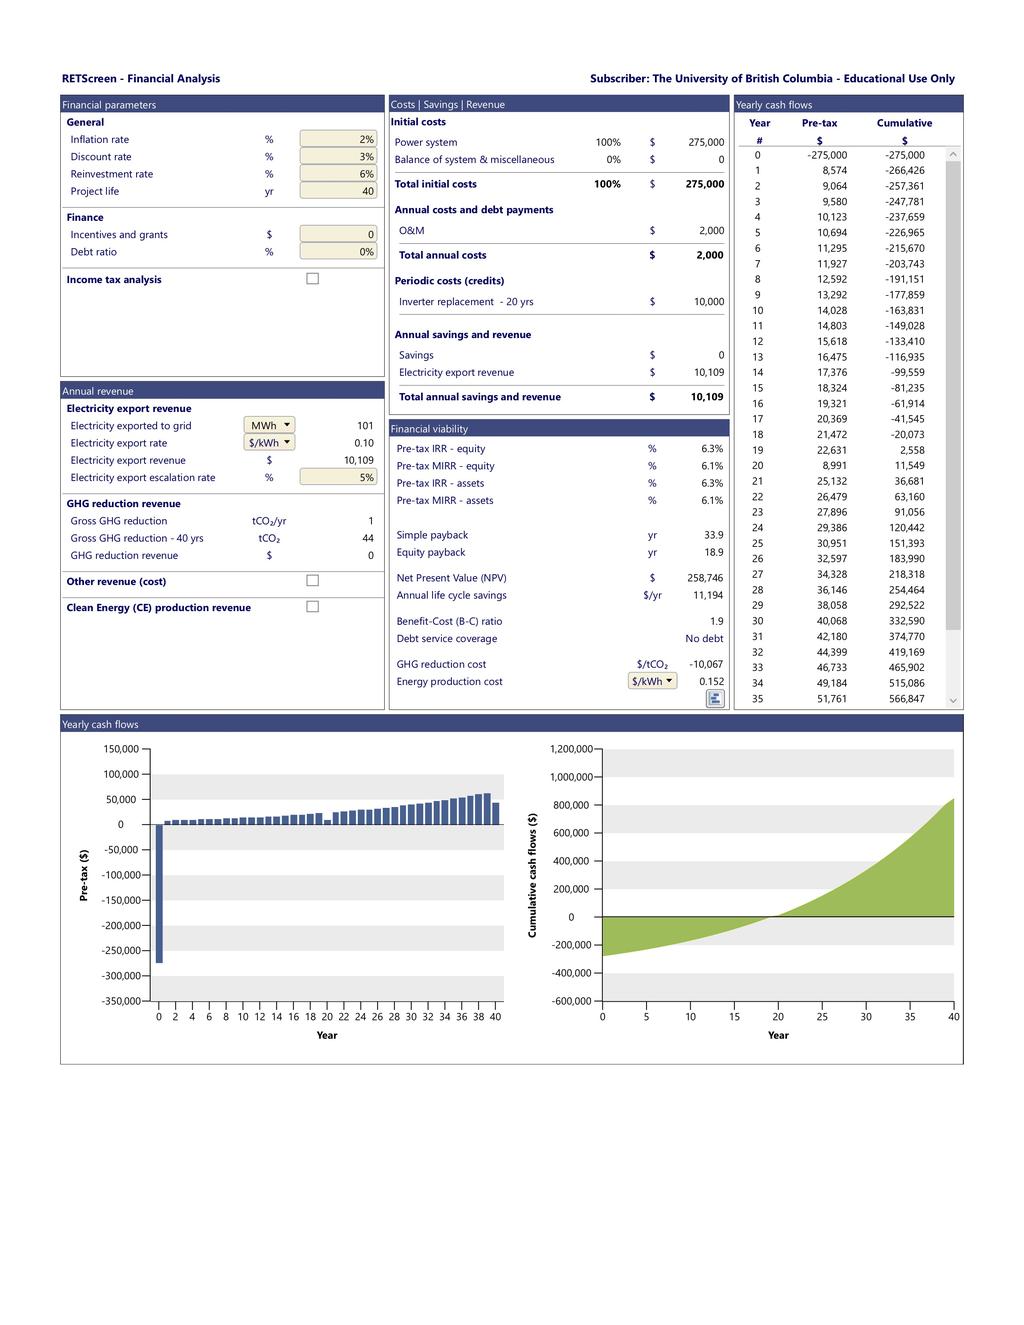
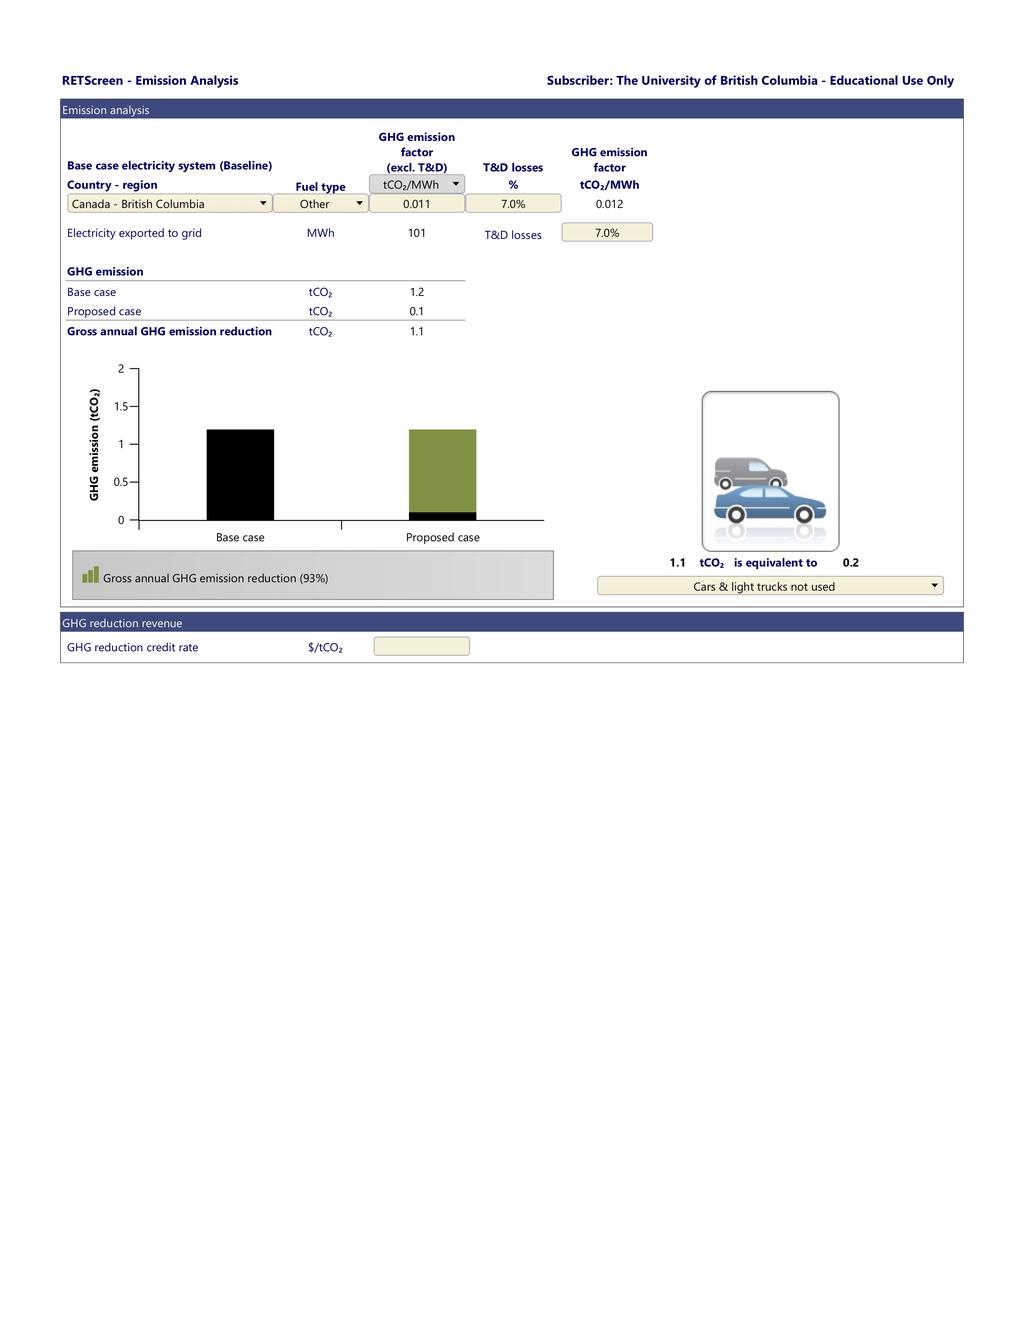
35 Appendix A Sample RetScreen Financial Model (City Owned Ownership Model, Scenario C) Page 32

36 Page 33
37 Page 34
38 Page 35
39 Page 36
40 Appendix B Major learnings from suppliers Suppliers contacted: Terratek, Penfolds, Blue Pond, Rikur Solar, BC Solar Energy, VREC, Reconsulting (consultants for renewable energy policy) Major learnings: Typical quoted install cost is $2.5-$ 2.75 /Watt. If the grid connections are complex it can rise up to $3.5/Watt. On bulk installations without grid connection complexity, under $2 is also a possibility kwh/ KW install is average generation for Vancouver that was quoted by many suppliers. Cleaning the solar panels is not a necessity in Vancouver since the rain is actually cleaner than the tap water that would be used. Maximum annually $2000 can be budgeted if needed. Personnel hours are usually not accounted for in solar project installation costs since the mobile applications constantly monitor performance and give alerts Suppliers advised that it is hard to recover savings from 3rd party roof owners by solar energy generation. It was advised that it is better to sell electricity at an agreed price than charge rent under BCUC exception [6] Central 3 phase inverters from companies like companies like Solar edge are in the $20,000 price range but micro inverters are in the $500 price range and the probability is low all of them will fail at once. It is recommended to go with micro-inverters to save on replacement costs and improve reliability. It should be considered if the roof is going to be replaced within the time period of the solar project lifetime. If so although it is uncommon to account for this in the costs of a solar quote, once supplier with roofing experience mentioned there could be costs Page 37
41 associated with lifting solar panels off the roof and storing while the roof is being replaced. The Industry commonly uses a discount rate of 3% in its net present value calculations. The industry typically applies a BC hydro escalation rate of 4-6% depending on the supplier. There is a tax credit called accelerated capital cost allowance (ACCA) tax credit can be exploited by for profit organizations to pay off capital expenses for solar projects over 5 years. Numerous solar panel manufacturers were recommended including LG, Canadian Solar etc. in the W capacity range. It can be investigated if the suppliers are ethical and follow good labor practices before the panels are chosen. Page 38
42 Appendix C- Roof Structural considerations Page 39
43 Page 40
44 Page 41

45 Page 42
46 Page 43
47 Page 44
* <II... a. E 15.0% - - ~ I I j lo.")


48 APPENDIX D BC Hydro Historical Price Escalation Rates r Capital Expenditurbs &, Bill Impacts!- I 25.0% 20.0% $3,00C $2,50C - %change in residential bills (nominal, not adj usted for inflation)* <II... a. E 15.0% - - ~ I I j lo.o% r1=t1~1~--t-7r--~-====----_: j_~--=--~j 'iii a,... C: 5. 0% I I I I I I I I I I I =1. ~ I I I I I 111.c u a, bl) u a, Q., Q.0% I I I I I I I I I I I I I I I I I I I I I I Y-ear $2,00C -- <II C: $1,500.E,vi'. m s1,ooo 8 $500 $- N -<II a,... ::I.t:! -0 C: a, C. X w o. 111 u 10 Vear Cumulative Bill Impact 1973 to 1982 was 113% *Assumes a 1,000 kwh residential customer and includes the impacts of general rate increases (prior t o 1982 BC Hydro set its own rate increases, after 1982 general rat e increases were approved t hrough RRAs by t he BCUC), rate struct ure impacts {ie. includes bill impact s as a result of rate re-structuring) and other charges (ie. rate rider, et c). 6 Page 45