Climate Change and Fish in the Pacific Northwest: Case Study of the Snoqualmie River Basin
|
|
|
- Sophia Goodwin
- 5 years ago
- Views:
Transcription
1 Climate Change and Fish in the Pacific Northwest: Case Study of the Snoqualmie River Basin Pete Bisson USDA Forest Service PNW Research Station Olympia, WA
2 U.S. Forest Service Water Strategy Water a precious resource The water we drink, the recreation we enjoy, and the quality and livability of our communities all depend on the ability of forests to sustain water supplies and water quality long into the future. Over half of all rivers, streams, lakes and wetlands in the 48 contiguous United States begin in forests. They gather and filter water that sustains fish, plants, and wildlife; supports food, energy, and industrial production, and flows from the faucets of our homes and businesses. More than 66 million people in 33 states rely directly on the National Forests and Grasslands for their drinking water. But fresh water is a resource in crisis. In the United States, invasive species, pollution, and increased urban and rural development are among many immediate concerns affecting water quality and quantity. Across the globe, more than a billion people live without clean drinking water, 2.6 billion live without adequate water sanitation, and almost 4,000 children die every day from water-borne diseases. Finally, everywhere we are seeing and feeling the effects of climate change on water, including floods, hurricanes and changing sea levels.

3 University of Washington Climate Impacts Group summarizes past trends projects future changes


4 Implications of climate change for the Forest Service Do historical data for this basin support the Climate Impacts Group s conclusions? How could climate trends specifically affect fish? Why the Snoqualmie R. basin? Unregulated FS predominant land manager Large wilderness area Long-term environmental databases
5 Metro King County
6 Snohomish R. basin Snoqualmie gauging station USGS
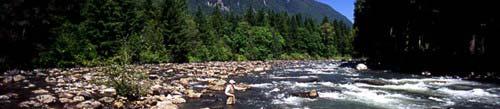

7
8 Dan Nutt
9 Chinook salmon Threatened
10 Coho salmon Species of Concern
11 Chum salmon relatively healthy
12 Pink salmon relatively healthy
13 Steelhead Threatened
14 Coastal cutthroat trout relatively healthy
15 Bull trout Threatened
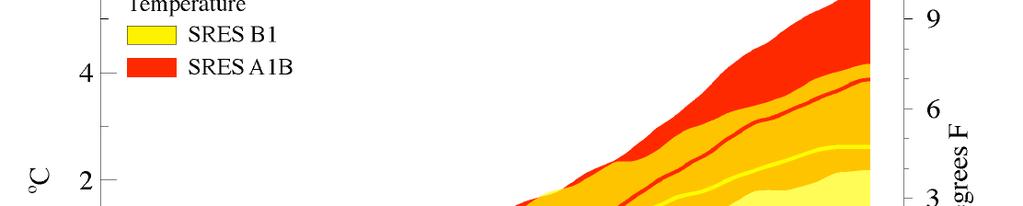
16 CIG Conclusion: Temperature has increased. Average annual temperature increased C (1.5 F) in the Pacific Northwest from Trends in winter season and daily minimum temperatures have been largest. Temperature trends from are largest from January- March, and trends in minimum daily temperatures have been larger than trends in maximum daily temperatures. t
17
18 Temperatures at Snoqualmie Falls, WA Monthly Average Trends Increasing Slo ope of Tre end ?? Decreasing Jan Feb Mar Apr May Jun Jul Aug Sep Oct Nov Dec Month
19 Temperatures at tsnoqualmie Falls, WA Variation by Month nt of Vari iation Coefficie Jan Feb Mar Apr May Jun Jul Aug Sep Oct Nov Dec Month
20 CIG Conclusion: Cool season precipitation variability has increased. Cool season precipitation in the PNW is more variable from year to year, displays greater persistence, and is more strongly correlated with other regions in the West since about 1973.
21 Precipitation trends 20 January 20 July Precipitatio n (in.) Precipitatio on (in.) Year Year
22 Precipitation at Snoqualmie Falls, WA Monthly Average Trends Slo ope of Tre end Wetter Drier Jan Feb Mar Apr May Jun Jul Aug Sep Oct Nov Dec Month
23 Coeffic cient of Var riation Precipitation at Snoqualmie Falls, WA Variation by Month Jan Feb Mar Apr May Jun Jul Aug Sep Oct Nov Dec Month
24 CIG Conclusion: April 1 snow water equivalent (SWE) declined at nearly all sites in the PNW between 1950 and The declines are strongest at low and middle elevations, and can be explained by observed increases in temperature and declines in precipitation over the same period of record. Timing of peak runoff has shifted. Timing of the center of mass in annual river runoff in snowmelt basins shifted 0-20 days earlier in much of the PNW between 1948 and 2002.
25 Snowfall at Snoqualmie Pass, WA Graph: Steve Wondzell
26 7,000 March Runoff occurs earlier 7,000 April , ,000 Mean Daily Discharge (cfs) 5,000 4, ,000 2,000 1,000 Mean Daily Discharge (cfs) 5,000 4, ,000 2,000 1, Year Year 7,000 May 7,000 June Mean Daily Dis scharge (cfs) 6,000 5,000 4,000 3,000 2,000 1,000 charge (cfs) Mean Daily Dis 6,000 5,000 4,000 3,000 2,000 1, Year Year
27 Slo ope of Tre end (delta cfs/day) Snoqualmie River at Snoqualmie, WA Monthly Average Discharge Trends Increasing Decreasing Snow melt Precipitation Jan Feb Mar Apr May Jun Jul Aug Sep Oct Nov Dec Month
28 Decreased flows in mid-winter and mid-summer ,000 January 7000 August 6, Mea an Daily Dischar rge (cfs) 5,000 4,000 3,000 2,000 1,000 Mea an Daily Dischar rge (cfs) Year Year
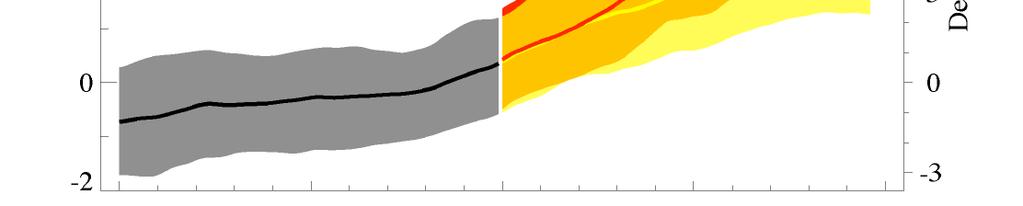
29 CIG Conclusion: Fish Projected temperature increases and streamflow changes could create environmental conditions that are inhospitable to many PNW cold water fish populations (e.g., salmon, trout), and the rates of change may outpace their ability to adapt. Salmon species unusual life cycles make them sensitive to climate changes in a range of aquatic habitats. In summer, low flows and high stream temperatures hinder both juvenile growth and survival and adult migration. Changes in the timing of peak streamflow may increase their vulnerability to floods and decrease their ability to migrate to the ocean.
30 Effects on Snoqualmie Basin fishes: Temperature Elevated winter temperatures will accelerate embryo development in fall spawning species (Chinook, coho, chum, pink salmon, and bull trout), resulting in earlier spring emergence Earlier emergence (March) may increase fry vulnerability to late winterearly spring storms but gives fish a head start on the growing season Higher spring water temperatures will be favorable for growth; higher summer water temperatures will be detrimental to growth Higher temperatures overall will favor warm-water species such as minnows and suckers; non-native native species not an issue in Snoqualmie R. (yet) Higher summer temperatures may exacerbate mortality of migrating and holding adults (spring Chinook, summer steelhead)
31 Effects on Snoqualmie Basin fishes: Precipitation and Discharge Higher precipitation and discharge in November could result in egg mortality if the frequency of streambed mobilizing events increases Lower precipitation and discharge in December and January may hinder access to winter habitats, especially floodplain wintering sites Earlier spring runoff will favor early migrating smolts at the expense of late migrating smolts AND timing of ocean entry may not correspond with plankton blooms Lower summer flows will reduce available rearing space and may cut off access to thermal refugia Lower summer and early fall flows will hinder adult migrations in drought years
32 Winning strategies Losing strategies Habitat generalist Abbreviated time in fresh water High stray rate Brief temp. exposure Spring spawning Habitat specialist Extended freshwater rearing Low stray rate Extended temp. exposure Fall spawning Lower risk Cutthroat trout Chum salmon Pink salmon Fall Chinook Winter steelhead Sockeye salmon Coho salmon Spring Chinook Summer steelhead Higher risk
33 What can land managers age do? Minimize increases in water temperature by maintaining well shaded riparian areas Maintain a forest stand structure that retains snow water and promotes fog drip, but reduces the rain on snow effect associated with large forest openings Disconnect road drainage from the stream network to soften discharge peaks during intense storms Ensure that fish have access to seasonal habitats, e.g., off-channel or cool water areas Protect springs and seeps from water appropriation