Air emission inventories of cattle manure processed at a biogas plant
|
|
|
- Rebecca Hill
- 5 years ago
- Views:
Transcription


1 LIFE+Futur Agrari (LIFE12 ENV/ES/000647) M. Torrellas J. Noguerol V. Riau, L. Burgos L. Tey A. Antón A. Bonmatí Air emission inventories of cattle manure processed at a biogas plant Measured and estimated emission accounting 3th International Symposium on Emissions of Gas and Dust from Livestock Saint-Malo, France 21 st to May 24 th, 2017
2 1. Introduction Objectives Objectives of the study To develop an air emission inventory from the processing of manure at a biogas plant, by field measurements. To provide an approach to estimate these emissions. To evaluate the relevance of an emission inventory in environmental assessments (LCA).


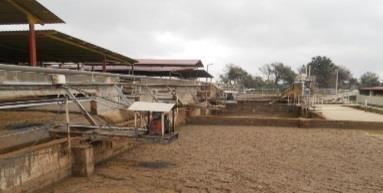
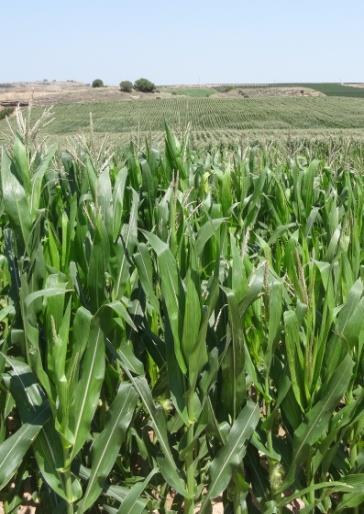
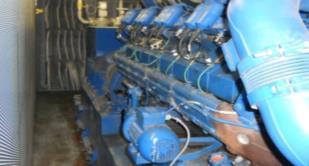
3 Scenario for the study Biogas plant Co-substrate Cow manure Electricity Thermal energy CHP 500 kw Biogas Digestate Liquid fraction, storage pond Fertilization Solid fraction, composting piles Mechanical separation


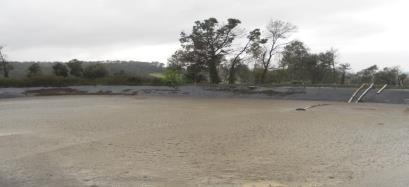
4 Scenario for the study Reference situation Storage pond


5 Sampling Sampling at the biogas plant Time period: 2 years Liquid and solid samples Monthly sampling Determination of parameters - TS, VS, TKN, NH 4 -N, ph, CE, SO 4, P, K, Cu, Zn.


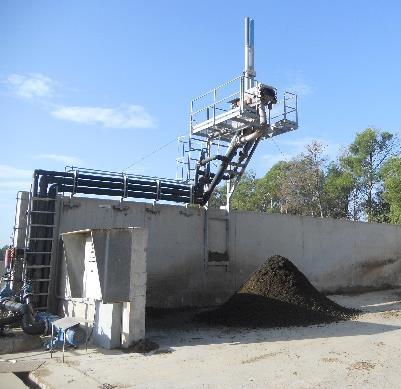
 Solid fraction storage")
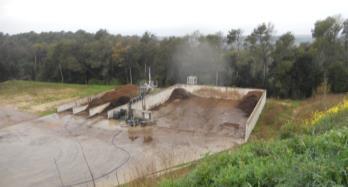
6 Sampling Emission sampling Sampling every two months Sampled emissions: - CH 4 - N 2 O-N direct - NH 3 -N - H 2 S Global warming Acidification Influent storage (IS) Liquid fraction storage (LFS) Solid fraction storage (SFS)
7 Sampling Data from emission sampling Data were used to prepare an emission inventory per storage compartments Emissions IS LFS SFS NH 3 -N mg m -2 s CH 4 mg m -2 s N 2 O-N dir mg m -2 s H 2 S mg m -2 s Influent storage (IS) the highest CH 4 and H 2 S emissions Liquid fraction storage (LFS) the highest NH 3 -N emissions Solid fraction storage (SFS) the highest N 2 O-N dir emissions


8 Sampling Sampling in situ Advantages - Emission measurement per compartment - Direct information for the plant characterisation in real conditions Drawbacks - Time consuming - Required equipment and trained personnel - Economic cost
9 Emission estimation Estimations with calculation methods IPCC Model (Intergovernmental Panel on Climate Change) Guidance on methods to estimate emissions of CH 4 from enteric fermentation in livestock, and CH 4 and N 2 O from manure management
10 Emission estimation Estimated emissions NH 3 -N N 2 O indirect CH 4 Influent pond Final pond Compost N 2 O direct Compost Indirect N 2 O emissions are due to NH 3 -N volatilization Direct N 2 O emissions from liquid/slurry: Emission factor is 0 according to IPCC
11 How we applied IPCC models REFERENCE SITUATION Slurry application Slurry EF NH 3 -N 1 EF N 2 O 1 ind 1 B 0 MCF 1 CURRENT SITUATION Digestate application Influent pond Anaerobic digestion Mechanical separator Final pond Slurry + cosubstrate Biogas Liquid fraction L EF NH 3 -N 1 EF NH 3 -N 1 EF N 2 O ind 1 B 0 1 MCF 1 Time spent 2 Degraded VS in AD 45% 3 B 0 (m 3 CH 4 /kg VS) S Bulking agent? VS 2 Separator efficiency 4? B 3, 5 EF NH 3 -N Digestate N VS Liquid fraction 94% 77% Solid fraction 6% 23% Composting Compost EF N 2 O dir 1 1 IPCC, 2006, 2 El Mashad i Zhang et al., 2010; 3 Rodhe et al., 2015; 4 Moller et al., 2002; 5 Experimental data
12 Results Models comparison Reference situation kg y -1 Tier 1 (IPCC) Tier 2 (Local) Tier 3 (Analysis) N excreted by animal N total farm 86,613 69, ,309 VS excreted by animal VS farm 1,717,234 1,498,371 2,409, ,000 Tier 1 IPCC Tier 2 Local Tier 3 Analysis 120, ,000 kg y -1 80,000 60,000 40,000 20,000 0 NH3-N CH4 N2Oindir 3 -N 4 N 2 O indirect
13 Results Current situation NH 3 -N CH kg y kg y IS LFS SFS Total 0 IS LFS SFS Total kg y N 2 O indirect IS LFS SFS Total kg y N 2 O direct IS LFS SFS Total Tier 1 Tier 2 Tier 3 Measurements
14 Results CO 2 eq balance For the generation of electricity at CHP Avoided electricity for medium voltage production mix, Spain 2013 (1 kwh electricity 335 g CO 2 eq) Tier 1 Tier 2 Tier 3 Measurements Tonnes CO 2 eq y Total emissions Net emissions Avoided electricity emissions
15 Results Contribution LCA (Life cycle assessment) Functional unit: 1 kwh Avoided electricity for medium voltage production mix, Spain 2013 Method: ILCD 2011 Midpoint 100% 80% 60% 40% 20% 0% -20% -40% -60% -80% -100% Avoided electricity Electricity imported Cosubstrate transport Cosubstrate Infrastructure Emissions Impact categories
16 Determination of emissions Results Contribution % LCA (Life cycle assessment) Comparison of environmental impacts considering different emission inventories Tier 1 emissions Tier 2 emissions Tier 3 emissions Measurements 43% 36% 49% % Climate change Particulate matter Acidification Marine eutrophication 75% Impact categories
17 3. Conclusions Regarding the methods used Emission measurement is complex due to the technical requirements and not always possible. Emission estimation methods can be useful to determine emissions. It is necessary to adapt these methods for the conditions at a biogas plant. Emission inventories are a key point in environmental assessments such as LCA.

18 Marta Torrellas Thank you very much for your attention!!