Watershed Response to Water Storage. 8/1/2012 Paul Wymar Scientist Chippewa River Watershed Project
|
|
|
- Homer Wright
- 5 years ago
- Views:
Transcription


1 Watershed Response to Water Storage 8/1/2012 Paul Wymar Scientist Chippewa River Watershed Project


2 Chippewa River Watershed 1.3 Million Acres Largest tributary watershed in the Minnesota River Basin 7 main drainage basins (watersheds) Over 2672 miles of ditch, stream and River
3 CRWP Work Otter Tail CRWP supports local conservation efforts and brings a watershed focus to these projects. Grant Douglas Watershed Key River Lake Road Dry Weather Creek Unmonitored CRWP monitors the rivers, streams and ditches of the Chippewa to help direct conservation work effectively Stevens Pope Lower Mainstem Middle Mainstem Upper Chippewa Shakopee Creek East Branch CRWP maintains flow and pollution monitoring sites throughout the Chippewa Watershed some have been in operation since 1998 Swift Kandiyohi W N E USGS maintains 2 flow monitoring stations one since 1937 Chippewa Miles S

4 Chippewa Flood History 252% increase in peak flood event. 1.8% increase in rainfall. Any way you look at it floods are getting higher.


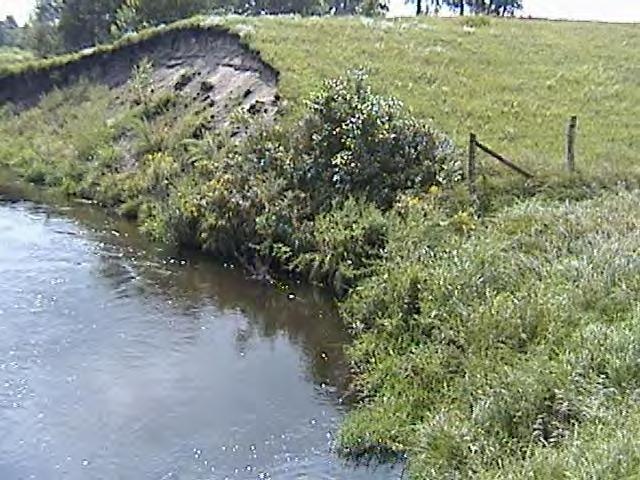
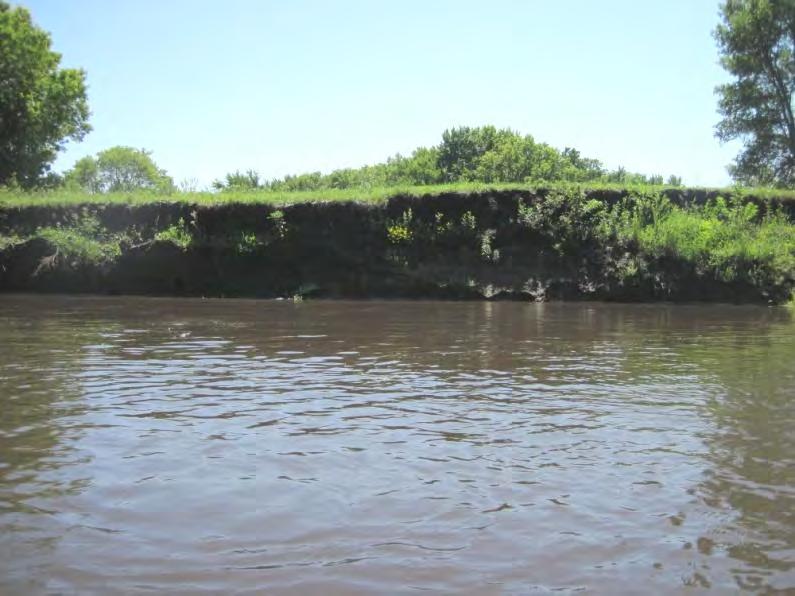
5 Bank Erosion is most impacted by high flow

6 High Water s impact on pollutant loading Load (tons) Suspended Sediment Load Vs. Flow, Dry Weather Creek 2003 Sediment Flow High flows result in high levels of sediment 63% of 2003 sediment came in late June /1 4/15 4/29 5/13 5/27 6/10 6/24 7/8 7/22 8/5 8/19 9/2 9/16 9/ Flow (cfs)

7 Low flow can be trouble also Less dilution, less habitat, less ability to overcome stressors and pollutants. Sloughing banks, carp, warm temperatures, high nutrients, algae blooms.

8 Every tributary watershed is unique


9 General Relationship of Water Quality to Land use (Chippewa River) All things equal, more perennial land uses in a watershed results in cleaner water, but there are exceptions. The same holds for water runoff, the more perennial land use the less water that runs out of a watershed.
10 2 Tributary Basins 2 Stories Upper Chippewa 227,383 Acres Due to higher slopes sediment erosion predicted to be high (RUSLE) Land use: 60.3% Row Crops 13.8% Wetland and Open Water 24% Grassland & forest <1% Urban Shakopee Creek 197,110 Acres Due to low slopes sediment erosion predicted to be low (RUSLE) Land use: 81.4% Row Crops 5.8% Wetland and Open Water 11% Grassland & forest <1% Urban

11 2 Flow Responses to 2002 Shakopee Creek Hydrograph, 2002 Upper Chippewa Hydrograph, 2002 Flow (cfs) /08/02 04/23/02 05/08/02 05/23/02 06/07/02 Shakopee Creek 06/22/02 07/07/02 07/22/02 08/06/02 08/21/02 09/05/02 09/20/02 Precip. Shakopee Precipitation (in) Flow (cfs) /08/02 04/23/02 05/08/02 05/23/02 06/07/02 Upper Chippewa 06/22/02 07/07/02 07/22/02 08/06/02 08/21/02 09/05/02 09/20/02 Precip. Upper Chip Precipitation (in) Spring melt peak 12 days later in Upper Chippewa Flood peaks are higher and faster in Shakopee Creek Shakopee Creek: inches of rain, 36,272 Acre Feet Upper Chippewa: inches of rain, 34,664 Acre Feet


12 Water Quality Data +72% +36% +133% +1741% TSS=Total Suspended Solids, TP=Total Phosphorous, OP=Ortho Phosphorous, NO2-3=Nitrate Nitrite Nitrogen
13 2 Small Watersheds, different land uses. CD29, Huse Cr. #Y #Y


14 CD 29 Vs. Huse Creek CD 29 is 38% larger than Huse Creek. CD29 delivered 344% more water to Norway Lake. Each acre of CD29 yielded 2.5 times as much water as Huse Creek. Higher volumes of water means more pollutants.


15 Impact of Soil Types on Flow Responses Dry Weather Cr. is 13% smaller than Cottonwood Cr. Dry Weather Cr. Yielded 54% more water. In 2005 rainfall differed by 0.43 inches. Land use pattern is the same for both watersheds. Soil type makes a difference when considering these two watersheds. Tile drainage is widespread in Dry Weather Creek less so in Cottonwood Creek, both watersheds have public and private ditch systems.

16 2005 stream response to soil differences. Peak discharges are greater in DWC It takes more rainfall to bring the river up in CWC Late season base flow is higher in CWC, (good for aquatic wildlife)
17 Shakopee Creek Headwaters Benefits to flood response 2001 #Y #Y #Y #Y Shakopee Creek Overall 197,110 Acres 81.4% Row Crops 5.8% Wetland and Open Water 11% Grassland & forest County Ditch 27 10,093 Acres 82% Row Crops 2.6% Wetland and Open Water 4.7% Grassland & forest Shakopee Headwaters 30,833 Acres 51.4% Row Crops 18.9% Wetland and Open Water 14% Grassland & forest


18 April 10, 2001 CD27, culvert is full Lake Andrew, barely flowing Shakopee Creek Outlet, bridge is under water
19 2001 Spring Flood Peak Spring Peaks: Discharge (cfs) Chippewa & Shakopee Hydrographs 4/1 4/15 4/29 5/13 5/27 6/10 6/24 7/8 7/22 8/5 8/19 9/2 9/16 9/30 Lake Andrew Shakopee Outlet Hwy 40 CD27 (estimated) Hwy 40, 4-11 Shakopee Outlet, 4-10 CD 27, 4-11 Lake Andrew Outlet, 4-29 Shakopee Headwaters delayed it s peak delivery of 31,000 acres by 18 days.


20 Not all Storage is created equal The case of Shakopee Lake 260 acre Lake Classical dam and pool. Designed as a sediment pond. Currently full of silt, carp and algae. From the lake was responsible for 5.6% of all Suspended Solids and 4.3% of all Phosphorous pollution in the Chippewa Watershed.

 and")
21 Shakopee Lake Impoundment does not help water quality Shakopee Lake does not decrease flooding. Shakopee Lake adds TSS (as algae) and phosphorous. Shakopee Dam causes downstream erosion.

22 Summary High water causes more erosion and flood damage. Land use, landscape cover and soil types impact quantity, timing and duration of water discharge. Water retention can drastically impact high water timing and is a major part of the solution in improving water issues. Management of water is complex be careful not to create a larger problem. Solutions are site dependant. Consider your soils, landscape, agricultural practices and watershed when designing drainage plans.