Waste Water Treatment Technologies
|
|
|
- Neal Warner
- 5 years ago
- Views:
Transcription


1 Waste Water Treatment Technologies Dr. Adalberto Noyola Robles **Dr. Juan Manuel Morgan Sagastume Dra. Patricia Güereca Hernández M. en C. Margarita Cisneros Ortiz M. en I. Liliana Romero Casallas M. en I. Flor Hernández Padilla M. en C. Adba Musharrafie Martínez M. en C. Alejandro Padilla Rivera


2 Introduction Objectives Data acquisition General results Most used technologies Most used Waste water flows (WW) Regulation General scenarios Conclusions
3 For the LAC region this study: identifies the most representative Waste Water Technologies (WWT) defines the most representative wastewater flows presents WW laws and regulations estimates GHG emissions produced by WW

4 Collection of information by national researchers in 6 Countries. Review documentary information published by agencies, organizations and utilities. Inventory information for a sample of WWTP / country, according to: - Categorization of cities by population size. - Survey items : a) General application b) Specific applications - Wastewater quality -Sludge, biosolids and solid wastes - Emission and odor control - Costs c) Validation on the field of information
 Colombia was selected to represent this area, this because represents the country with the greatest sanitation coverage")

5 Brazil and Mexico are countries at intermediate stage of development, with medium coverage (PAHO,2001), that by dimension is advisable to analyze independently of smaller countries. For the Andean Countries (Bolivia, Colombia, Ecuador, Peru and Venezuela) Colombia was selected to represent this area, this because represents the country with the greatest sanitation coverage (83%), Southern cone region (Paraguay, Chile, Argentina y Uruguay), Chile was selected because it has the highest treatment coverage in the area (93%). Guatemala and Dominican Republic were selected to represent de Caribbean and Central America areas. This because both countries have high coverage compared to other countries. Additionally, Guatemala was selected for its high vulnerability to climate change (Maplecroft, 2009)
, Type of secondary treatment Population served, Capacity of the WWTP (l/s), Final disposal of treated")
6 Criteria for selection of WWPs: The location of the WWTP's (county, state, according to the country's political division ), Type of secondary treatment Population served, Capacity of the WWTP (l/s), Final disposal of treated water.


7 THE MOST USED TECHNOLOGIES IN LAC
. Q1: 0.1-25 l/s Q2: 25.")
8 No. de PTAR WWTP capacities related to population size Chica (2,000-9,999 hab) Pequeña (10,000-99,999 hab) Intermedia (100, ,999 hab) Grande (> 1 milón hab). Q1: l/s Q2: l/s Q3: l/s Q4: >2501 l/s To relate the type of city with the installed capacity of the WWTP it was multiplied the population size of each type of city by the assumed water endowment ( 235 l/day per capita with 85% of wastewater generation) ( Spellman, 1999).

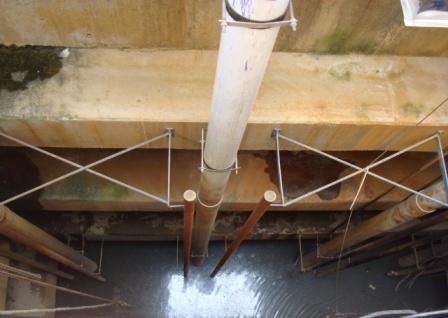
9 Stabilization Ponds Activated Sludge UASB Wetland Trickling Filters Imhoff Tank Anaerobic filter Advanced Primary Compact Plant Aerobic Submerged Filter No. Technologies Brazil: 854 Chile: 178 Colombia: 141 Guatemala:43 Dominican Republic: 33 Mexico: 1684 TOTAL: The 4 most used technologies, cover 89% of the total sample of WWTP The septic tank was not considered as technology for the treatment WWTP that reported combined processes (two technologies) were counted independently.


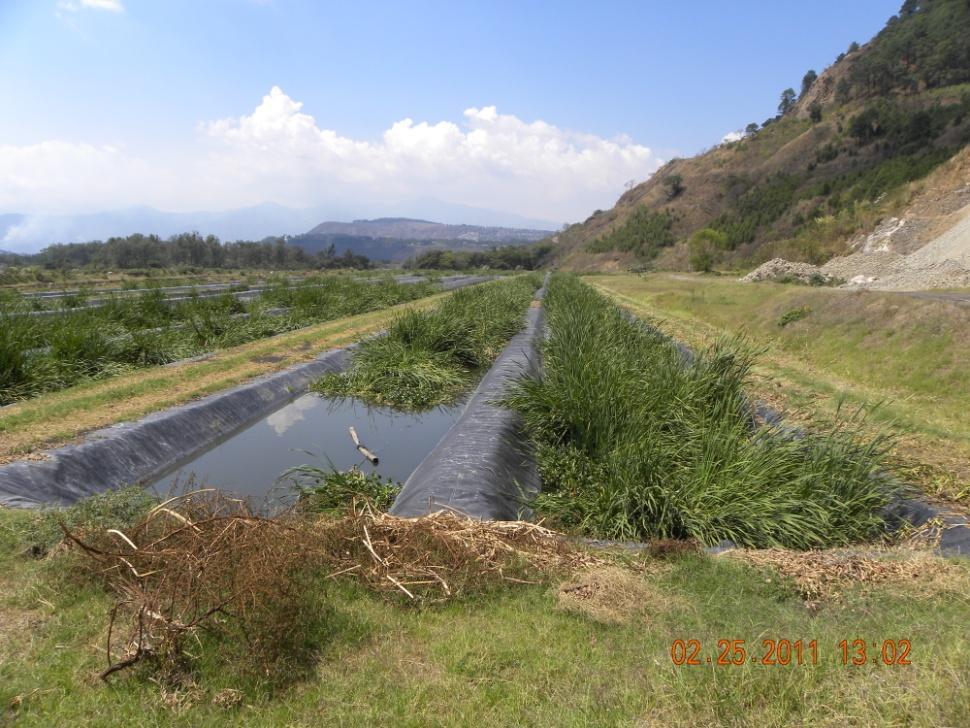
10 STABILIZATION POND 1 ACTIVATED SLUDGE 2 WETLAND 5 3 UASB REACTOR TRICKLING FILTER 4
11 Stabilization Ponds Activated Sludge UASB Wetland Trickling Filters Stabilization Ponds Activated Sludge UASB Wetland Trickling Filters Stabilization Ponds Activated Sludge UASB Wetland Trickling Filters Stabilization Ponds Activated Sludge UASB Wetland Trickling Filters Stabilization Ponds Activated Sludge UASB Wetland Trickling Filters Stabilization Ponds Activated Sludge UASB Wetland Trickling Filters Percentage Most used technologies in the selected countries Brazil Chile Colombia Guatemala Dominican Republic Mexico


12


13
 Canoas, Colombia (under construction, 14 m3/s) Taboada, Perú (under construction, 14 m3/s)")
14 In contrast to the number of small WWTP, there are mega projects in LAC, some under construction : Atotonilco, Mexico (under construction, 35 m3/s) Canoas, Colombia (under construction, 14 m3/s) Taboada, Perú (under construction, 14 m3/s) etc
 Caudal tratado por la muestra de PTAR por pais")
15 Weight of the most 4 used technologies in the total México 67,467 76,483 República Dominicana 1,740 1,808 Colombia 14,052 18,829 Guatemala Chile 35,512 35,512 Brasil 21,580 22, ,000 20,000 30,000 40,000 50,000 60,000 70,000 80,000 Caudal tratado por las 4 tecnologias más usadas (l/s) Caudal tratado por la muestra de PTAR por pais (l/s)
16 No. de PTAR con datos 60 Year of construction of the WWTP Período de construcción (años).1-10 l/s l/s l/s l/s l/s l/s l/s l/s l/s >2500 l/s
17 Preliminary reflections The use of small WWTP is a very common practice in LAC wastewater treatment. However, the environmental impacts generated by many small WWTP could be greater than a big properly operated wastewater treatment plant which serves to a big population. What should be better, many smalls WWTP or a big one?


18 MOST USED FLOWS AND CHARACTERIZATION

 264 TN (mg/l) 42 TP (mg/l) 7 FC ( MPN 100")
19 Most used flows l/s l/s l/s 13 l/s 70 l/s 618 l/s More than 2,501 l/s 5,800 l/s Parameter Influent BOD (mg/l) 244 COD (mg/l) 557 TSS (mg/l) 264 TN (mg/l) 42 TP (mg/l) 7 FC ( MPN 100 ml -1 ) 1.2x10 7


20 REGULATION
21 Parameters used for regulation comparison Lax Legislation Biochemical Oxygen Demand BOD5 (mg/l) Settleable solids (ml/l) Oil and grease (mg/l) Floating matter (mg/l) Stringent legislation Fecal Coliform (MPN/ 100 ml) Helminth eggs (h/l) Oil and grease (mg/l) Biochemical Oxygen Demand BOD5 (mg/l) Total Suspended Solids TSS (mg/l) Nutrients
22 Parameter: BOD 5 (mg/l) (A) Ríos Embalses naturales y artificiales (B) Aguas costeras y/o marítimas México (A) República Dominicana (A) (B) Chile (A) 35 Colombia (A) Y (B) Remoción >80% en carga Guatemala (A) Y (B) Reducción en 20% Brasil (A) 3-10

, and Those that requires a removal percentage of the organic load discharged")
23 Regulations by group of countries : The standards that set maximum limits to be met by wastewater discharges into receiving bodies (applicable to Mexico, Dominican Republic and Chile), The regulations which are focused on the receiver body in order to preserve its water quality (Brazil), and Those that requires a removal percentage of the organic load discharged (Colombia, Guatemala).
24 Preliminary Results Brazil has the strictest regulation in comparison with the rest of countries. Maximum permissible limits are set in order to maintain the water quality of the receiving bodies Rest of countries regulate the quality of effluent WWTP that discharges into the water body. Why such a diversity of regulations in LAC?


25 Water Quality Standard adopted in this study BOD = 30 mg/l; TSS = 30 mg/l; FC = 1,000 MPN/100mL
26 9 scenarios. Flow range Technology Water Quality 13 l/s Q1 X Y Z high Selection of the 3 more representative treatment technologies. Statistical analysis to determined 3 representative influent flows. 70 l/s Q2 X Y Z high Mass balance, materials and equipment requirements and energy consumption, based on a process simulator 618 l/s Q3 X Y Z high 30 mg/l BOD5-30 mg/l TSS Use of the Life Cycle Assessment methodology with social aspects

27 E-LCA S-LCA Environmental and social impacts Climate Change Adaptation: WWT for high quality treated water Biogas as energy source Substitution of energy conventional sources Mitigation: More efficient processes Low environmental impacts

28 MAIN SHEET OF PROCESS SIMULATOR DEVELOPED FOR PROJECT PURPOSES

29 CONSUME OF ENERGY
30 COST OF OPERATION US DOLLARS
31 Methane emissions (g/m3) Methane emissions in anaerobic WWTP Treated flow (m3/s)
32 CONCLUSIONS (at present ) The most representative technologies in LAC are: stabilization ponds, activated sludge, UASB reactors and trickling filters (which represent 89% of WWTP in LAC). The municipal wastewater treatment plants in LAC are designed to treat flows below 25 l/s, (which represent 77% of reported cases). Brazil has the strictest regulation in comparison with other countries, since their maximum permissible limits are set in order to maintain the water quality of the receiving bodies, in contrast to countries that regulate the quality of effluent WWTP that discharges into the water body. As the treatment flow increase, it was observed that the energy consumption per cubic meter treated and O&M cost trend to be stable from 15 l/s.


33 GRACIAS