Energy Efficiency in Energy Crop Digestion
|
|
|
- Paul Gibson
- 5 years ago
- Views:
Transcription
1 Energy Efficiency in Energy Crop Digestion Based on an Evaluation of 41 Austrian Full Scale Biogas Plants Rudolf Braun and Michael Laaber Institute for Environmental Biotechnology Interuniversitary Department for Agrobiotechnology IFA-Tulln University of Natural Resources and Applied Life Sciences Vienna Berlin, May 2007
2 CONTENTS Introduction Digestion Plant Examples Energy Crop Digestion Process Evaluation in Austria Energy Efficiency of Biogas Plants Conclusions

3
4


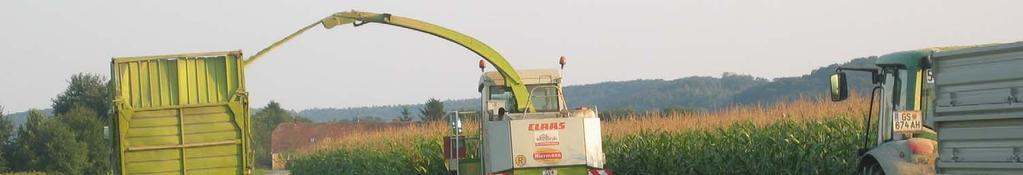
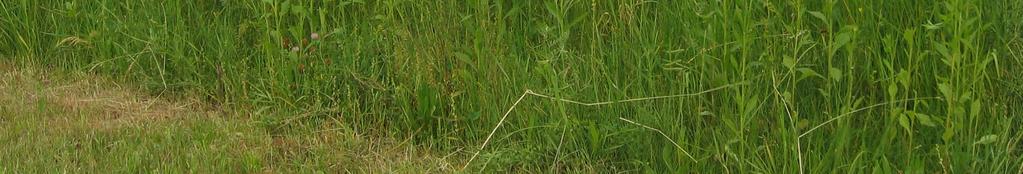
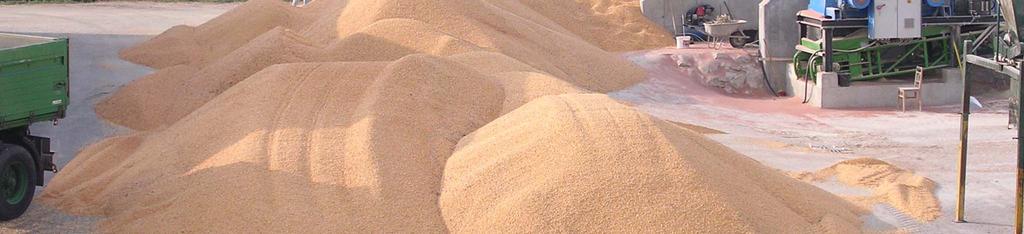
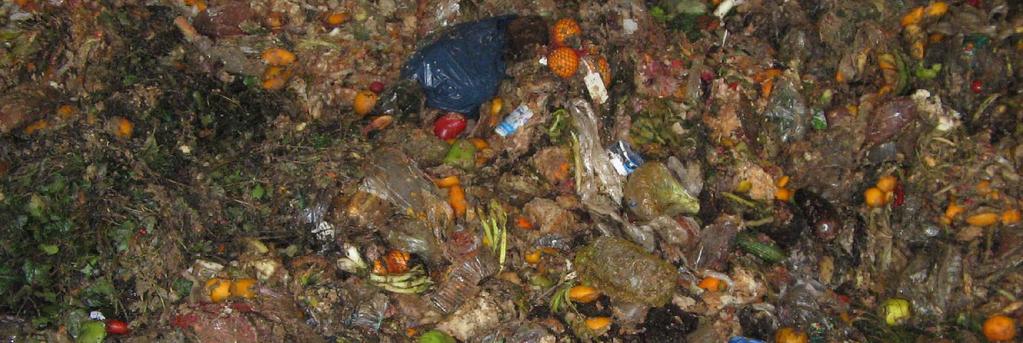
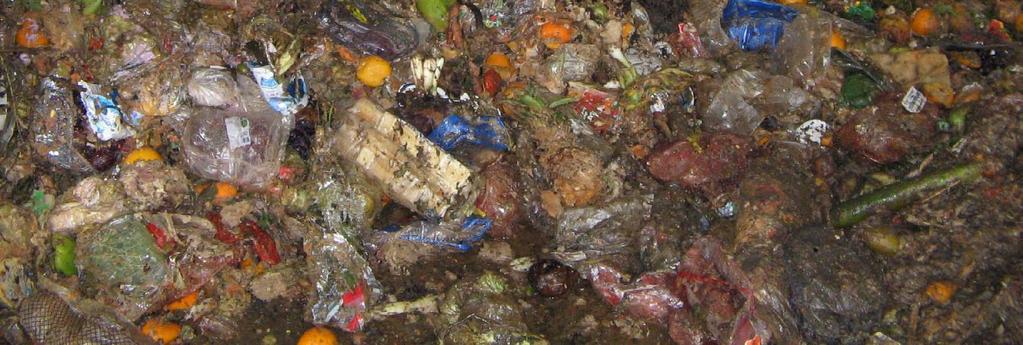
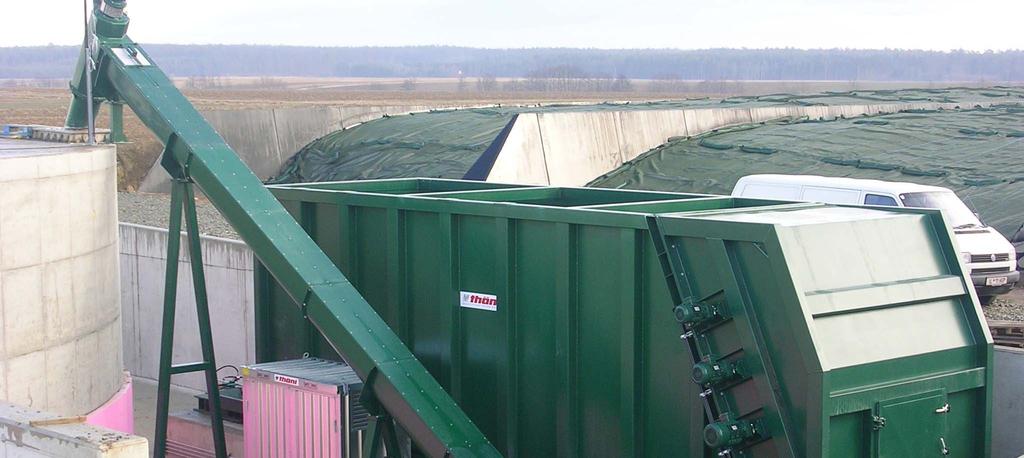
5 1 A Renewable raw materials 1 B Bio-waste, by-products 2 A Substrate preparation & dosage into digesters 2 B 4 Biogas use for power generation and /or upgrading to fuel 3 Use of digestate as fertilzer and/or compost


6


7


8
9
10


11
12
13


14
15
16


")

")


17 CHP Dual fuel burner Biogas train Linköping (Photo: Svensk Biogas) Biogas refuelling station Linköping (Photo SGC)


18 Open lagoons Digestate composting Covered digestate storage tank

19 Development of an evaluation system for biogas plants Ecolabel Biogas" (BMVIT EdZ Project-No )
20 Parameters used in efficiency evaluation of biogas plants General functional description Quality / quantity Transport Storage Pretreatment Costs Startup Investment costs Subsidies Annual costs Process steps Substrate dosage Digester type Digester equipment Digester mixing Storage type / cover Treatment / Dewatering Use Gas holder Upgrading Quantity /utilisation Measurable process conditions SUBSTRATE COD 1 TKN 2, NH 4 -N TS 3, VSS 4 DIGESTER T, Self heating ph, VFA 5, COD, TS, VSS TKN, NH 4 -N Process energy demand Sludge recirculation DIGESTATE ph, COD, TS, VSS VFA, TKN, NH 4 -N CH 4 -formation Hygienic status BIOGAS CH 4, H 2 S PERSONNEL EXPENDITURE SALES REVENUES / OVERALL ECONOMICS Calculable variables t / year Costs/year Residence time Hydraulic loading VSS degradation Biogas yield t / year Calorific value Electrical efficiency Degree of utilisation of heat
21 Used substrates (% VS) 100% 80% used substrates [% VS] 60% 40% 20% 0% biogas-plant-number energy crops % manure % co-substrates % bio-waste %
22 Plant size (kw el ) and reactor volume (RV) rel. frequency [%] total RV [m³] installed electrical power [kw el ] el. power total RV
23 Investvestment costs Investment costs [ inv /kw inst ] bio-waste energy crops Plant size [kw el ]
24 Energy Efficiency Electrical Efficiency Thermal Efficiency Energy Balance (Output : Input) (5 selected biogas plants)
25 Utilisation of fuel energy 80 Degree of utilisation of fuel-energy [%] installed el. power [kwhel] Degree of electrical efficiency Thermal usage of fuel energy
26 Cultivation Ensilage Dosage Process energy- On-site power Digestate use Fertilizer Silo cover demand Motor oil demand Methane losses Pestizides Transport Plant 1 Plant 2 Plant 3 Plant 4 Plant 5 Maize & other plants, agricult. by- products, manure No use of synthetic fertilizer 2-step plant 500 kw el Only renewable biomass (Maize, grass), no manure Synthetic fertilizer appl. (base fertilising) 2-step plant 500 kw el Oil seed residues, Fat trap contents, waste from food & feedstuff industry; waste food, beet sugar by-products; renewable biomass on occasion 2-step plant Mainly manure (62 % cattleand pig manure) Food leftovers and potato slops; 2-step plant 200 kw el (ignition oil applied in CHP) Conventional manure treatment (90 % pig manure and chicken litter), small amounts of fat trap contents Gas displacement system with hydraulic mixing kw el 18 kw el (η CHP only 22 %)

27 Energy flow during energy crop production-, digestion- and energy use CED Cumulative Energy Demand

28 Mass flow (VS) during energy crop production-, digestion- and energy use
29 Plant 1 Plant 2 Plant 3 Plant 4 Plant 5 Maize & agric. Byproducts, manure No synth. fertilzer, 2-step plant, 500 kw el Maize, Clover grass, no manure, Synthetic fertilizer, 2-step plant, 500 kw el Biowaste, Renewable raw materials on occasion 2-step plant, kw el manure (60%), Food leftovers, Destill. slops 2-step plant 200 kw el (Ignition oil in CHP) Manure (90%), Fat trap contents; 18 kw el (η CHP only 22 %) Input CED Input CED Input CED Input CED Input CED O:I Power/Heat O:I Power O:I Power/Heat O:I Power O:I-ratio severely influenced by the degree of heat use O:I-ratio severely influenced through transport energy demand O:I-ratio severely influenced through use of ignition oil Favourable O:Iratio in manure digestion
30 Comparative < Output : Input > - Efficiencies of Bioenergies Plant oil* Biodiesel* Ethanol* BtL* Hydrogen* Biogas* Own measurements (including CED ** ) Plant 1 (Renewables & agric. by-products) Plant 2 (Renewables ) Plant 3 (bio-waste, partly. renewables ) Plant 4 (manure, Co-substr., ignition oil CHP) Plant 5 (manure) *) Data source: FNR (2006); **) Cumulative Energy Demand
31 Conclusion Energy balance (Output : Input) in Biogas production is favourable compared to other bio-energies (e.g. ethanol) Favourable Energy efficiency achievable even in manureor bio-waste digestion Considerable potential for AD efficiency improvement e.g. Heat use, Degradation efficiency, Reliable process technology
32 Thank you for your attention! Acknowledgement This research work was kindly supported by the Austrian Federal Ministry of Infrastructure & Traffic and the Ministry of Trade & Industry Staff members Dipl.Ing. Christoph Resch Dipl.Ing. Harald Lindorfer Dipl.Ing. Roland Kirchmayr Dipl.Ing. Michael Laaber