Data Quality in Estimating Storage Tank Releases to Air in the Oil and Gas Sector
|
|
|
- Simon Hunt
- 5 years ago
- Views:
Transcription
1 Data Quality in Estimating Storage Tank Releases to Air in the Oil and Gas Sector CPANS May 9, 2018 Harold Laurence
2 Introduction Oil & Gas sector on the rise in Alberta 60% growth in investment % growth in exports 2017 Alberta Government 2017 Budget Economic Outlook NPRI regulatory driver Approx. half of AB sites reporting to NPRI are in the O&G sector U.S. EPA forthcoming revisions to AP-42?
3 Agenda Introduction Natural Gas Production Water - Flashing Crude Oils Degassing Crude Oils Nomograph Overestimates U.S. EPA TANKS 4.0.9d and Alternatives Capture Efficiency
4 Natural Gas Midstream Production Water Water that is used during production e.g. fracking May condense out of produced natural gas Contains hydrocarbon contamination but is mostly aqueous
5 Natural Gas Production Water Scenario: Production water tank at a dry gas well Onsite separator removes production water from natural gas Separation Vessel Natural Gas Production Water Water Tank Vapor Control Wastewater
6 Natural Gas Production Water Best Practices Take a pressurized sample from separator Gas chromatograph data on compounds Gas-oil ratio Advantage: direct access by sampling the vapor products of flashing Calculate working/breathing with TankESP or AP-42 If not available: Simulate flashing using thermo calculations API offers software tool Need a reasonable assumption re: qty VOC flashed
7 Natural Gas Production Water Method A: Sampled Gas-Water Ratio metric tons VOC Release, = bbl GWR, scf/bbl yr yr 379 scf/lbmol vapor MW, lb /lbmol vapor wt% VOC 100% %DRE lb metric 2000 USton US ton Separation Vessel Natural Gas Production Water Water Tank Wastewater
8 Natural Gas Production Water Method B: Material Balance Release, metric tons VOC yr = bbl yr 42 gal bbl m liquid wt% VOC gal 100% %DRE Separation Vessel Natural Gas Production Water Water Tank Wastewater
9 Natural Gas Production Water Result Method A, GWR Method B, Mat l Balance Throughput, m 3 /yr 20,700 20,700 Liquid wt% -- 1% (conservative est.) GWR, scf/bbl 4.01, analytical -- Vapor Molar Mass, g/mol 31.02, analytical -- Vapor wt% VOC wt%, analytical -- Vapor Capture/Control 98% 98% VOC Release, metric tons/yr % Difference % (!!) Environment and Climate Change Canada, Guide for Reporting to the National Pollutant Release Inventory (NPRI): 2016 and 2017, Cat. No. : En81-1E-PDF, 2016.
10 Natural Gas Production Water Site-related variances in analytical results Vapor wt% VOC from 1% to 50% VOC release quantity proportional to vapor wt% Gas-Water Ratio up to 7 bbl/scf VOC release quantity proportional to GWR
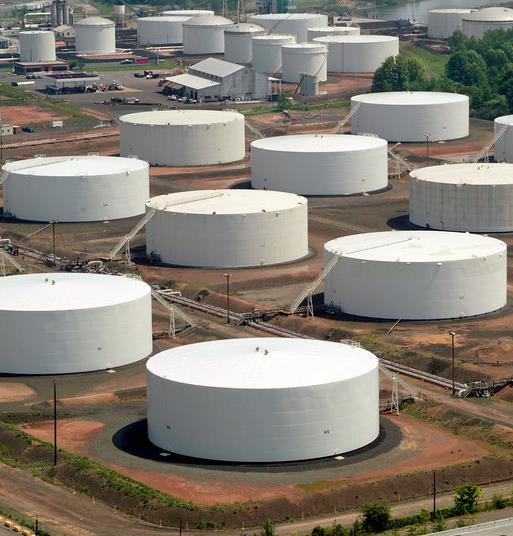
11 Crude Oil Vapor Pressure Scenario: Crude oil storage
12 Crude Oil Vapor Pressure Best Practices Use ASTM D6377 to quantify TVP Advantage: discovers TVP of crude without using RVP to TVP correlations that overstate TVP Instructions for lab analysis: Measure the TVP at various temperatures E.G., 5 C increments from 5 to 40 C Use a Vapor to Liquid (V / L) ratio of 4.0 Then, use results to regress TVP as function of temperature
13 Crude Oil Vapor Pressure Relationship between nomographs and degassing Nomograph gives one TVP for each (RVP, T) From U.S. EPA, AP-42 emission factor guide, section 7.1, Organic Liquid Storage Tanks
14 Crude Oil Vapor Pressure Method A: ASTM D6377 Analytical sampling at specified Gas-Oil Ratio (GOR) and temperature curve Method B: API 19.2 Nomographs
15 Crude Oil Vapor Pressure Result Method A, ASTM D6377 Method B, API 19.2 Reid Vapor Pressure, kpa True Vapor Pressure, kpa, 37.8 C, Degassed True Vapor Pressure, kpa, 37.8 C, Not Degassed Crude analytical data sourced from: Hannes Pickner, Validation of True Vapour Pressure Measurement in Crude Oil and Refined Products, Petro Industry News Annual Buyer s Guide 2017.
16
17 Standing Loss (VFR) Related to several variables L s varies close to directly with P vap Subject to some assumptions
18 Working Loss (VFR) AP , Equation 1-35 L W directly proportional to Pvap (W V )
19 Crude Oil Vapor Pressure Release Scenarios Vertical Fixed-Roof Tank Large Internal Floating Roof Storage Tank Tank Diameter, m Tank Height, m Capacity, m Turnovers 25/yr 2/yr Color White White Roof Type Cone, m/m slope Internal Floating, Mechanical Shoe Seal Shoe-Mounted Secondary Location Fargo, ND Fargo, ND
20 Crude Oil Vapor Pressure Result Degassed Not Degassed Reid Vapor Pressure, kpa True Vapor Pressure, kpa, 37.8 C (reference) Atmospheric Pressure, kpa Flashing? No Yes not in TANKS 4.0.9d VOC Release, Small VFR, metric tons/yr working % Difference -37.7% -- VOC Release, Large IFR, metric tons/yr total % Difference -73.3% -- Emissions calculated with U.S. EPA TANKS 4.0.9d tool; excludes flashing emissions for non-degassed crudes. Cannot calculate VFR standing losses for non-degassed crude because K E calculates incorrectly to zero.
21 Crude Oil Vapor Pressure Relationship between nomographs and real-world pressures Nomograph is conservative overestimate
22 Crude Oil Vapor Pressure Result Nomograph Equation of State VPCR, kpa True Vapor Pressure, kpa, 37.8 C (reference) True Vapor Pressure, kpa, 5.8 C (Fargo ann. avg.) VOC Release, Small VFR, metric tons/yr total % Difference 28.4% -- VOC Release, Large IFR, metric tons/yr total % Difference 29.7% -- Vapor pressures extrapolated at Fargo, ND temperatures based on curves provided in Cameron Konecnik, Proposal for an Improved Method of Crude Oil Vapor Pressure Determination, CCQTA 3 rd Annual LDAR-BWON-Tanks-Flares Conference, February 19, 2013, figure titled Vapor Pressure Project Results P1.

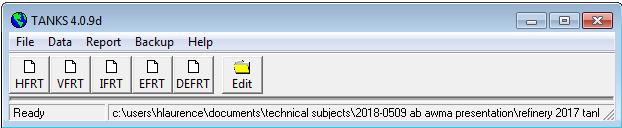
23 U.S. EPA TANKS 4.0.9d
24 U.S. EPA TANKS 4.0.9d Many reasons to avoid if possible AP-42 revisions Annual vs. monthly calculations Working losses in VFRs inaccurate calculation method
25 U.S. EPA TANKS 4.0.9d Specific reasons to avoid in oil & gas sector Crude oil approach may underestimate (TCEQ has disallowed TANKS since 2011) No flashing emissions No roof landing / tank cleaning emissions Monthly variance is inaccurate, but needed for: Tanks with throughput changes Tanks with seasonal regulatory requirements
26 Tank Emission Calculation Tools TankESP by Rob Ferry, now with Trinity Captures flashing, roof landing, AND cleaning! Trinity Tanks Tool Captures roof landing and cleaning Spreadsheet High degree of customization for advanced users API E&P TANK Captures flashing
27 Closing Remark Capture % 100% capture for tanks with cover and closed vent system < 100% if tank is overpressurized and vapors released w/o control Small changes in capture % = large changes in release quantities 99% to 98% = double 98% to 97% = 1.5x Etc.
28 Conclusions Analytical data are gold standard NG prod water: pressurized sample Crude ASTM D6377 Validate assumptions behind data use Calculate flashing, degassing, and nonsteady-state releases Consider alternatives to TANKS 4.0.9d API 19.2 nomograph may overestimate Pvap and releases
29 Questions? Contact: (253) Kent, Washington, US