Management of Natural and Environmental Resources for Sustainable Agricultural Development. Regional Diversity & Change over the Pacific Northwest
|
|
|
- Lora Riley
- 5 years ago
- Views:
Transcription


 By Raymond Motha")
 13 February")
1 Management of Natural and Environmental Resources for Sustainable Agricultural Development Regional Diversity & Change over the Pacific Northwest (Maritime, Rangeland, Riparian, Desert, and Forest) By Raymond Motha (USDA), Phil Pasteris & Jan Curtis (NRCS) 13 February 2006 Portland, OR
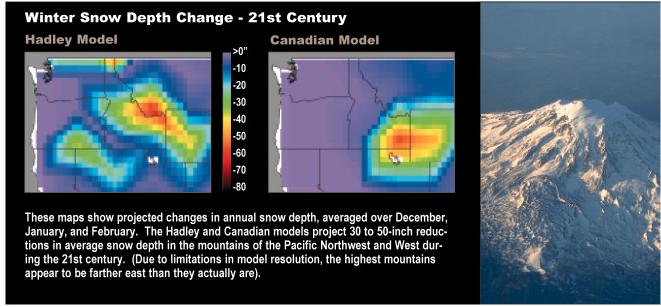
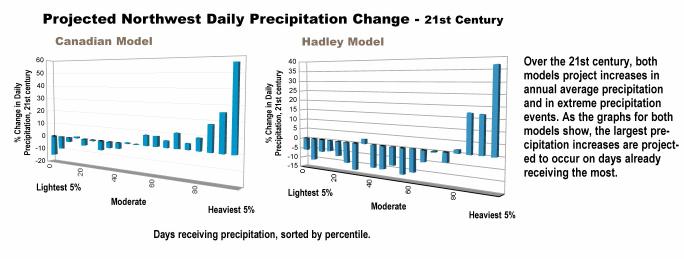
2 Introduction 1 In the relatively arid and semiarid western United States, modest changes in precipitation can have proportionally large impacts on water supplies (quantity & quality). In mountainous watersheds, higher temperatures would increase the ratio of rain to snow, accelerate the rate of spring snowmelt, and shorten the overall snowfall season, leading to more rapid, earlier, and greater spring runoff 2. The population in the Pacific Northwest is expected to increase 40 to 50 percent by Water supplies are expected to be stressed. Climate related products that traditionally provided averages and extremes should be expanded to include more statistics and modeling that can be used in a GIS environment.. Coping strategies should now be explored 3 Source: 1. ftp://ftp.wcc.nrcs.usda.gov/support/drought/dmrpt pdf

3 General Circulation Model Projections Source:
4 GCM Projections Source:
 anomalies in blue (red).")
5 Perpetual Jan MRF9 simulations of North American precipitation anomalies for varying positions of equatorial positive SST anomalies located in the (top) West, (middle) Central, and (bottom) East Pacific. Results are based on a 24- month ensemble average. Shading interval is every 1 mm day 21, with positive (negative) anomalies in blue (red). El Nino Position and Atmospheric Circulation Hoerling and Kumar, 2002 Journal of Climate
 1983. The year refers to the Jan of the season. The precipitation anomalies have been scaled by the amplitude of the EOF1 index for each case. Shading interval is 0.")
6 El Nino Strength and Atmospheric Circulation GCM ensemble winter (DJF) anomalies of North American precipitation for varying strengths of equatorial Pacific warm events during (top) 1980, (middle) 1958, and (bottom) The year refers to the Jan of the season. The precipitation anomalies have been scaled by the amplitude of the EOF1 index for each case. Shading interval is 0.1 mm day 21 with positive (negative) anomalies in blue (red). Hoerling and Kumar, 2002 Journal of Climate

7 Ref: Water 2025

8 Ground Water Dependency Ground water recharge rates vary from < 1 year near mountain / valley boundaries to >1000 years in mid basins. Contrasting Agriculture: In Wyoming, AG uses 80% of all water of which 90% of this amount is used in flood irrigation Evaporation exceeds precipitation by a 4 to 1 ratio in lower populated elevations

9 Pacific Northwest

10 Pacific Northwest National Forests

11 Pacific Northwest Maritime Continental Four levels of detail are included to show a hierarchy of ecosystems. The largest ecosystems are domains, which are groups of related climates and which are differentiated based on precipitation and temperature. Divisions represent the climates within domains and are differentiated based on precipitation levels and patterns as well as temperature. Divisions are subdivided into provinces, which are differentiated based on vegetation or other natural land covers. The finest level of detail is described by sub-regions, called sections, which are subdivisions of provinces based on terrain features. Also identified are mountainous areas that exhibit different ecological zones based on elevation.


12 Zone D, cold forest climates with severe winters Zone C, warm temperate rainy climates with mild winters Zone B, dry climates, covers the majority of the Snake River Plain, central Washington & scattered across eastern Oregon The second order category, f, refers to areas that see moisture in all seasons s, refers to areas that tend to have dry summers The third order categories represents a long hot summers b long warm summers c long cool summers

13
14 Pacific Northwest Physiographical 173 million acres (70 million hectares) Drainage Coast Ranges Puget Sound Willamette Valley Cascade Range Columbia Plateau in E. Central WA & N. Central OR Blue Mountains in NE OR & SE WA Oregon Closed Basin Snake Plateau of S. ID West Slopes of N. Rocky Mountains in MT, WY, ID, WA Source: Ecology and the Economy, A concept for balancing long range goals. The Pacific Northwest Example Prepared by Urban & Rural Lands Committee, Pacific Northwest River Basins Commission (November 1973)

15 Pacific Northwest
16 Demographics #10 #5 #11 #1 #2
17 Demographics
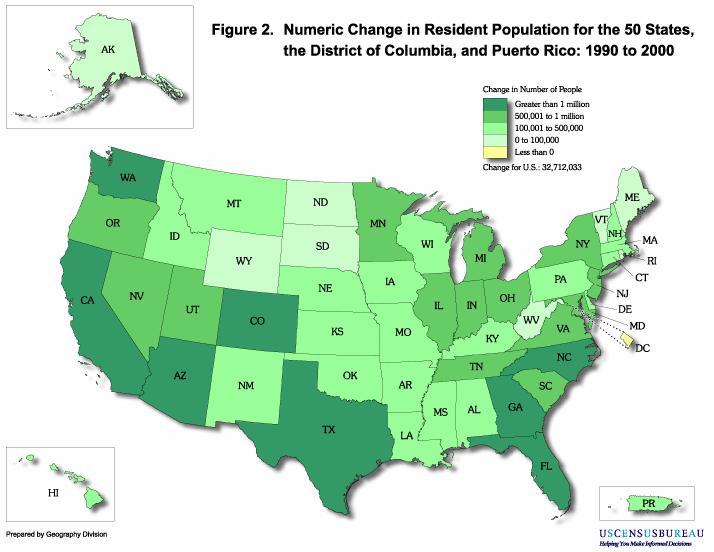
18 Population Change (selected western states) State Pop Gain % change Nevada 2,283, Arizona 5,581, Utah 1,252, California 12,573, Idaho 675, Washington 2,730, Oregon 1,412,
19 Projected Population Change

20 History: It s Cold Out There

21 Temperature vs. CO2
22 Climate Change Short to Medium Term Short Term Long Term

23 The Climate System

24 Past Climate (Wyoming Tree Ring Record)

25 Recent National Trends

26 Greening Earth ( ) This view of the greening of the Earth comes from satellite analysis of color spectra from the surface. Note the southeastern USA, which has `greened the most. That part of the USA has also cooled. Therefore, the greening in this area suggests CO2 fertilization. Source: Zhou & Myeni, JGR, 16 Sept 2001


27 Pacific NW Temperature Anomalies Washington Idaho During the 2 nd half of the 20 th Century, temperatures have shown lots of inter-annual variability Oregon


28 Pacific NW Precipitation Anomalies Washington Idaho 10.6% 5.2% Oregon During the 2 nd half of the 20 th Century, precipitation have also shown large inter-annual variability 7.3% Average annual statewide precipitation: Washington: Oregon: Idaho: 18.82
 13 23 30 38 51 76")
29 Present Climate PRISM ( ) cm


30 Present Climate Expected 6 month period Expected 3 month period
31 Climate Mechanics Timing is Everything Maintain Vegetation Health
32 Climate Mechanics Precipitation as Function of Elevation ~256,000 km 2 km 2 Resolution

33 Agriculture Production

34
35 Changing Agriculture
36 Changing Agriculture

37 Changing Landscape
38 Changing Landscape
39 Changing Agriculture
40 Changing Agriculture

41 From field tests: total moisture intake by plants is extracted by the plant's roots ~40% from surface to 6 inches ~30% from 6 to 12 inches ~20% from 12 to 18 inches ~10% from 18 to 24 inches 0 to 15 cm 15 to 30 cm 30 to 45 cm 45 to 60 cm Each soil type has an inherent "available water" holding capacity which can vary from 1.0 inch per acre foot for a loamy sand to 2.5 inches for a silty clay loam.

42
43 Climate Data & Conservation Practices Ref:

44 Mitigation (saving our land)
45 Mitigation (snow fences) (~1 m) (2.5 to 4.2 m)

46 Mitigation (drip irrigation)


47 Mitigation (Riparian Restoration) Vegetation is much more effective than structures. Vegetation heals itself and adjusts to changes in flow and landform. Structures are fixed in place and can easily fail if they are not maintained.


48 Puget Sound Area Urban Change Growth


49 Forest Clear Cutting in Northern California Coast Range

50 Coastal Landscape Analysis & Modeling Study Source:

51 Hydro meteorological Networks
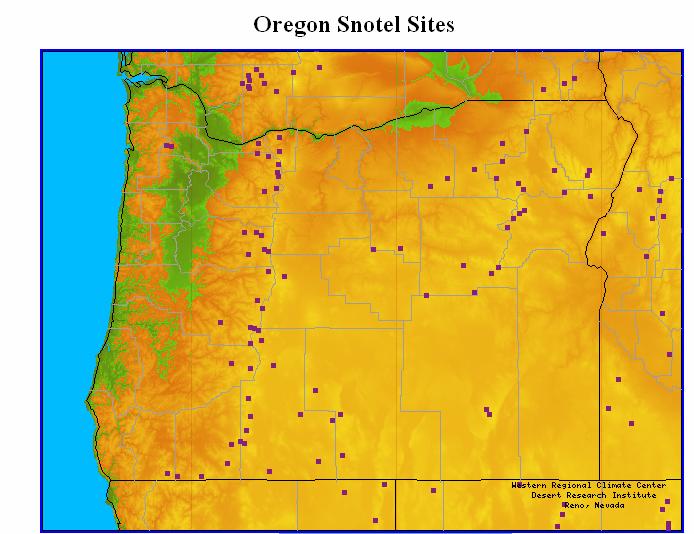


52 Hydro meteorological Networks

53 Hydro meteorological Networks

54 Limited but improving access to soil moisture data Oct Soil moisture depth-averaged %

55 Forage Production Non-Irrigated Lands
56 Prairie Grassland Dynamics Ref: Knapp, et al., Rainfall Variability, Carbon Cycling, and Plant Species Diversity in a Mesic Grassland (13 Dec 2002, Vol. 298 Science, pp ) Ref: Richard D. Alward, et al., Grassland Vegetation Changes & Nocturnal Global Warming Science Vol. 283, 8 Jan 99
57 Forecasting the Future (Possible Break-out Group Discussion) Modeling (GCM) what if scenarios (risk management) Analog Comparisons past similarities Denser surface-subsurface sensor networks More utility of remote sensing: (satellites - MSI, signal differential, radar, wind profiler) New product (new paradigm) based on: (fussy logic, artificial intelligence, GIS-IMS tools) Better education defining stakeholder requirements Weather Modification Clean Water Act Endangered Species Act (Compliance) Leverage Product funding with existing programs (e.g. Water 2025, Environmental Quality Incentives Program, etc.) ALSO, 1) Can we identify climate and hydrologic predictive skill at a range of time scales? How can this skill be exploited to the benefit of the water, wildfire and human health sectors? 2) What climate information is needed to inform decision makers in the water, wildfire and human health sectors? Suggested reading: (Pacific Northwest Ecosystem Research Consortium, Willamette River Basin Atlas, 2 nd edition)
58 In Conclusion The socioeconomic implications of both climate and non-climate impacts on water supply and demand will depend in large part on both the ability to adapt to change and on whether water managers and planners take action. With the uncertainties associated with increasing federal regulation of the environment, changing demographics and technologies, and budgetary realities, we need to re-examine infrastructure design assumptions, operating rules, and contingency planning under a wide range of climate conditions than has been traditionally performed. Maintaining options and building in flexibility are important for designing efficient water programs in the context of climate change. Additionally, future climate products need to incorporate all sensors (i.e., networks) data and be customized for each stakeholder s unique requirement.

59 Thank You! Dr Raymond Motha, President, CAgM Phil Pasteris, Local Host, NRCS, National Water and Climate Center, Jan Curtis, Local Host, NRCS, National Water and Climate Center,