Source: regional government planning documents, official forecasts
|
|
|
- Agatha Parks
- 5 years ago
- Views:
Transcription
1
2 Annual energy (GWh) +43% by 2030, by country Peak demand (MW) +52% by 2030, by country Source: regional government planning documents, official forecasts
3 Morupule B operated <300MW for most of 2016 Botswana average daily demand was MW in the same period Source: Data obtained by Mott MacDonald staff from the National Control Centre (NCC) at Segoditshane Substation in Gaborone, Botswana on 4th August 2016
 at Segoditshane Substation in Gaborone, Botswana on 4th August")
4 Botswana native generation supply and imports, Source: Data obtained by Mott MacDonald staff from the National Control Centre (NCC) at Segoditshane Substation in Gaborone, Botswana on 4th August 2016

5 Botswana demand projected to grow strongly Morupule B hourly generation curve plotted against load forecasts 1,800 1,600 1,400 MW 1,200 1,000 Balance will need to be met by reliable new capacity or imports forecast low 2012 forecast likely 2012 forecast high 2016 forecast low 2016 forecast likely 2016 forecast high Historical data Source: BPC demand forecasts, 2012, 2o16 Source: Mott MacDonald analysis
 Non-dispatchable capacity (such as solar or wind power) is often not considered in capacity planning as it may not be available at")
6 Match long-term growth in peak demand against committed dispatchable capacity. Traditional capacity planning approach (dispatchable power only) Non-dispatchable capacity (such as solar or wind power) is often not considered in capacity planning as it may not be available at system peak Demand-supply balance grows tight, even assuming new projects are delivered Source: Mott MacDonald analysis
7
8 USD M 90,000 Zimbabwe USD8.8bn (50% of 2016 GDP) South Africa USD57.4bn Namibia USD4.2bn Zambia USD5.9bn Botswana USD1.8bn: 100MW solar w. storage 2019 Morupule B (5&6) MW gas CCGT ,000 70,000 60,000 50,000 40,000 30,000 20,000 10, Botswana Zimbabwe Namibia Zambia South Africa Source: regional government planning documents, official forecasts
9
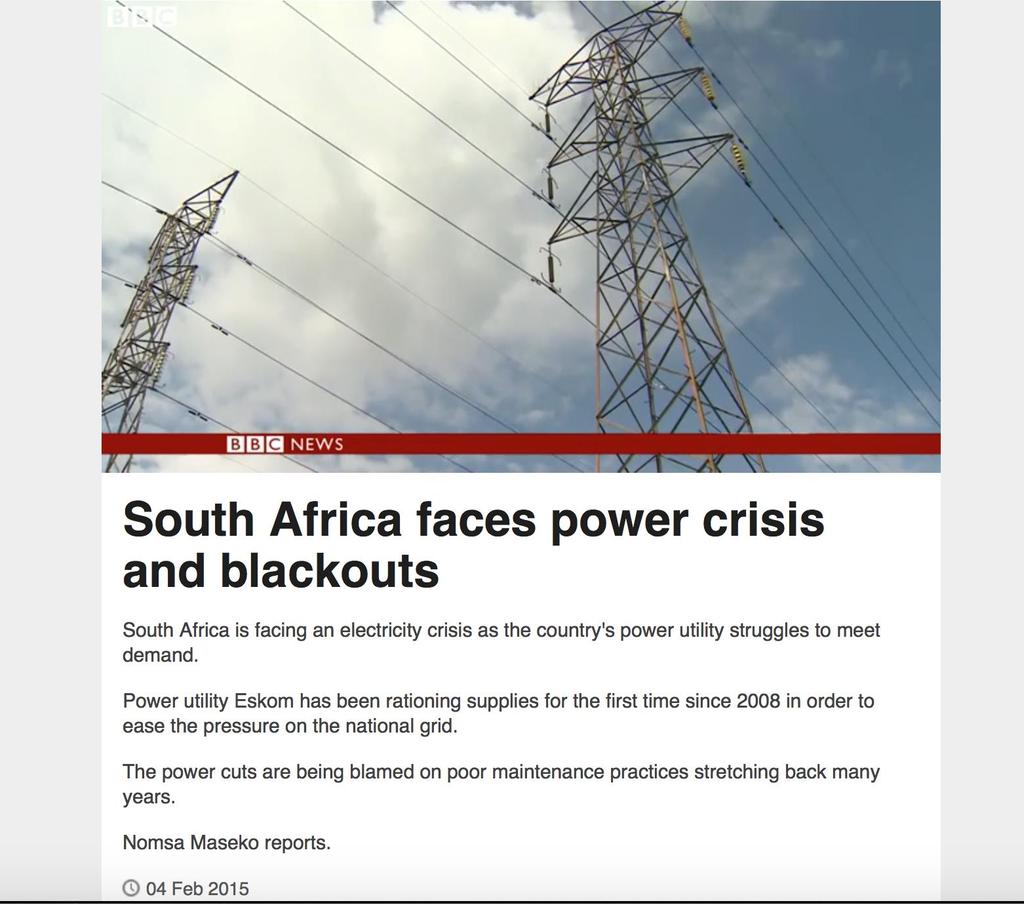
10 GWh We analysed 3- and 5- year delays to new capacity, which could lead to severe power shortages in the next decade Power markets move in cycles of 1) supply surplus, 2) under-investment, then 3) deficit. The current Eskom supply overhang and cheap tariffs will not last Eskom was in major supply deficit in 2008 and again in , , , , , , , ,000 50, Annual energy demand Annual energy sent out (3 year slippage) Annual energy sent out (planned) Annual energy sent out (5 year slippage) Source: regional government planning documents, official forecasts, Mott MacDonald analysis
11
12 As part of the study, estimates of local and import tariffs were calculated in USD-equivalent terms (Table 1-1). Noting that legacy tariff structures are typically sub-economic, and that some utilities are in financial distress and have sought redress from their regulators in the form of future tariff increases, these tariffs serve as a snapshot of the current situation (as can be ascertained from available information). The future levels of tariffs are highly uncertain, but current levels provide a conservative benchmark for potential market new entrants. Table 1-1: Summary of SAPP Tariffs [MM] Country Average Indigenous Generation Tariff in USc/KWh Average Import Tariff in USc/kWh Large customer Tariff in USc/kWh Botswana unknown Zimbabwe 3.0 to 6.5* South Africa unknown 4.9** 5.43 Namibia unknown Zambia unknown Average Regional Tariff unknown Source: [MM] *Large hydro and Hwange coal **Predominantly Cabora Bassa Low tariffs currently provide a disincentive for investment in new generation capacity in the Source: Mott MacDonald analysis of regional data region. However, given that utilities are under financial strain as a result of cost under-recovery, it is hard to see the presently low levels of tariffs continuing beyond the short-term. For example, Eskom has recently, successfully applied to its national regulator, NERSA, to recover costs from prior year financial losses, which will be recouped in future year tariff increases. In the case of Botswana Power Corporation (BPC), current tariff levels are sub-economic, non-cost reflective

13 BPC tariff levels versus operating costs Tariffs would need to rise by up to 80% for BPC to recover costs Source: BPC Annual Report, 2017
14 BPC net operating profit/loss and Government tariff subsidy grant BWP 10bn (USD 1bn) required during Source: BPC Annual Report, 2017
15
16
17
18

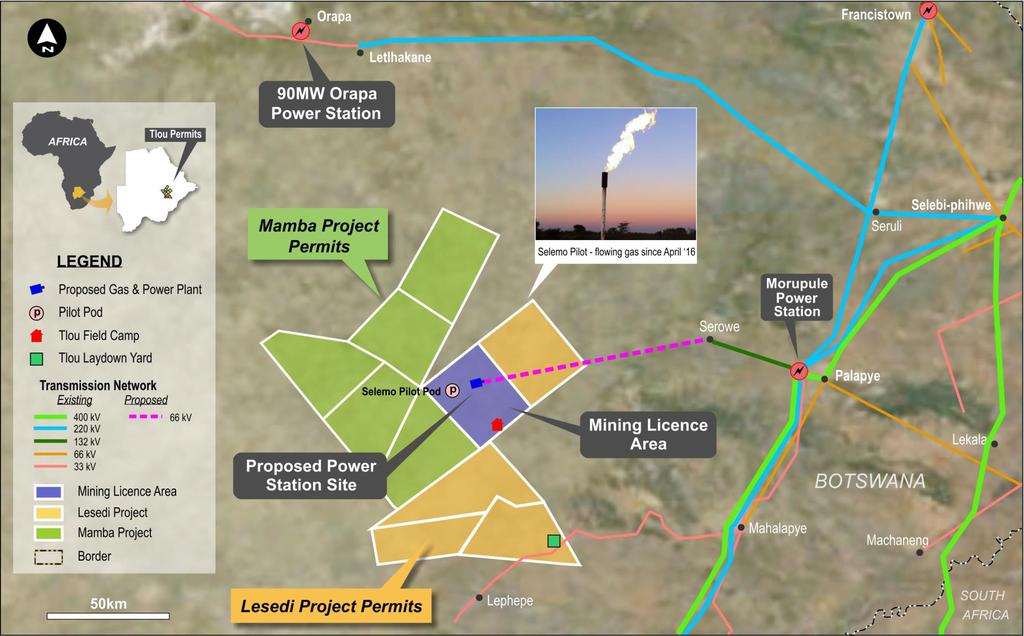
19 The Company extracts CBM natural gas from coal, using horizontal drilling techniques. This CBM gas can then be used for electricity generation. Tlou s CBM extraction method Dual Lateral Pods, each comprising one vertical and two horizontal wells Proven technology Minimum footprint allowing agricultural use of land to continue No fracking required CBM can replace high carbon producing power generation such as diesel and coal fired power
20 2012 First Contingent Gas Resources 2014 First Gas 2016 Upstream Environment approval 2018 Significant Increase in Gas Reserves and Contingent Resources First Gas Reserves 2009 Botswana operations commenced 2013 ASX Listing 2015 Increased Contingent resources AIM Listing 2017 First gas fired power produced for field use Development (Mining) Licence granted BSE Listing and Placing to leading fund manager, African Alliance
21 For Investors For Botswana Leading CBM project in the region Creates vital direct and indirect employment Significantly de-risked Enormous potential upside as the project moves into development and generates first revenue Energy security by removing the need to import expensive power Develops a new industry to diversify the economy Much larger projects planned post the initial 10 MW Delivers further royalties and taxes to the Government
22 Sufficient Reserves already in place for initial project development Further Reserves and Resources in place for significant expansion 2P Gas Reserves in place: ~41 BCF 3P Gas Reserves in place: ~427 BCF 3C Contingent Resources ~3,043 BCF a 10 MW project for 25 years would require: Approx. 28 BCF 1 a 100 MW project for 25 years would require: Approx. 274 BCF 1 This is sufficient gas 1 for 300 MW for 40+ years, based on a 50% recovery factor 1. Billion Cubic Feet, based on 1 MW of power being produced from 300,000 standard cubic feet of gas per day.

23 Develop up to 10 MW of power: Targets first revenue while minimising initial capex requirement Sufficient gas reserves already in place Achieves grid connection and facilitates simple expansion Easily integrate solar generation Strategy: Drill pilot wells sufficient for the first 2 MW Complete environmental approval for transmission lines and power generation assets Construct transmission lines and install generators Connect to local Botswana grid Sell power via an agreed Power Purchase Agreement or on the regional spot market