State of the Power System. Mr Paul O Flaherty Finance Director 16 February 2012
|
|
|
- Duane Jordan
- 5 years ago
- Views:
Transcription


1 State of the Power System Mr Paul O Flaherty Finance Director 16 February 2012
2 Disclaimer This presentation does not constitute or form part of and should not be construed as, an offer to sell, or the solicitation or invitation of any offer to buy or subscribe for or underwrite or otherwise acquire, securities of Eskom Holdings Limited ( Eskom ), any holding company or any of its subsidiaries in any jurisdiction or any other person, nor an inducement to enter into any investment activity. No part of this presentation, nor the fact of its distribution, should form the basis of, or be relied on in connection with, any contract or commitment or investment decision whatsoever. This presentation does not constitute a recommendation regarding any securities of Eskom or any other person. Certain statements in this presentation regarding Eskom s business operations may constitute forward looking statements. All statements other than statements of historical fact included in this presentation, including, without limitation, those regarding the financial position, business strategy, management plans and objectives for future operations of Eskom are forward looking statements. Forward-looking statements are not intended to be a guarantee of future results, but instead constitute Eskom s current expectations based on reasonable assumptions. Forecasted financial information is based on certain material assumptions. These assumptions include, but are not limited to continued normal levels of operating performance and electricity demand in the Distribution and Transmission divisions and operational performance in the Generation and Primary Energy divisions consistent with historical levels, and incremental capacity additions through our Enterprises division at investment levels and rates of return consistent with prior experience, as well as achievements of planned productivity improvements throughout our business activities. Actual results could differ materially from those projected in our forward-looking statements due to risks, uncertainties and other factors. Eskom neither intends to nor assumes any obligation to update or revise any forward-looking statements, whether as a result of new information, future events or otherwise. In preparation of this document we used certain publicly available data. While the sources we used are generally regarded as reliable we did not verify their content. Eskom does not accept any responsibility for using any such information. 2
3 Contents 1. Background 2. Summary of the system 3. The maintenance challenge 4. State of the system 5. Partnership approach 6. Capacity expansion programme 7. Integrated resource plan (IRP) 8. Funding plan 9. Conclusions and highlights of the state of the nation address 3
4 Background The objectives of today s engagement session is to address the following areas of business on a Q&A basis: Security of the supply system; Capital expenditure; and Funding 4
5 Summary of the state of the system South Africa s power system will be tight for the next few years: the next two years are critical We have kept the lights on since 2008 but balancing supply and demand has been a challenge Most power stations are in their mid-life and require increased maintenance; however, maintenance has constantly been shifted in order to ensure we can meet demand Strategy of shifting maintenance outages can no longer be sustained. Summer is maintenance season in Eskom. System is being run at higher levels of risk to tackle backlog and keep up with maintenance while at the same time meeting demand Energy demand year to date has been lower than originally forecast, but summer peaks are higher than expected Supply also constrained by unreliability of some stations and power imports This summer has seen significantly increased use of open cycle gas turbines and other reserves to balance supply and demand 5
6 Forecast of annual electricity gap T W h is e q u iv a le n t to ~ M W b a s e lo a d c a p a c ity Source: Medium Term Risk Mitigation Plan (2009) This forecast assumed that all planned supply and demand levers were put in place 6
7 We took action to address the challenges we identified at the beginning of 2011 What we said We would improve coal handling and coal quality to reduce load losses We targeted to improve generation output by 1%-2% over three years We would sign up about 400MW of cogeneration and own generation by April 2011 We needed to undertake significant maintenance during summer Demand-side management programme in place to reduce demand and energy savings We would communicate with our stakeholders on the state of the system What we did Coal-related load losses have shown an improving trend over the past few months but still a concern at three stations Comparing December 2011 YTD with the same period in 2010, the EAF performance deteriorated slightly by 0.9%. The Duvha unit 4 incident was a major setback in improving performance. The Generation division also undertook a lot more planned maintenance during the December period as compared to previous years. 373MW MTPPP signed up (320MW operational) 515MW of municipal generation contracted (270MW operational). Additional 100MW signed up on short term contracts of which 90MW is available 20MW additional MTPPP which is operational. Critical maintenance has been prioritised. PCLF of 15.5% achieved during the lowest demand period in December. Realised energy savings of 198.6GWh during the third quarter. Also signed up pilot demand response aggregator to achieve 500MW by mid Extensive programme of engagement with stakeholders 7
.")
8 Review of system status in the last quarter Week Start MW MW Week Forecast Operational Surplus/ Deficit Planned Status Actual Status A green week indicates that demand and all reserve requirements can be met with all installed capacity (including the Open Cycle Gas Turbines). 21-Nov Nov Dec Dec Dec Dec Jan Jan A yellow week indicates that there is up to 1,000 MW shortage of meeting the demand and reserves. There is an increased probability of requiring some emergency reserves to meet the peak demand A orange week indicates that there is between 1000 and 2000 MW shortage of meeting the demand and reserves. There is a high probability of requiring substantial emergency reserves to meet the peak demand 16-Jan We have been making increased use of open cycle gas turbines There is still a significant maintenance backlog The actual system status has been worse than planned due to worse than expected performance from the generation fleet and from Cahora Bassa. A significant amount of maintenance has also been done 8


9 Generation performance needs to improve Full and Partial Load Losses: May January 2012 Eskom provides a 3 600MW allowance for unplanned outages and production losses in its generation fleet, to cushion the system Unplanned outages have been running at higher levels this month: main factors are boiler tube leaks, poor coal quality at some stations; excessive heat impairing performance at dry cooled stations Outage delays after long duration outages also contribute to increased unavailability
10 What is different from 2008? There are better emergency preparedness and communication processes and structures in place. The system status is shared regularly with customers through various platforms. Large customers get twice daily updates. Coal stockpiles have been replenished and are at healthy levels. There is much tighter co-ordination between the System Operator and Generation to ensure trade-offs between system stability and maintenance requirements. However this is not sustainable. There is better visibility of the power system status by Eskom management and Government to ensure better situational awareness and quicker response. The system is at risk but if the incidents materialise the aim is to contain the impact to short periods of time. 10
11 What has happened since 2008? Supply side 2 537MW of new capacity has been added MW of capacity signed up from IPPs and municipal generators Primary Energy Coal stockpiles moved from 12 days to just over 40 days 15 million litre diesel storage facility hired in Cape Town Demand side 1 634MW of verified savings since projects to upgrade pumps, motors, fans and lighting at industrial installations, mines and commercial buildings Emergency preparedness Approval of load shedding and critical load management protocol (NRSO48) Deployment of structures and protocols during the 2010 FIFA World Cup and COP 17 Communication Power Alert campaign on SABC and e-tv. 49Million campaign 11


12 The maintenance challenge

 38,000 36,000 34,000 32,000 30,000 28,000 26,000 24,000 22,000 Typical Winter Day Typical Summer Day Summer load")
13 Summer is maintenance season We do planned maintenance in summer, when demand is lower, so that maximum capacity available in winter. Maintenance season is usually from September to around mid-may, but this year some maintenance was done during winter A colder-than-expected winter puts added pressure on the system: for every 1 degree Centigrade decrease in winter temperature, electricity demand increases by MW during the evening peak; a warmer than expected summer increases air-conditioning load and demand can increase by up to 400 MW Typical winter and summer load profiles Peak demand (MW) 38,000 36,000 34,000 32,000 30,000 28,000 26,000 24,000 22,000 Typical Winter Day Typical Summer Day Summer load profile is much flatter, peak of MW, so if there is a constraint, system is constrained for entire day Peak demand at MW, compared to last year s summer peak of MW (and last year s winter peak of MW) 20,000 23:00 02:00 05:00 08:00 11:00 14:00 17:00 20:00 23:00 02:00 13
 Duration (days) General overhaul (GO) 6-12 40-60 Interim repairs (IR) 2-3 14-35 Mini general overhaul (MGO) 6 28 Boiler")
14 The preventative maintenance challenge A typical coal-fired generating unit requires certain necessary routine maintenance to ensure that it meets its technical performance requirements, is safe to operate and does not violate any environmental laws Activity Cycle time (years) Duration (days) General overhaul (GO) Interim repairs (IR) Mini general overhaul (MGO) 6 28 Boiler inspection (BI) Statutory inspection and test (ST) 6 35 Main steam pipe work 120 GO IR BI + ST MGO 18 months 18 months 18 months 18 months 18 months 6 months BI MGO IR 14

15 History of system status in order to accommodate planned maintenance Year Maintenance % MW Backlog units In 2010 and 2011 the system was run much closer to the red line compared to 2009 in order to address the plant maintenance requirements. However, the total amount of maintenance work done was insufficient and hence a maintenance backlog has developed Arnot Hendrina Kriel Matla Duvha Tutuka Lethabo Matimba Kendal Mid - Life Age 50 * The surplus categorisation is revised in accordance with system changes 15
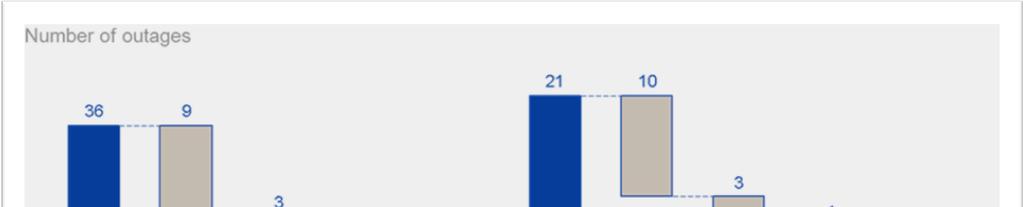
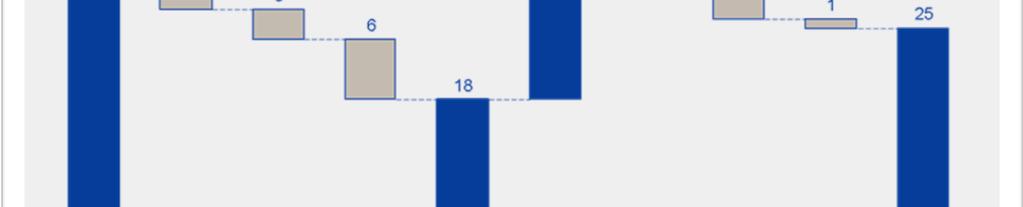
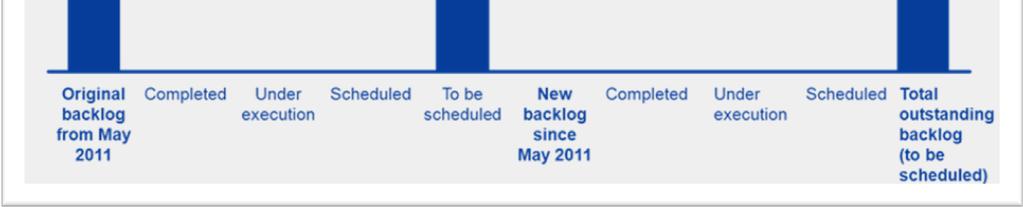
16 Current maintenance backlog 16
17 2012 maintenance challenge Capacity available for maintenance excluding Liquid-fuel Open Cycle Gas Turbines (OCGTs) Capacity available for maintenance including Liquid-fuel Open Cycle Gas Turbines (OCGTs) MW 0 13-Jan 13-Feb 13-Mar 13-Apr 13-May 13-Jun 13-Jul 13-Aug 13-Sep 13-Oct 13-Nov 13-Dec Maintenance Cap available for maint Excl Gas Cap available for maint Incl Gas Required Planned outage requirements exceed the capacity available for maintenance So liquid-fuel open cycle gas turbine usage and demand-side management become critical The goal is a maintenance ratio of 10% of capacity, including 3% to address the backlog: Actual achieved at the end of December 2011 is 15.62% and 8.14% for the financial YTD at 16/01/12. Planned outages are ranked on scope and risk, to enable prioritisation of outages within the available capacity Lower risk outages (inspections and interim repairs) have had to make way for high-risk, highpressure pipe-work replacements, low-pressure turbine blade inspections and major refurbishment outages All deferred outages are monitored for risk until they can be accommodated 17


18 The state of the system
19 Demand has been below expectations The peak demand and total energy sent out for 2010 was almost back to levels seen in 2007, before the recession The summer demand in 2011 was generally higher than that previously experienced. However there was a drop in the winter load compared to that expected. The peak demand for 2011 was MW at the end of May, including non-eskom generation. This is marginally higher than the MW peak in 2010 but lower than our forecast of MW for last winter. The forecast 2012 winter peak is also about MW Weekly peak demand (Incl non-eskom sales to Eskom) 2011 (Eskom Sent Out) Peak Demand (MW) Week number 19

20 Constrained generation trends OCGT usage In 2011 we used our OCGTs more to ensure that as much as possible maintenance is done while keeping the lights on. However there is still a maintenance backlog. 20
21 Expected system status Date Maintenance Excess Capacity available assuming use of 2238MW of OCGT capacity, required 3600MW unplanned allowance, required Operating Reserves and Forecast Excess Capacity available assuming use of 2238MW of OCGT capacity, required 4500MW unplanned allowance, required Operating Reserves and Forecast 13-Jan-12. Fri Jan-12. Fri Jan-12. Thu Jan-12. Tue Feb-12. Tue Feb-12. Mon Feb-12. Mon Mar-12. Thu Mar-12. Mon Mar-12. Wed Mar-12. Thu Mar-12. Mon Apr-12. Tue Apr-12. Tue Apr-12. Tue Apr-12. Wed May-12. Wed May-12. Mon May-12. Mon May-12. Thu May-12. Mon Jun-12. Thu Jun-12. Thu Jun-12. Thu Jun-12. Wed Jul-12. Mon Jul-12. Mon Jul-12. Wed Jul-12. Mon Jul-12. Mon With all gas we should be operating in the green. Our normal planning assumption is 3 600MW unplanned with 4 500MW being a risk assessment. It is clear that without deferring maintenance, the system status is more risky. 21
22 Required capacity to ensure stable system operation Ideally, 3 000MW of committed capacity from supply and demand initiatives is needed immediately to keep the lights on and enable maintenance to continue. Reducing this target will require an adjustment to the maintenance programme. Between now and end-december 2013, the minimum targets set out in the table below need to be achieved to prevent an emergency. Immediate (within 1 month) (MW) By July 2012 (MW) and sustained to end December 2013 High load factor initiatives to bring certainty to maintenance planning Pre-Emergency/ Contingency/Peaking initiatives
23 Way forward Eskom has set up a recovery team to: Execute the plan to secure identified and approved demand and supply levers. Step up communications to encourage greater energy efficiency. Be clear about our maintenance philosophy and the governance processes to manage risk and specify operating envelopes for power generation plants. Implement an effective outage strategy, using maintenance windows to reduce the backlog, deal with emerging risks and conduct scheduled, design-based maintenance. Implement a more sustainable maintenance philosophy throughout the generation fleet. The Department of Public Enterprises will establish a task team with Eskom to develop the detailed delivery schedule and review progress, coordinate activities that require Government intervention, prepare updates for Cabinet and align communication and stakeholder plans. 23
24 What have we done? Signed power purchase agreements (PPAs) with the two municipalities to secure baseload generation. Secured available non-eskom generation from customer base on a short-term basis. Signed power buyback agreements, where we were able to remove base demand off the system, while some were deferred to the winter period. Obtained voluntary co-operation over peak periods from large customers (at least 400MW) Identified possible cross-border generation - engagements are currently taking place. 24
25 Supply and demand side initiatives Short Term Initiatives November February 2012 Target Capacity (MW) Secured Capacity (MW) Actual Available (MW) Status Municipal Baseload Power Contracts ends 29 Feb 2012 MTPPP s (Additional) Contracts ends 29 Feb 2012 IPPs and short -term base load (additional) Contracts ends 29 Feb 2012 Additional 17 MW available 01 Feb 2011 Non Eskom Peaking Generation Original target 160 MW, some capacity falls outside mandate. 40 MW awaiting finalization. Expected 01 February Cross Border MW on track for target date 01 July 2012 Power Buy Back 1000 (accumulative) 220 (accumulative ) MW available till 28 February MW available until 12 February Additional DMP A further 127 MW Supplemental and 42 MW Instantaneous awaiting finalization EDMP Nothing secured to-date DRAPP On track to secure 500 MW by 31 July 2012 Mandatory ECS DoE pronouncement on implementation of ECS Alternative initiatives: Stand-by customer generation, Mandatory DMP, Mandatory ECS, Mobile diesel generation, Coal quality improvement, State agencies building efficiency, Regional gas options. 25
26 Energy Conservation Scheme (ECS) Performance as at 31 October 2011 Since July 2008, Eskom introduced the voluntary Energy Conservation Scheme to its top 250 customers 133 of the customers signed off their baselines (reference consumption) 95 of the customers with signed-off baselines are key industrial customers ECS performance for rolling 12-month period (Nov 10 to Oct 11) Eskom total Key industrial customers Historical Consumption of Top 250 Eskom Customers (GWh) Adjusted Historical Consumption of Top 250 Eskom Customers (GWh) % Savings Requirement based on Adjusted Historical Consumption Allocation of all targeted customers (GWh) Actual consumption of all targeted customers (GWh) Savings from allocation - all targeted customers (GWh) Savings from allocation - all targeted customers (%) 1.0% 4.2% Savings from Allocation- customers with signed off baselines (%) 6.4% 6.9% Munic Annual Consumption (GWh)
27 Partnership approach


28 Partner with us 49M is an Eskom initiative, supported by government, spurring an urgent need for all 49 million South Africans to embrace energy saving as a national culture, joining the global journey towards a sustainable future 49M campaign launched by Eskom and Government to create energy efficiency culture and calls for a 10% reduction in electricity usage Energy efficiency is not only a national concern, it is a global concern. 28
29 Capacity expansion programme
 New coal Peaking & renewables Mpumalanga")
 Kusile (4 800 MW) Ankerlig (1 338.")


30 Capacity expansion programme Primary Energy Generation Transmission Distribution & customer service Construction Return-to-service (RTS) New coal Peaking & renewables Mpumalanga refurbishment Transmission Komati (1 000 MW) Camden (1 520 MW) Grootvlei (1 180 MW) Medupi (4 764 MW) Kusile (4 800 MW) Ankerlig ( MW) Gourikwa (746 MW) Ingula (1 332 MW) Sere (100 MW) Arnot capacity increase (300 MW) Matla refurbishment Kriel refurbishment Duvha refurbishment 765kV projects Central projects Northern projects Cape projects MW MW MW 300 MW ~ km Commissions of new stations Medupi Kusile Ingula First Unit Last Unit ~ MW of new capacity (5 501 MW installed and commissioned) ~ km of required transmission network ( km installed) MVA planned ( MVA installed) Medupi is the first coal-generating plant in Africa to use supercritical power generation technology 30
 To date, a large amount of construction work has been completed, adding")


, Komati U4 (100MW) & Camden U6 (20MW)")
31 Build progress to date (as at ) To date, a large amount of construction work has been completed, adding ~5,501MW, 3,747.6 km of transmission network, and ~17,945 sub-stations... Megawatts MW of capacity ,770 1,351 1,043 5, Transmission Km line ,747.6 Substations MVAs 5,280 1,090 1,000 1,355 1,375 1,630 5, ,945 FY 2004/5 FY 2005/6 FY 2006/7 FY 2007/8 FY 2008/9 FY 2009/10 FY 2010/11 FY 2011/12 Total Note: 280MWs reported include Gvl U6 (160MW SHC), Komati U4 (100MW) & Camden U6 (20MW) which are included in the GC Incentive Scheme Source: Eskom Group Capital Division (Construction Management)
 225 200 425 Arnot capacity upgrade (coal fired) 30 30 Medupi (coal fired) 794 794 1588 794 794 4 764 Kusile (coal fired) 800 800 800 800 1600 4 800 Ingula (pumped storage) 1 332 1 332 Sere")
32 Current planned capacity expansion plan Projections Project 11/12 FY 12/13 FY 13/14 FY 14/15 FY 15/16 FY 16/17 FY 17/18 FY 18/19 FY Total Grootvlei (return to service) Komati (return to service) Arnot capacity upgrade (coal fired) Medupi (coal fired) Kusile (coal fired) Ingula (pumped storage) Sere wind farm (renewable) TOTAL (MWs) In addition, Eskom has commenced the development of a 100MW CSP plant 32


33 Medupi update As announced on 11 October 2011, Eskom initiated a detailed assessment of the timelines for the first unit of Medupi (Unit 6), which was due to deliver first power to the national grid in late 2012; We said the schedule was at risk Main concern is the unit s boiler, which is being built by a consortium comprising Hitachi Power Africa and Hitachi Power Europe. We are working closely with the parent company in Japan and Hitachi has put remedial measures in place to mitigate the risks Hitachi has made commitments to enable Unit 6 to deliver first power to the grid by May 2013 in line with the Integrated Resource Plan Other contractual arrangements arising out of the delay are being addressed 33
34 Integrated Resource Plan (IRP 2010)


35 SA national planning process - driven by Regulations on New Generation IRP Feasibility IPP Procurement PPA Fund Build Background The IRP determines which technologies will be built A feasibility study is conducted and IRP capacity is allocated to the most suitable; IPPs or Eskom Suitable IPPs are procured through the IPP procurement process Buyer of electricity signs Power Purchase Agreements (PPAs) with power producer IPPs often require PPAs prior to obtaining external funding. Such PPAs will require government backing Building for Eskom or IPPs can only commence once investment decision has been taken Responsible DoE DoE - According to New Generation Regulations DoE / Single Buyer Office Minister must assign a buyer of each PPA Eskom, IPPs Eskom, IPPs Status Regulations state new generation capacity must be represented in the IRP to receive generation and distribution licenses or receive a Section 34 exemption from the minister This process has not yet been executed and is required for subsequent planning actions The IPP procurement process must be finalised to ensure participation of these producers Currently, the Single Buyer Office is ring-fenced within Eskom to sign PPAs based upon the DoE procurement decision Eskom may receive funding with government backing. Costs are recovered via the MYPD submissions electricity tariff Construction of IRP projects may be delayed due to required upstream decisions 35
36 IRP outcomes Policy-Adjusted IRP Total additional new capacity (without committed) until 2030 in GW % 23% 6% 6% 9% 42% 17,8 Share of total new GW ,3 9,6 2,6 2,4 3,9 8,4 1,0 8,4 Solar PV CSP Wind Coal Nuclear Hydro Gas - CCGT Peak - OCGT Renewables 10,1 0,0 0,05 0,0 1,0 1,0 35,5 1,8 2,1 0,0 2,4 0,0 Energy share in 2010 in 2030 Σ = 260 TWh Σ = 454 TWh 90% 5% 5% 0% < 0,1% 0% 65% 20% 5% 1% < 0,1% 9% 36


37 Capacity in 2030 Committed 1125 New Existing 1800 New Existing Committed Decomm. (10902) New
38 Funding Update
39 Funding plan R300 billion to 2017 as at 31 December 2011 Source of funds Funding sourced Rbn Currently secured Rbn Draw-downs to date Rbn Amount supported by Government Rbn Bonds Commercial paper Export Credit Agency backed World Bank loan AFDB loan DBSA loan Shareholder loan Other sources Totals Percentages 75.1% (1) 43.1% (2) 41.2% (2) (1) As a percentage of the R300bn funding sourced (2) As a percentage of the currently secured total 39

40 Conclusion and highlights of state of the nation address relevant to Eskom
41 Conclusions South Africa s power system will be tight for the next few years: the next two years are critical. Summer is maintenance season in Eskom. System is being run at higher levels of risk to tackle backlog and keep up with maintenance while at the same time meeting demand. Strategy of shifting maintenance outages can no longer be sustained. Government, Eskom and business have been working together in the last 2 years to develop solutions. Some have been implemented while others need to be accelerated. We need a partnership approach and need the support of all our citizens and customers. We need all the IPPs to generate either for themselves or through a PPA. Eskom is supporting and will continue to support this process. We need to save 10% of our current energy demand and remove 3000MW from our demand to ensure that the power system can be operated in a stable mode and that adequate maintenance is done on the generation fleet to provide safe and sustainable performance. 41
42 Highlights of State of the nation address by President Zuma There is an on-going concern from business and communities about high electricity costs. The President says he has asked Eskom to seek options on how the price increase requirement may be reduced over the next few years, in support of economic growth and job creation. The President said we need an electricity price path which will ensure that Eskom and the industry remain financially viable and sustainable, but which remains affordable especially for the poor. However to achieve sustainability, a pact will be required with all South Africans including business, labour, municipalities, communities and all customers and suppliers to save electricity. The President added that for the next two years, until the Medupi and Kusile power stations come into operation, the electricity system would be very tight. All South Africans should play our part in order to avoid load shedding. To increase energy capacity the government would continue to search for renewable energy sources, especially solar electricity and biofuels. 42


43 Thank you