Land Conservation & Chesapeake Restoration
|
|
|
- Clarissa Nelson
- 5 years ago
- Views:
Transcription

1 Land Conservation & Chesapeake Restoration Peter Claggett Research Geographer, U.S. Geological Survey Coordinator, CBP Land Use Workgroup May 17, 2018 Maryland Land Conservation Conference Linthicum Heights, Maryland
2 Population (millions) Chesapeake Bay Watershed PopulationTrends 2010 population = 17.4 million 2025 population = 19.4 million (11.5% increase) Year

3 2010 Housing 1940 Density Housing Density Counties Chesapeake Bay Census Total Housing Units Units per Acre Updated analysis following methods outlined by Hammer, et al., 2004.
4 Crediting Land Conservation and Planning in the Bay TMDL Reducing non-point sources of pollution to the Bay requires: 1. Changing land cover conditions; or 2. Changing land management; or 3. Installing engineered solutions to reduce pollution. Land conservation and land use planning can improve water quality by: 1. Installing, monitoring, and maintaining Best Management Practices (BMPs) on conserved lands (e.g., planting trees in the riparian zone); 2. Reducing the future conversion of land to more polluting land uses e.g., placing an easement on land that would otherwise be developed. 3. Soliciting restoration investments on conserved lands that are strategically located to intercept pollutants before they enter streams and waterways (e.g., precision conservation).
5 Crediting Land Conservation and Planning in the Bay TMDL Reducing non-point sources of pollution to the Bay requires: 1. Changing land cover conditions; or 2. Changing land management; or 3. Installing engineered solutions to reduce pollution. Land conservation and land use planning can improve water quality by: 1. Installing, monitoring, and maintaining Best Management Practices (BMPs) on conserved lands (e.g., planting trees in the riparian zone); 2. Reducing the future conversion of land to more polluting land uses e.g., placing an easement on land that would otherwise be developed. 3. Soliciting restoration investments on conserved lands that are strategically located to intercept pollutants before they enter streams and waterways (e.g., precision conservation).

6 Airshed Model Watershed Model Land Change Model Water Quality Model Chesapeake Bay TMDL Models
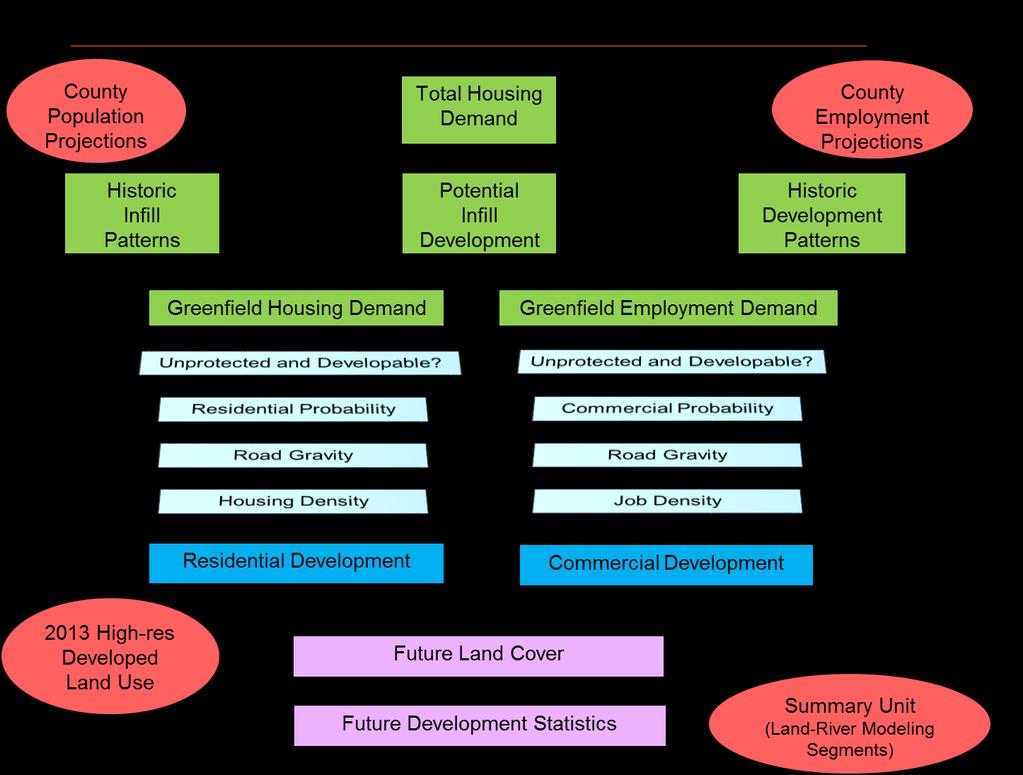
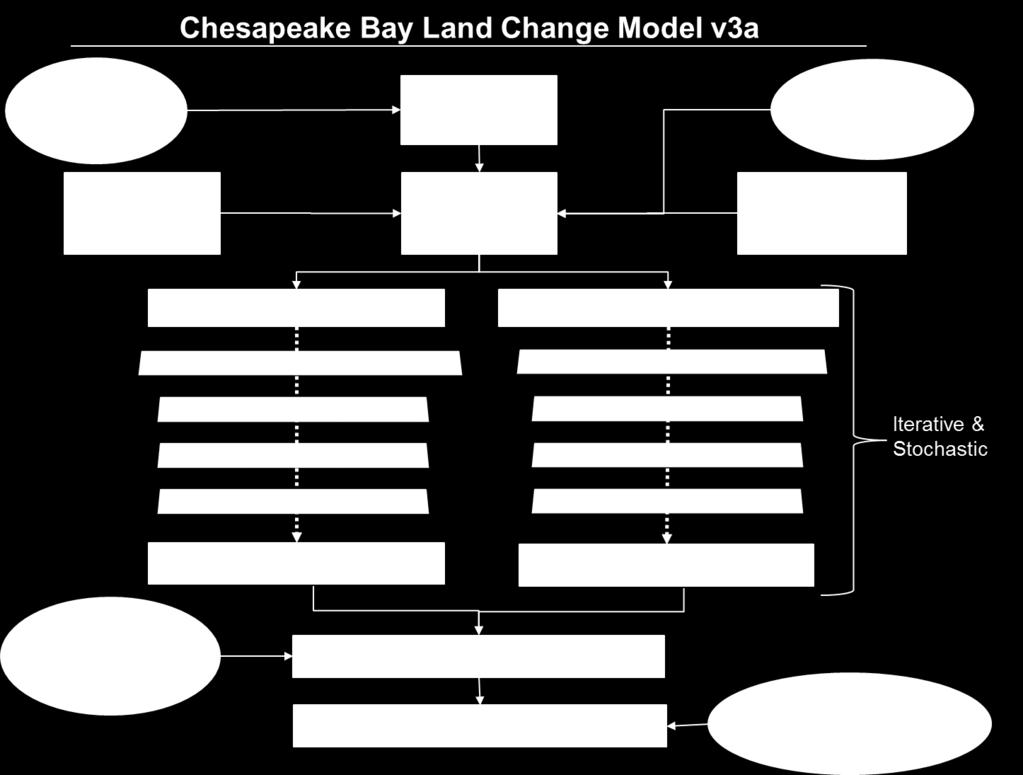
7 County-level Population Projections Chesapeake Bay Land Change Model v3a Total Housing Demand County-level Employment Projections Historic Infill Patterns Potential Infill Development Historic Development Patterns Housing Land Demand Employment Land Demand Iterative & Stochastic Residential Development Commercial Development Present Land Cover Future Land Cover Future Development Statistics Summary Units (P6 modeling segments)
8 Partnership s Chesapeake Bay Land Change Model 8

9 Residential Infill & Redevelopment Rates
10 Commercial Infill & Redevelopment Rates
11 Proportion of Residential Growth in Urban Areas

12 Assessing Uncertainty at Local Scales
13 Assessing Uncertainty at Local Scales Every county is simulated 101 times for each scenario and target year, i.e., Average of simulations by land-river segment = future development Relative Standard Deviation = estimate of uncertainty 13

14 Land Change Model Outputs Impervious surface and turf grass expansion Forest conversion to development Farmland conversion to development Future population on sewer and septic Rural Residential 57 acres 227 households on sewer 0.25 acre lots 27.8% Impervious 72.2% Turf grass 20-acres farmland loss 37-acres forest loss 14
15 Conservation Effects on Future Land Use (hypothetical example) Land Area = 25 cells 9 cells developed 8 cells forest 8 cells farmland No Conservation Scenario Greenfield Capacity = 46 units 22 units on forests 24 units on farmland No Conservation Scenario Future Demand for Growth = 12 units New Development = 3-6 cells 2 units 2 units 2 units 2 units 2 units 2 units 2 units 2 units 2 units 2 units 4 units 4 units 4 units 4 units 2 units 4 units 4 units 4 units 4 units 2 units 4 units 2 units 4 units 2 units 4 units 2 units 4 units 2 units 4 units 2 units 4 units 2 units Units = housing units Iteration #1 (of 101)
16 Conservation Scenario #1: conserve all low-density lands Conservation Scenario #1 Greenfield Capacity = 28 units 12 units remaining on forest lands 16 units remaining on farmland 18 units of reduced capacity Conservation Scenario #1 Future Demand for Growth = 12 units Development = 3 cells Avoided development = 1-3 cells 2 units 2 units 2 units 2 units 2 units 2 units 2 units 2 units 2 units 2 units 4 units 4 units 4 units 4 units 2 units 4 units 4 units 4 units 4 units 2 units 4 units 2 units 4 units 2 units 4 units 2 units 4 units 2 units 4 units 2 units 4 units 2 units Iteration #1 (of 101)
17 Conservation Scenario #2: reduce capacity below demand Conservation Scenario #2 Greenfield Capacity = 8 units No units remaining on forest lands 8 units remaining on farmland 38 units of reduced capacity Conservation Scenario #2 Future Demand for Growth = 12 units Development = 2 cells Avoided development = 2-4 cells 2 units 2 units 2 units 2 units 2 units 2 units 2 units 2 units 2 units 2 units 4 units 4 units 4 units 4 units 2 units 4 units 4 units 4 units 4 units 2 units 4 units 2 units 4 units 2 units 4 units 2 units 4 units 2 units 4 units 2 units 4 units 2 units

18 Crediting Land Conservation and Planning in the Bay TMDL 2025 Land Use (Conservation & Planning Scenario) 2025 Land Use (Mapped from Aerial Imagery) Difference = credit afforded to all actions in the Conservation & Planning scenario Estimated credit based on modelled contribution towards meeting the pollution reduction goals established for each state, state-basin, or county (scale may vary by state). Actual credit based on monitored changes in land use and reported BMPs.
19 Historic Trends: Chesapeake Bay Future Scenarios Continuation of historic development patterns and constraints as existed over the 2000 s. Includes the best available regional and local data representing current conditions. Current Zoning: Same as Historic Trends with the addition of local zoning, increased infill rates (MD counties), and expanded sewer service areas (Jefferson and Berkeley Counties, WV) to reflect current constraints on new development and reported rates of growth on septic. The Chesapeake Bay Program Partners adopted this scenario as the representing the most probable conditions in 2025 and therefore serves as a baseline for evaluating the effects of land use planning and land conservation BMPs. 19
20 Conservation Plus Family of Scenarios The Conservation Plus family of scenarios represents a variety of land conservation, land use planning, and policy actions that will directly or indirectly affect future patterns of development. Three thematic scenarios emerged from the list of plausible actions that are of interest to CBP jurisdictions and can be simulated consistently throughout the Chesapeake Bay watershed: 1. Forest Conservation 2. Growth Management 3. Agriculture and Soil Conservation 20
21 Alternative Future Thematic Scenarios Forest Conservation (with or without zoning): Organizations and governments proactively pursuing a variety of actions to conserve forests and wetlands which provide the greatest benefits to wildlife, human safety, and water quality. Example priority areas include riparian zones, shorelines, large contiguous forest tracts, and other highpriority forest conservation areas. Growth Management (with or without zoning): Organizations and governments proactively pursuing a variety of actions to encourage growth in areas with supporting infrastructure. Example priority areas include undeveloped or underdeveloped areas with adequate existing roads, wastewater, and water supply infrastructure. Agriculture and Soil Conservation (with or without zoning): Organizations and governments proactively pursuing a variety of actions to conserve farmland and productive soils. Example priority areas include agricultural districts, prime farmland, farmland of state importance, floodplains, and other high-priority farmland conservation areas. 21
22 Chesapeake Bay Watershed Scenario Elements Conserve riparian zones (default width = 30m) Conserve wetlands (NWI, State Designated Wetlands, and Potential Conservable Wetlands (PA only)) Conserve all lands subject to inundation due to sea level rise (default = 1m rise by the year 2100) Conserve all lands surrounding National Wildlife Refuges (default = 1 mile buffer) Conserve all large forest tracts (default >= 250 acres) Conserve Bay shorelines (default = 305m buffer (~1000-ft) of the tidal Bay and Atlantic shorelines) Conserve all high-value forest and forested wetlands identified by the Chesapeake Conservation Partnership Increase proportion of growth occurring as infill/redevelopment (default = 10% per decade) Increase urban densities (default = 10% per decade) Increase proportion of urban vs rural growth (default = 10% per decade) Expand sewer service areas (default = ~1 mile)) Avoid growth on all soils unsuitable for septic systems (based on depth to bedrock, drainage class, saturated hydraulic conductivity, and flood frequency) Conserve all farmland within designated Agricultural Districts Conserve all lands within the floodplain (default = 100-year recurrence interval) Conserve all lands with flooded soils (default = frequently flooded) Conserve all prime farmlands and farmland of state importance Conserve potential restorable wetlands (applies only to PA farmland) Conserve all high-value farmland identified by the Chesapeake Conservation Partnership 22

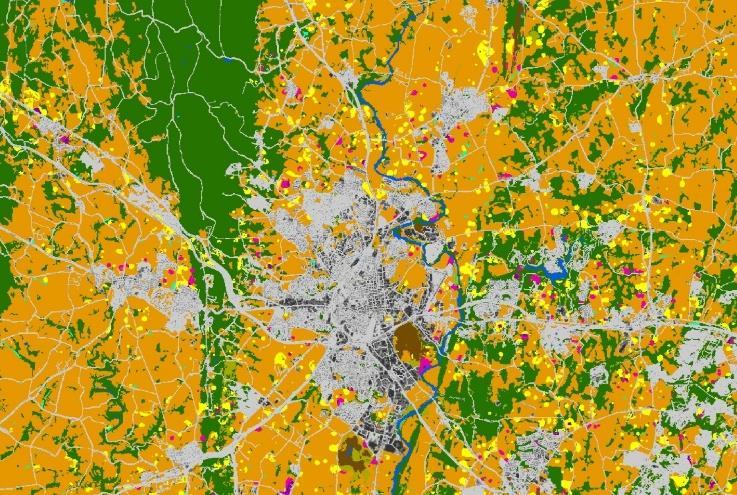
23 Protecting only forests shifts growth towards farmland. Anne Arundel County, MD Protecting rural areas shifts growth to the urban fringe. Promoting infill/redevelopment decreases impacts to both farms and forests.

24 Historic Forest Growth Agriculture Conservation Trends Management Conservation Scenario Scenario Scenario Scenario
25 Thematic Scenario Results 2025 Land Use Maryland CBLCM Land Use (Maryland) Scenario Impervious Pervious Natural Agriculture Mixed Open Historic Trends (HT) 20,764 55,316 (35,737) (35,235) (5,136) Forest Conservation (FCHT) 19,883 59,110 (25,074) (46,709) (7,212) Growth Management (GMHT) 17,732 47,561 (27,709) (32,649) (4,953) Agricultural Conservation (ACHT) 19,900 44,036 (53,781) (8,668) (1,467) Current Zoning (CZ) 9,860 22,692 (16,559) (14,135) (1,867) Forest Conservation with Zoning (FCCZ) 9,779 24,873 (11,994) (19,758) (2,903) Growth Management with Zoning (GMCZ) 8,666 19,840 (13,393) (13,313) (1,807) Agricultural Conservation with Zoning (ACCZ) 9,829 19,025 (24,738) (3,543) (577) (negative values in parentheses)
26 Thematic Scenario Results Wastewater Maryland Maryland Scenario Septic_2025 Pop25_Septic Pop25_Sewer Historic Trends (HT) 457,124 1,161,503 5,196,312 Forest Conservation (FCHT) 457,220 1,161,399 5,196,416 Growth Management (GMHT) 417,779 1,059,566 5,298,249 Agricultural Conservation (ACHT) 453,667 1,152,087 5,205,728 Current Zoning (CZ) 427,441 1,085,791 5,272,024 Forest Conservation with Zoning (FCCZ) 427,518 1,085,419 5,272,396 Growth Management with Zoning (GMCZ) 411,694 1,044,738 5,313,077 Agricultural Conservation with Zoning (ACCZ) 426,070 1,081,687 5,276,128

27 St.St. Mary s St. Mary s Mary s Forest Historic Land Conservation Cover Trends Scenario Charlotte Hall Leonardtown Lexington Park
28 Relative Nutrient Export Rates Mixed Forest Open Hay Pasture Developed* Cropland Nitrogen Export Rate (lbs/acre/yr) Mixed Forest Open Hay Developed* Cropland Pasture Phosphorus Export Rate (lbs/acre/yr) * Includes impervious surfaces (roads, rooftops, parking lots), pervious surfaces (turf grass), and land under construction.
29 Potential Nitrogen Reductions (lbs.) Due to Land Conservation St. Mary s County, Maryland Impervious Pervious Natural Agriculture Mixed Open FC vs HT (185) 333 1,152 (1,107) (193) Total Nitrogen (lbs/acre/yr) Difference in loads (lbs/yr) (1,817) 1,966 2,074 (28,773) (677) (27,227) Impervious Pervious Natural Agriculture Mixed Open FC vs CZ (89) (548) (96) Total Nitrogen (lbs/acre/yr) Difference in loads (lbs/yr) (871) 1, (14,244) (338) (13,227)

30 Range in Costs for Reducing 1 Pound of Nitrogen nal_meetings/fall2013/presentations/cost_efficiency_wip_fall_workshops_ pdf


31 Exposure to the threat of land conversion Blue tints represent the proportion of lands* that are threatened by future development * Land refers to areas that are suitable for near-term development
32 Chesapeake Bay Watershed Scenario Elements Conserve riparian zones (default width = 30m) Conserve wetlands (NWI, State Designated Wetlands, and Potential Conservable Wetlands (PA only)) Conserve all lands subject to inundation due to sea level rise (default = 1m rise by the year 2100) Conserve all lands surrounding National Wildlife Refuges (default = 1 mile buffer) Conserve all large forest tracts (default >= 250 acres) Conserve Bay shorelines (default = 305m buffer (~1000-ft) of the tidal Bay and Atlantic shorelines) Conserve all high-value forest and forested wetlands identified by the Chesapeake Conservation Partnership Increase proportion of growth occurring as infill/redevelopment (default = 10% per decade) Increase urban densities (default = 10% per decade) Increase proportion of urban vs rural growth (default = 10% per decade) Expand sewer service areas (default = ~1 mile)) Avoid growth on all soils unsuitable for septic systems (based on depth to bedrock, drainage class, saturated hydraulic conductivity, and flood frequency) Conserve all farmland within designated Agricultural Districts Conserve all lands within the floodplain (default = 100-year recurrence interval) Conserve all lands with flooded soils (default = frequently flooded) Conserve all prime farmlands and farmland of state importance Conserve potential restorable wetlands (applies only to PA farmland) Conserve all high-value farmland identified by the Chesapeake Conservation Partnership 32
33 Photo: istock Conservation Plus BMPs Incorporate greening, not just engineering, to offset future pollution Engage land conservation organizations in ecological restoration efforts Provide a green platform for other sustainability goals Avoid pollution and are therefore cost-effective Provide incentives to grow conservation financing


34 Maryland s Phase III WIP (Watershed Implementation Plan) Timeline Spring 2018-June 2019 Spring May June Summer Fall March June Review draft planning targets for major river basins; determine what gaps remain to further reduce pollution Begin regional Phase III WIP planning meetings: Western MD May 18 Continue regional Phase III WIP planning meetings: Central MD June 5 Lower Eastern Shore June 14 Upper Eastern Shore June 15 Southern MD June 18 Provide technical webinars with details on topics of interest to stakeholders MDE and MDA work with stakeholders to build local goals into State plan and refine local plans as appropriate; MDE work with local governments and MDA work with conservation districts to ensure most up-todate local information is included in the statewide scenario. Draft State WIPs completed and submitted to EPA Final State WIPs completed. Will synthesize information from multiple sources into a single scenario that will achieve water quality standards and statewide load reductions by For more on Maryland s Phase III WIP Development, visit:
35 Photo: Jim Moffett Why attend another meeting? Learn more about the WIP process and resources Understand where/how best to engage Meet the local/state agency staff leading the WIP process Position yourself as an organization that: can help deliver on land conservation goals is a trusted voice with private landowners is a candidate for potential funding opportunities
36 Photo: istock Key Messages for Land Trusts ASK: Please make land conservation one of the best management practices that (your) local jurisdiction includes in its WIP. Conserved land also provides many other benefits beyond pollution avoidance (habitat, water supply, flood control, etc.) Permanently conserved lands are durable locations for many Bay Programapproved BMPs Land trusts are important local entities with long-standing, trusting relationships with private landowners and stewardship responsibility over many acres of easements/fee lands

37 Photo: USDA/Scott Bauer Questions/Discussion Peter Claggett Research Geographer United States Geological Survey Phone: John Griffin Program Manager Chesapeake Conservation Partnership Phone: Christine Conn Director, Office of Science & Stewardship Chesapeake & Coastal Service Unit Maryland Department of Natural Resources Phone: Jennifer Miller Herzog Chesapeake Program Manager Land Trust Alliance Phone: