Country report Sweden
|
|
|
- Clementine Thomas
- 5 years ago
- Views:
Transcription


1 IEA Bioenergy Task 37 Country report Sweden Mattias Svensson Berlin (Germany), October 2015
2 Biogas Plant Inventory 2014 Substrate/Plant type Number of plants Production * (GWh/year) Sewage sludge 139 (+2) 679 (+7) Biowaste 35 (+12) 717 (+137) Agriculture 37 (-2) 44 (-33) Industrial 5 (+/- 0) 123 (+6) Landfills 60 ((+/- 0) 219 (-21) Thermal gasification 1(+1) 1 Sum 277 (+13) (+98) * = energy content in the produced biogas independent of the utilisation = redefinition of 6 agriculture plants as biowaste plants
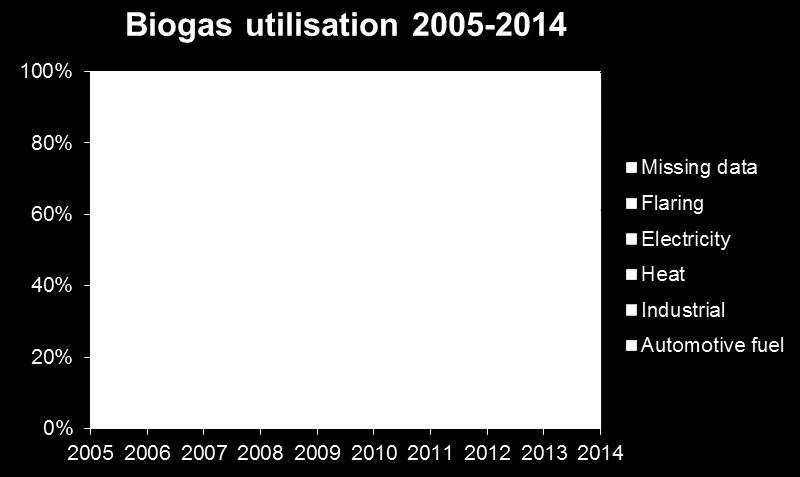
3 Biogas Utilisation 2014 Utilisation GWh % Electricity 58 (+12) 3% Heat 434 (-87) 24% (-7) Upgraded, automotive fuel 1,017 (+110) 57% (+3) Industrial use* 75 (+75) 4% (+4) Flare 191 (+6) 11% * = new utilisation category, earlier defined as heat or other CNG/CBG/LNG/LBG as automotive fuel, end 2014 Number of refuelling stations: 155 (excl. 63 non-public), incl. 6 for LNG/LBG Number of vehicles: 46,975 cars (1%)*, 2,315 busses (17%)*, 755 trucks (1%)* incl LNG trucks * = percentage of the national market 1,613 GWh (60% renew. on energy basis, 970 GWh, incl. imports)
4 Biogas upgrading biogas upgrading plants in operation: 41 Water scrubbers, 6 PSA, 12 Amine scrubbers. 2 membrane units and 1 cryogenic upgrading unit taken into operation , but not enough production data to get into the statistics Biomethane production 2014: 1,117 GWh/year (286 GWh injected into the grid) LBG production: 1 plant produced 41 GWh during 2014 No power to gas installations exist in Sweden A complete list of all upgrading plants will be available in late November (?) at


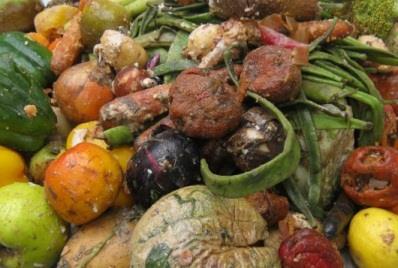
5 Biogas trends (1) ton ton 2013 Food waste collection in 190 of Sweden's 290 municipalities

6 Biogas trends (2)
7 Biogas trends (3) Biogas potential until 2030 Three scenarios with good, moderate or poor development of financial support system, technology and the price of fossil fuels. 1 3 TWh in scenario 3 (poor development) 5 8 TWh in scenario 2 (moderate development) 5 10 TWh in scenario 1 (good development) Source = Dahlgren S (2013) Realiserbar biogaspotential i Sverige 2030 genom rötning och förgasning, WSP
8 Digestate handling 2014 Plant type Digestate (Mtonnes wet) Fertiliser usage certified Sewage sludge % (-5) >50% Biowaste 1,378 99% ~64% Agriculture % -
9 Financial support system The support system in Sweden is mainly focused on increasing the usage of biomethane as vehicle fuel. The existing support systems are: No carbon dioxide or energy tax on biogas until the end of 2015 (extension 2020 pending EU approval). Corresponding to around 708 SEK/MWh (76 ) compared to petrol and 570 SEK/MWh (61 ) compared to diesel 40% reduction of income tax for use of company NGVs until end 2019 (10kSEK cap) Investment grants for marketing of new technologies and new solutions for biogas during Maximum 45% or 25 MSEK (~3M ) of investment cost Climate investment grant for municipalities: Total budget 1,925 MSEK (~200 M ) until the end of Similar to KLIMP! A joint electricity certificate market between Norway and Sweden. The producer gets one certificate for every MWh electricity produced from renewable resources and electricity consumers must buy certificates in relation to their total use. Price span SEK/MWh (~15-20 ) 0,2 SEK/kWh (~ 0,02/kWh) for manure based biogas production to reduce methane emissions from manure. Total budget 355 MSEK (10 years)

10 National strategies Government 2020 goals for renewables already reached 50% of the total energy utilisation 10% goal in transports Vision to have a fossil free transportation sector by Still awaiting government strategy to meet these goals The gas industry s biomethane vision is 100% in NGV market by 2030, and 100% in the national grid by 2050 National strategy to be launched in December!
11 Performance and economic data Median cost estimate (average cost estimate) from nine Swedish biogas plants. Unit: SEK/kWh, 1 = 9.3 SEK Crude biogas 0.54 (0.86) Upgrading Distribution in grid Distribution by road Refuelling Total 0.31 (0.32) 0.06 (0.08) 0.12 (0.15) 0.04 (0.07) 0.97 (1.35) Average price of CNG in Sweden Oct 2015: 1.24 SEK/kWh (2012: 1.41 SEK/kWh) Source: SGC report 296 available for free download at
12 Obstacles for the biogas development Long term conditions from the government and EU is missing (1-5 years planning horizon ) Substrate competition Suggestion of new very tough regulations on digestate as fertiliser (limits on content of heavy metals Unclear situation regarding import/export of biogas (mass balance limitations) Uncertainties concerning ILUC
13 Biogas Research Center Resource-efficient biogas solutions Strategic multi-criteria assessment of biogas solutions Jonas Ammenberg & Roozbeh Feiz, Environmental Technology and Management, Linköping University
14 BRC Resource-efficient biogas solutions Many different biogas solutions Complex sector : many involved actors/sectors & links to several socio-technical systems, dynamics and variance regarding feedstock, production in different contexts with diverging purposes, several technological options both regarding the production and use of the products, positive and negative interaction with the surrounding systems synergy effects. Often additional values than production of a fuel, e.g.; waste and waste water treatment climate mitigation nutrient recycling and soil fertility improvement biodiversity improved water quality (e.g. farming ascidians in the Baltic Sea) manure management Important to take these synergy effects (or externalities) into account Jonas Ammenberg
15 BRC Resource-efficient biogas solutions Broad systems studies are essential BRC focuses on implementation of resource efficient biogas solutions: Implementation; requires different kinds of feasibility and incentives - knowledge about important drivers and barriers is essential. Resource efficiency; maximize the outputs (or added values) from a certain resource or system, but have minimal negative impacts; E.g. amounts and values of the products and functions provided; economic effects; management of natural resources and impact on essential societal needs; environmental impacts; energy system aspects, etc. Strategic, broad and systematic Multi-Criteria Assessments (MCA) to: o o o o o Collect, select and structure relevant information Highlight critical drivers, barriers and opportunities Show strengths and weaknesses regarding resource efficiency; For biogas producers For the society Compare with competing alternatives Provide an overview and facilitate informed decision making Jonas Ammenberg
16 BRC Resource-efficient biogas solutions Essential points Broad, long-term, system studies of resource efficiency Take synergy effects (externalities) into account Compare with competing alternatives; o o o There is a risk of a too internal biofuel/biogas focus, discussing problems and looking for options to become more efficient E.g. if the methane emissions from biogas production are included, than declare the corresponding emissions for natural gas production and distribution as well Sustainability criteria for biofuels!? how are the fossil fuels coming out if they are also assessed using the same criteria (criteria in RED or from MCA-method) Cannot wait for THE OPTIMAL renewable solution and then phase out fossil fuels; o Are not electric vehicles the most efficient? Well, they can be, but Jonas Ammenberg
17 Preliminary results examples from a biogas feedstock study Key area Indicator Ley Straw Blue mussels (farmed) Biomethane yield and Biomethane yield suitability for anaerobic () (Poor) () digestion Nutrient content and suitability for biofertilizers Accessibility Amount of biomethane Amount and value of biofertilizers Technological feasibility Suitability for anaerobic digestion Nutrient content Suitability for biofertilizers Geographical and physical accessibility Amount of biomethane Amount of nutrients Technological feasibility () Very Very Very good Very poor Very Very Very good () Poor Poor () Poor () Poor * (, Very good) * (Poor) Stickleback fish (case-specific) () Very (Very Poor-Very ) * * () 17
18 Preliminary results examples from a biogas feedstock study Key area Indicator Ley Straw Blue mussel (farming) Profitability Profitability Poor Poor (Poor-) () Control and competition Institutional support and societal acceptance Control and competing interests Level of support and reasonability Planning horizon & administrative implications (Poor-) (Poor-) () () Not Assessed * () () Stickleback fish (case-specific) (Poor) Poor Very Poor Poor (Very Poor) Environmental and energy performance Public opinion Non-renewable energy balance (Poor/) Very poor Local/regional environmental impact Indirect land-use change * Very * Very Very 18
19 Contact information Mattias Svensson (