Energy Management at Statkraft. Short Term Energy Management
|
|
|
- Tamsin Logan
- 5 years ago
- Views:
Transcription


1 Energy Management at Statkraft Tbilisi, 19 November 2012 David Hornidge Short Term Energy Management
2 Outline Statkraft generation fleet in Europe Active markets Energy management for hydro power plants Example: Cakit HPP in Turkey Slide 2 German Power market and EEG 2012

3 Statkraft Generation in Europe Germany Gas ~2,400 MW Baltic cable 600 MW Hydro 261 MW Heat, Bio 16 MW 3 rd party Wind ~7,000 MW Nordic Hydro Wind Gas Heat, Bio ~12,000 MW 253 MW 209 MW 666 MW page 3 UK On. Wind Off. Wind Hydro 200 MW 500 MW 49 MW Turkey Hydro in operation 20 MW Hydro planned >600 MW

4 Norwegian Hydro Large network of 233 hydro plants Example: Ulla-Førre system, 26 reservoirs, 14 dams, 5 plants, 3.4 bill. m 3 or 8.5 TWh storage page 4

5 Example: Ulla-Førre system 1240 MW

6 Germany: Gas Assets State of the art >50% Knapsack MW Herdecke (50% ownership) 400 MW <35% State of the art in 1972 Emden 420 MW Robert Frank 490 MW page 6 Short Term Energy Management


7 Germany: Pump-storage Built in /- 220 MW Reservoir capacity of 1040 MWh Used mainly for reserve power and intraday balancing page 7 Short Term Energy Management


8 Baltic Cable Sweden 600 MW HVDC cable Day ahead scheduling: European Market Coupling Company 600 MW Intraday: Statkraft Germany page 8 Short Term Energy Management


9 Statkraft s Turkish Portfolio Kargi 102 MW Page 9 2nd offiice opened Oct 2012 Cakit 20 MW Cetin 530 MW
10 Outline Statkraft generation fleet in Europe Active markets Energy management for hydro power plants Example: Cakit HPP in Turkey Slide 10 German Power market and EEG 2012
11 1 month to 5 years away Next days Next hours Now Active Markets Dynamic Asset Management trades all energy related commodities Power, Gas, Coal, Oil, CO 2, Day ahead markets Germany EPEX, Nordic Elspot, Turkey PMUM, UK APX, Gas NCG and Gaspool, Trayport 24/7 Intraday markets Germany EEX, Nordic Elbas, phone/otc Reserve power markets Primary, Secondary, Minute reserve Redispatch, Blackstart, Backup contracts Yesterday! page 11 Day-After imbalance swaps (Germany only)
12 Outline Statkraft generation fleet in Europe Active markets Energy management for hydro power plants Example: Çakit HPP in Turkey Slide 12 German Power market and EEG 2012
13 Main Goal Maximize the revenues from the hydro power installations Physical: Sell and produce at highest possible prices Financial: Buy and sell financial contracts with the highest profits at an acceptable risk level Hydrology Production optimisation Analysis and price forecasting Dynamic asset management 13
14 The basic challenge Max inflow Typical price profile GWh/week Consumption Normal inflow Min inflow EUR/MWh Week
15 The process that gets us there Price and production forecasts short and medium term Dynamic hedging Data gathering Hydrological analyses & forecasts Water values Spot bidding Production planning Production follow up Price and production forecasts long term Maintenance planning page 15
16 Data gathering & hydrology Data gathering how much water will flow into our reservoirs and when? Hydrological analyses & forecasts Price and production forecasts short and medium term Water values Price and production forecasts long term We measure: Dynamic hedging Rainfall Air temperature Wind velocity Wind direction Production Depth of planning snow Water equivalent (snow pillow) Water level/flow Water temperature Maintenance planning Radiation Spot bidding Production follow up page 16

17 page 17 Hydrology models
18 Analysis & Forecasting Price and production forecasts short and medium term Dynamic hedging Data gathering Hydrological analyses & forecasts Water values Spot bidding Production planning Production follow up Price and production forecasts long term Maintenance planning page 18
 Including taxes and duties depending on actual generation Coal fired")


19 Simulations of the power market Thermal units marginal 30 costs Øre/kWh Theoretical equilibrium price when competing 15 at variable costs *) Including taxes and duties depending on actual generation Coal fired intermediate load / oil fuelled base load, Denmark 17 Coal condensing / oil condensing HFO, Sweden 17 Various coal fired base load, Denmark Co-generation / CHP, Finland 11 Nuclear, Finland 9 Nuclear / CHP, Sweden 7 CHP, Denmark 5 Hydropower 2 gh\ma\mc_eng.ppt CHP = Combined Heat and Power HFO=Heavy Fuel Oil TWh/year Consumption Oil condensing II, Sweden 26 Oil condensing Light distillates, Sweden 24 Oil fuelled intermediate load, Denmark 21 Coal fired base load, Finland Total Demand 1995 Thermal availabilty market Reg1 nord Troms Svernnor Svermidt Norgemidt Vestmidt Vestsyd Sørland Sversyd Sveronor 15 Finland Helgeland Finnmark Simulations of the power 7 13 The hydro system Transmission 11 Danmvest Danmost 12 Trade ANALYSIS AND RESULTS Price forecasts Water values Optimal production plans Hydrological data 19
20 Water values: marginal cost of each reservoir Reservoir 1 (small) Future precipitation Actual reservoir level (high) Water value = opportunity cost of producing one MWh from a specific reservoir now instead of later Price forecast /MWh Water Value Reservoir 1 (low) Water Value Reservoir 2 (high) Future spotprices depending on total inflow to Norway/Sweden Reservoir 2 (big) Future precipitation Actual reservoir level (low) 0 MW Our supply curve is based on water values for every reservoir 20

21 Phyiscal sales & production Price and production forecasts short and medium term Dynamic hedging Data gathering Hydrological analyses & forecasts Water values Spot bidding Production planning Production follow up Price and production forecasts long term Maintenance planning page 21
22 To produce or not to produce that is the question Euro/MWh Water values for different reservoirs Produce now! Spot price Save for later! 0 Optimal production MW 22


23 The optimisation tool SHOP Input: inflow forecast, price forecast, technical specifications and water values Output: Optimal production plan Production & Price Water 23

24 Production follow up is done 24 hours a day Keep market informed Balance position (minimise imbalance costs) Emergency response Optimise production 24 Activate balancing power Evaluate intraday trading possibilities Send updated schedules to TSO
25 Outline Statkraft generation fleet in Europe Active markets Energy management for hydro power plants Example: Cakit HPP in Turkey Slide 25 German Power market and EEG 2012


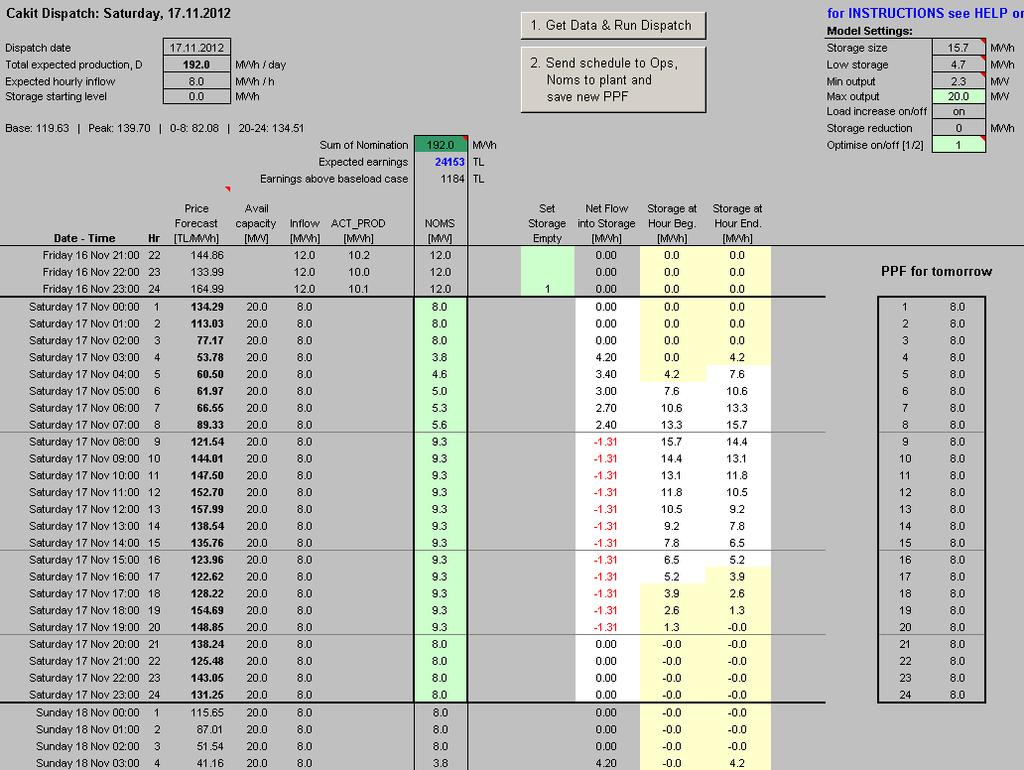
26 Çakit Short term production optimisation In operation since June MW capacity, run-of-river, 16MWh storage Single plant, small storage simple optimisation tool page 26 Near the Varda Bridge, Kiralan
 page")
27 Çakit Price and production forecast Inflow forecast = 8 MW Generate price forecast (simple persistence model) Find optimal production plan Production (MW) Storage Price Forecast Production plan Inflow Added value 1,200 TL or + 5% Hour Price forecast (TL/MWh) page 27
28 page 28


29 THANK YOU
30 page 30 Extra Slides
31 A day on the dispatch desk 7:00 Trading D-1 (IntradayS) 8:00 Information exchange with the plants Market analysis Hedging opportunities 9:00 Spot Gas possibilities MRL price forecasting Preliminary dispatch 10:00 Deadline Minute reserve auction 11:00 Minute reserve results Dispatch adjustment Forecast Cable Flow Finishing EEX-bid 12:00 Deadline EEX 12:45 EEX Results Afternoon Day ahead plant schedules thereby: intraday position Nominations to grid operators Schedule Baltic Cable Gas nominations (with Gas Operations), Deal bookings page 31 Short Term Energy Management
32 Intraday desk (24/7) Responsibility for whole SM GmbH Intraday position Handling of problems in generation Additional Baltic cable intraday optimisation Optimisation starts/rampings gas-fired assets Partner in the German Intraday market Backup-power contracts Handling of reserve (Minute reserve)... DI ACT PROD RWE DEL POS EXP IMB page 32 Short Term Energy Management
![German Energy Mix (Dec 2011) Supply 162GW = 92 Grey + [13+rand(0-47)]Green + 8 Power Generation 2011: 612 TWh * Slide 33 German](/docs-images/93/114250482/images/33-0.jpg "Power market and EEG 2012 * Source: preliminary figures from Bundesverband der Energie- und Wasserwirtschaft e.v. (www.bdew.de)")
33 German Energy Mix (Dec 2011) Supply 162GW = 92 Grey + [13+rand(0-47)]Green + 8 Power Generation 2011: 612 TWh * Slide 33 German Power market and EEG 2012 * Source: preliminary figures from Bundesverband der Energie- und Wasserwirtschaft e.v. (
34 German Balancing mechanism TSOs balance grid with... Mechanism Period Request Auction Products Required capacity 1 Primary reserve (PRL) 2 Secondary reserve (SRL) 3 Minute reserve (MRL) ms Auto Weekly PosNeg week MW s min Auto Weekly Pos / Neg Peak / Offpeak 15-min Phone Daily Pos / Neg 4-hour blocks 4 Redispatch hours Phone none Non-standard +/ MW MW MW 1 imbalance price, 15min resolution = cost of actual reserve executions volume Cost of capacity fees passed on to end users via Netzentgelt Slide 34 German Power market and EEG 2012
35 German imbalance price levels Volatile imbalance prices Imbalance price 300 EUR / MWh Jan July 2011 EPEX spot base Slide 35 German Power market and EEG 2012 Symmetric imbalance prices Publication one month after delivery Possible to estimate few hours later
36 EEG Renewable Energy Act Since 2000: 20-year fixed FIT to wind park owners (eg. ~9c/kWh) End users share cost via the EEG Appointment (now 3.59c/kWh) Since 2009: four TSOs required to accept and sell wind + solar via the day-ahead and intraday market. Highly regulated. Some mechanisms for direct marketing In 2010: High EEG-Appointment provides opportunity for direct marketing. Statkraft enters the business. Slide 36 German Power market and EEG 2012
37 EEG 2012: Market premium model In foreseeable future, wind + solar supply could sometimes surpass demand! Need for better market integration of renewables New incentive for direct marketing Wholesalers free to use all available markets Price FIT (eg. 90 /MWh) varies from plant to plant Management fee Market premium 12 /MWh in 2012, decreasing yearly determined monthly ex-post, so that on a national German average: FIT (park x) = EEX value of actual production + Market premium EEX sales revenue Slide 37 German Power market and EEG 2012 Market premium model
38 EEG 2012: Statkraft model Windpark Power Power Power market Market price Managment & market premium Statkraft pays owners FIT + some extra /MWh Payment higher than EEG Remaining profit must cover Setup/IT Fixed costs (8 new staff, forecasts, live metering) Cost of solving intraday deviations Imbalances Deviation of our portfolios EEX value from national average (hopefully close to zero for large portfolio) TSO / DSO Slide 38 German Power market and EEG 2012
39 Direct marketing of wind power MW GW 12GW (out of total 28) 4.5GW (37% of 12GW) German total Statkraft Jan Feb Mar Apr May Jun Jul Aug Sep Oct Nov Dec Jan = 3.14 TWh, 2012 = ~10 TWh Knapsack 2011 = 2.83 TWh Slide 39 German Power market and EEG 2012