Energy and Climate Policy
|
|
|
- Matthew Bradley
- 5 years ago
- Views:
Transcription
1 Energy and Climate Policy Sumie Nakayama Jan. 15, 2019
2 Contents Energy Trend and Outlook International Climate Policy Climate Change Gap between 2Degree Scenario and Reality Power Sector Low Carbonization: Variable Renewable Energy and Flexibility Power Sector Low Carbonization: Case Study in Japan 2
3 ENERGY TREND AND OUTLOOK (IEA WORLD ENERGY OUTLOOK)
4 Energy Trend: Demand, CO2 and Fossil Energy-related エネルギー起源 CO2 CO2 emissions 排出量 (Gt) (Gt) Energy Demand (Gtoe) 総エネルギー需要 (Gtoe) Energy demand has been increasing for more than 45 years. Energy-related CO2 also has been increasing at higher rate. The share of fossil energy to total energy (in heat value) has remained over 80% % 100% 45 90% 90% 総エネルギー需要 Energy demand 総エネルギー需要 40 80% 80% 35 70% 70% エネルギー起源エネルギー起源 Energy-related CO % 60% CO2 排出量排出量 CO2 emissions 25 50% 50% 化石燃料割合 Share of fossil energy 20 40% 40% 15 30% 30% 10 20% 20% 5 10% 10% 0 0% 0% Change in energy demand, CO2 emissions and fossil share ( ) Source: IEA CO2 emissions from fuel combustion 2015 CD-ROM data 4
5 Shares of global primary energy consumption Among fossil fuels, share of Oil is declining while share of gas is increasing and share of coal increased in 2000s followed by decrease. Share of renewables has been increasing since late 2000s. Source: BP Statistical Review of World Energy

6 Energy Trend : Primary energy by energy resource Supply of all the energy resources have increased in the last 25 years. The growth rate of coal were higher than others in 2000s. Mtoe Source: BP Statistical Review of World Energy
 still remains the largest source of renewables.")
7 Renewable energy trend The growth of renewable energy is faster than increase of energy consumption. Traditional biomass (firewood, animal waste) still remains the largest source of renewables. Source: IEA Word Energy Outlook

8 Power generation trend Global electricity demand ha increased around 70% from 2000 to Power mix remains dominated by fossil fuel, especially coal even with growth in renewables. Source: IEA Word Energy Outlook

9 Primary energy regional consumption by fuel 2017 Source: BP Statistical Review of World Energy

10 Fuel consumption by region 2017 Source: BP Statistical Review of World Energy
11 Power generation portfolio (2016) Coal is supplying 38%, the largest share of world total power generation. Especially in China and India, coal share is approximately 70%. 0% 10% 20% 30% 40% 50% 60% 70% 80% 90% 100% Japan 34% 8% 39% 2% 8% 3% 5% Russia 16% 1% 48% 18% 17% 0% EU 23% 2% 19% 26% 11% 6% 9% 3% UK Denmark 9% 1% 29% 42% 1% 7% 0% 18% 21% 42% 10% 11% 3% 2% 3% USA 32% 1% 33% 20% 6% 2% 5% World 38% 4% 23% 10% 16% 2% 4% Germany 42% 1% 13% 13% 4% 9% 12% 6% China 69% 3% 3% 19% 1% 4% 5% India 75% 5% 3% 9% 3% 3% Coal Oil Gas Nuclear Hydro Biomass Wind PV OtherRE Source: IEA World Energy Outlook 2018, IEA Electricity Information

12 ( /1000kcal) Characteristics of Fossil Energy Oil Price is expensive and volatile. Reserve is limited and intensively located in Middle East. Coal Price is inexpensive and stable. Reserve is the largest and broadly distributed all over the world Gas Price is between oil and coal and less volatile than oil. Reserve distribution is more broader than oil. 2.8% 7.5% 47.6% 9.3% 19.5% 13.3% 10.0% 7.1% 40.9% 32.1% 4.2% 5.6% 41.0% 1.3% 0.1% 31.3% 1.4% 25.0% Oil Natural Gas Coal Geographical distribution of fossil fuels Asia Pacific Africa Middle East Source: BP Statistical Review of World Energy 2018 Europe & Eurasia S. & Cent. America North America Source: IEA WEO Oil LNG Coal Historical market price of fossil fuels in Japan Source: Trade Statistics of Japan 12
13 Energy Trend: Change in geography, record and outlook Energy Demand United States China European United States Union China European Union China India European Union Africa India European Union Africa India Southeast Middle Asia East Southeast Middle Asia East Mtoe In 2000, more than 40% of global demand was in Europe & North America and some 20% in developing economies in Asia. By 2040, this situation is completely reversed. Source: IEA Word Energy Outlook
14 Oil and gas production outlook for selected countries mboe/d The rise in US production of tight oil and shale gas since 2010 is the largest parallel increase in oil and gas output in history United States Russia Saudi Arabia Iran Canada Iraq Source: IEA Word Energy Outlook
15 Eneegy demand (Gtoe) Energy Demand (Gtoe) Energy demand outlook Energy demand continues to grow through By energy resource, growth is seen in renewable energy. By region, growth is seen in developing countries, especially in Asia. 20 Other RE 20 Other Bio&Waste Middle East 15 Hydro 15 Africa Nuclear SE Asia 10 5 Gas Oil Coal 10 5 India China Japan Primary energy supply by energy resource (New Policy Scenario) Primary energy supply by region (New Policy Scenario) Source: IEA World Energy Outlook
16 Power Genration Capacity(GW) Power generation outlook Electricity Generation(TWh) Power Generation and Capacity will be increased toward Power Generation Capacity will be increased by 1.9 times Electricity Generation will be increased by 1.6 times ,690GW 12,466GW 24,575TWh 40,443TWh 14,000 12,000 10,000 8,000 6,000 4,000 2,000 0 Other Renewable PV Wind Hydro Nuclear Gas Oil Coal , , ,462 10, ,589 1,250 1, , ,033 1,498 1, ,707 1, ,113 2,334 2,526 2, , , ,130 2,143 2,184 2, ,000 45,000 40,000 35,000 30,000 25,000 20,000 15,000 10,000 5,000 0 Other Renewable PV Wind Hydro Nuclear Gas Oil 30,253 Coal 1, ,829 7,517 8,265 9, ,821 33,510 1,364 2,197 3,157 5,330 3,089 3,253 9,896 10,016 36,919 1,696 2,935 3,960 5,774 3,520 40,443 2,076 3,839 4,690 6,179 3,726 10,172 10, Power Generation Capacity(New Policy Scenario) Generation Capacity (New Policy Scenario) Source: IEA World Energy Outlook

17 Power generation capacity outlook Power generation capacity additions and retirements, Wind and solar PV accounts for more than half of additions. Source: IEA Word Energy Outlook

18 Energy related CO2 outlook Global CO2 emissions continue to rise through By regions, developing economies, by sector, transport and industry are driving the growth. Source: IEA Word Energy Outlook
19 Renewable energy outlook Renewable energy share will increase in all regions. Share in electricity sector grows remarkably. Growth in heat sector shows slower pace or stand still. Share in transport remains lower level in many regions. Source: IEA Word Energy Outlook
20 INTERNATIONAL CLIMATE POLICY (UNFCCC NEGOTIATION HISTORY, MAJOR COP DECISIONS AND PARIS AGREEMENT)
21 Major International Forum for Climate Change Policy United Nation Framework Convention on Climate Change Objective (Article 2) : to achieve stabilization of greenhouse gas concentrations in the atmosphere at a level that would prevent dangerous anthropogenic interference with the climate system. 192 parties (countries and region (EU)) that ratified UNFCCC Decision is only made by consensus Annual conference of parties (COP) in Nov/Dec, and semi annual meetings of subsidiary bodies (SBI, SBSTA and temporally Ad-hoc meetings) Annual meeting under Kyoto Protocol and Paris Agreement are held in pallarel during COP Other UN meetings United Nation Summit G8 (G7), G20 21
22 COP Chronology Year Meeting Venue Major outcome 1992 UN summit Rio de Janeiro adoption of UN Framework Convention on Climate Change (UNFCCC) 1994 Effect of UNFCCC 1997 COP3 Kyoto Adoption of Kyoto Protocol 2000 COP6 Bonn US' withdrawal from Kyoto Protocol 2001 COP7 Marakech Agreement on rules for Kyoto Protocol 2005 COP11 Montreal Effect of Kyoto Protocol 2007 COP13 Bali Agreement on "post 2012 framework by 2012" 2009 COP15 Copenhagen Failure to agree on post 2012 framework 2010 COP16 Cancun Agreement to continue long term vision and 2020 voluntary target 2011 COP17 Darbun Agreement on "post 2020 framework with all parties' contribution by 2015" 2012 COP18 Doha Agreement on work program for post 2020 framework 2014 COP20 Lima Start of negotiation on post 2020 framework text 2015 COP21 Paris Adoption of Paris Agreement 2016 COP22 Marakech Effect of Paris Agreement 2018 COP24 Katowice Agreement on major rules for Paris Agreement 22
23 Negotiation group in UNFCCC COP Developing countries groups Group of 77+China (G77+China) a large alliance of 134 developing nations Least Developed Countries (LDCs) a group of the world s poorest nations, which evolves as economies change Alliance of Small Island States (AOSIS) a group of 44 small islands and low-lying coastal states Like-Minded Developing Countries (LMDCs) a group of developing countries, representing 3.5bn people, with a strong focus on ensuring rich countries bear most responsibility for tackling climate change BASIC (Brazil, South Africa, India and China) a coalition of four major emerging economies Bolivarian Alliance for the Americas (ALBA) a Latin American and Caribbean alliance with socialist leanings Regional developing countries groups African Group One of the UN s five regional negotiating groups, with 54 member states Arab Group formally the League of Arab States, a regional organisation formed in 1945 Developed countries group European Union (EU) the 28 member states of the EU, with negotiations led by DG-Clima Umbrella Group (Australia, Belarus, Canada, Iceland, Israel, Japan, New Zealand, Kazakhstan, Norway, the Russian Federation, Ukraine and the United States) a cross-continent group of countries Source: Climate policy info hub 23

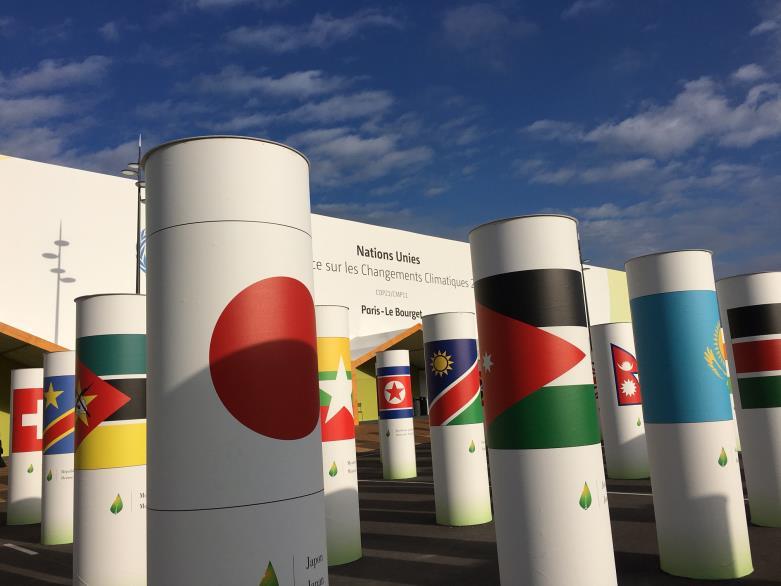
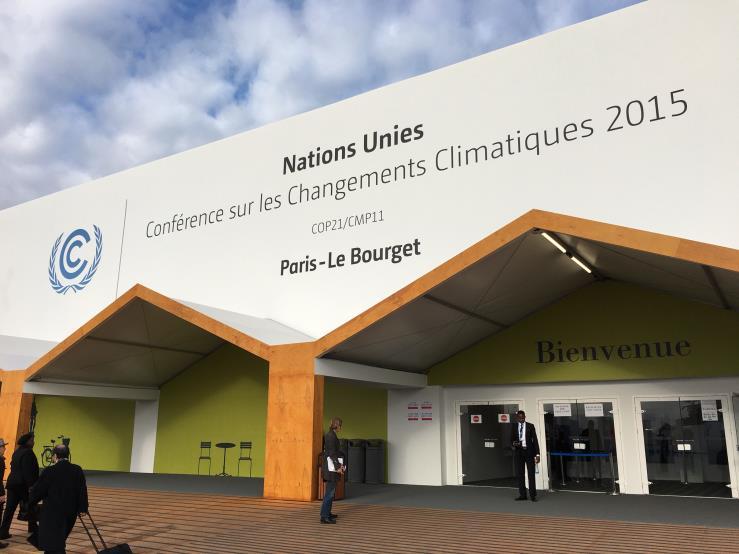
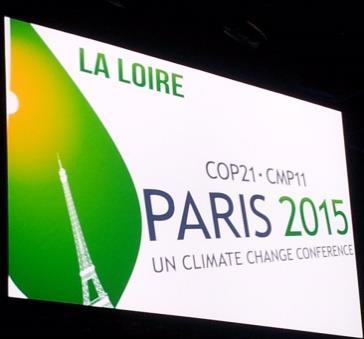
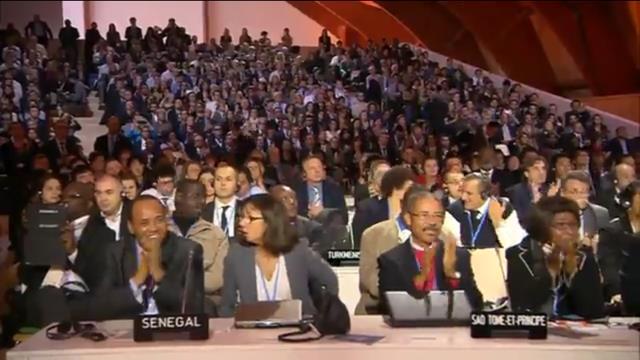

24 Photos from COP21 24
25 Paris Agreement in comparison with Kyoto Protocol Kyoto Protocol Paris Agreement What are to be done Mitigation Mitigation, Adaptation, Finance support, Review Who are to mitigate Developed countries All parties How to set mitigation target What are mandated Emission coverage Decided by COP (top-down) Compliance of the target (penalty for no compliance) 26% (to global energy related CO2 between ) Decided by each party (bottom-up) Efforts to aim the target (compliance of the target is not mandate) 100% Long term vision No long term vision Holding temperature increase well below 2 degree Adaptation - Necessity for developing countries Finance support Transparency Review - - Kyoto Protocol shall be reviewed to decide new target for next commitment period Mandate for developed countries to provide to developing countries All parties shall submit NDC and follow review process Each party shall submit new NDC in every 5 years 25
26 Overview of Paris Agreement Relevant text in Paris Agreement Legal binding force Long term target ( Article 2 ) This Agreement aims ( ) to strengthen the global response to the threat of climate change, in the context of sustainable development and efforts to eradicate poverty, including by: (a) Holding the increase in the global average temperature to well below 2 C above pre-industrial levels and pursuing efforts to limit the temperature increase to 1.5 C above preindustrial levels Not mandate Pathway for the long term target ( Article 3, Paragraph 1) In order to achieve the long-term temperature goal set out in Article 2, ( ) Parties aim to reach global peaking of greenhouse gas emissions as soon as possible, recognizing that peaking will take longer for developing country Parties, and to undertake rapid reductions thereafter in accordance with best available science, so as to achieve a balance between anthropogenic emissions by sources and removals by sinks of greenhouse gases in the second half of this century, on the basis of equity, and in the context of sustainable development and efforts to eradicate poverty. Not mandate 26
27 Overview of Paris Agreement Short term target for all parties ( Article 3, Paragraph 2) Support to developing countries ( Article 3, Paragraph 5) Mechanism to check progress of domestic measures (Article 13, Paragraph 7 ) Review process to check progress toward long term target ( Article 14, Paragraph 1 ) Relevant text in Paris Agreement Each Party shall prepare, communicate and maintain successive nationally determined contributions that it intends to achieve. Parties shall pursue domestic mitigation measures, with the aim of achieving the objectives of such contributions. Support shall be provided to developing country Parties for the implementation of this Article, in accordance with Articles 9, 10 and 11, recognizing that enhanced support for developing country Parties will allow for higher ambition in their actions. Each Party shall regularly provide the following information: (b) Information necessary to track progress made in implementing and achieving its nationally determined contribution under Article 4. The Conference of the Parties serving as the meeting of the Parties to this Agreement shall periodically take stock of the implementation of this Agreement to assess the collective progress towards achieving the purpose of this Agreement and its long-term goals (referred to as the "global stocktake"). Legal binding force Mandate: NDC preparation, communication, maintenance and pursuing domestic mitigation measures (achieving the objectives is not mandate) Mandate Mandate Mandate 27
28 CLIMATE CHANGE (IPCC AR5, SR1.5)
29 Scientific base for climate change The Intergovernmental Panel on Climate Change (IPCC) was established by the United Nations Environment Programme (UNEP) and the World Meteorological Organization (WMO) in The objective of the IPCC is to provide governments at all levels with scientific information that they can use to develop climate policies. Since 1988, the IPCC has had delivered five Assessment Reports, the most comprehensive scientific reports about climate change. Three working groups are in charge of Assessment Report based on the latest academic findings; Working Group I The Physical Science Basis Working Group II Impacts, Adaptation and Vulnerability Working Group III Mitigation of Climate Change Each Assessment Report (some thousands pages) and Synthesis Report (a couple of hundreds pages) are summarized into Summary for Policymakers (SPM, pages) that were reviewed by government officials. 29
30 WG1 AR5 SPM: Figure SPM1 30
31 WG1 AR5 SPM: Figure SPM3 31
32 WG1 AR5 SPM: Figure SPM4 32
33 WG1 AR5 SPM: Figure SPM7 33

34 WG1 AR5 SPM: Figure SPM10 34

35 WG2 AR5 SPM: Assessment Box SPM.1 Figure 1. 35

36 WG2 AR5 SPM: 36

37 WG2 AR5 SPM: Figure SPM. 5 37

38 WG2 AR5 SPM: Figure SPM. 2 38

39 WG3 AR5 SPM: Figure SPM. 4 39

40 WG3 AR5 SPM: Figure SPM 7 40

41 AR5 WG3 Technical Summary: Figure TS 41
42 GAP BETWEEN 2DEGREE SCENARIO AND REALITY(NDC)

43 Gap of CO2 emission between NDC and 2 Source: IEA Word Energy Outlook
44 Global energy-related CO 2 emissions Half of coal plants are less than 15 years old. Policies are needed to support CCUS, efficient operations and technology innovation. Gt CO New Policies Scenario Existing and under construction power plants, factories, buildings etc. Increased room to manoeuvre Sustainable Development Scenario 6 Coal-fired power plants Source: IEA Word Energy Outlook

45 Progress in CCS Source: GCCSI Status report of CCS,

46 Progress in CCS CCS project status in 2014 CCS project status in 2016 Source: GCCSI Status report of CCS,

47 Plans to phase out coal in EU By 2030, 28% of the existing coal-fired power generation capacity will be retired in EU. To global existing coal-fired power generation capacity, it accounts for 2.2%. 47
48 2 and well below 2 48
49 and
50 POWER SECTOR LOW CARBONIZATION: VARIABLE RENEWABLE ENERGY AND FLEXIBILITY

51 Flexibility as the key feature of future-ready power systems Variable renewable energy requires sufficient power system flexibility Flexibility requires both technologies and effective regulation/markets. 51

52 Global Attention to Power Plant Flexibility Advanced Power Plant Flexibility Campaign (APPF) was carried out as one of the activities of Clean Energy Ministerial from 2017 to 2018, coordinated by IEA. Accommodating the growing shares of wind and solar power poses novel challenges for power systems, This raises the importance of power system flexibility, APPF seeks to build strong momentum and commitment from governments and industry to implement solutions that make power generation more flexible. J-POWER participated in APPF as a private partner 52
53 VRE integration phase in selected countries IEA categorized VRE integration phase based on VRE penetration level and restrictions of respective power system. 53

54 VRE integration phase and impact 54
55 POWER SECTOR LOW CARBONIZATION: CASE STUDY IN JAPAN
56 Japan s Electricity Supply by Energy Resources After the oil crises in the 1970s, Japan s energy policy targeted achieving a well balanced energy portfolio and it was about to realize it in But nuclear generation has suddenly ceased after Fukushima nuclear accident in Single accident affects all nuclear plants. (TWh) 1,200 1, Other RE Oil LNG Hydro Coal Nuclear J-POWER Matsushima PS Commissioned in Jan st large scale imported coal-fired power plant carried out in combination with development of coal mine Fukushima Nuclear accident in Mar [2010FY 2017FY] Other Renewables % Oil & Petro % LNG % 600 Hydro & Pumped Storage % 400 Coal % 200 Nuclear % Source: Energy White Paper 2017 (Fisical Year) 56
57 Japan s Power Generation Capacity Portfolio From 2000 to 2015, installed capacity of RE has remarkably increased, though most of solar PV and wind farms are owned by new entrants and not presented in the pie charts. Existence of 28GW pumped storage hydro (PSH) is a unique aspect of Japan s power generation capacity portfolio Nuclear 45 Coal Total Installed Capacity 229 GW LNG Oil Hydro Pumped Storage Renewables Nuclear 42 Coal Total Installed Capacity 260 GW LNG Oil Hydro Pumped Storage Renewables Power generation capacity by type in Japan (excluding new entrants) Source: Energy White Paper
58 Growth of Renewables. RE promotion policy started with RPS in 2003 supplemented by Excess Electricity Purchasing Scheme in In 2012 they were replaced by Feed-in Tariff that triggered a surge of solar PV. (10MW) Solar PV Wind power Biomass Geothermal Middle and small hydropower Average annual growth rate 5% Average annual growth rate 9% Average annual growth rate 29% (FY) Excess Electricity Purchasing Scheme FIT system RPS System Source: presentation of Ministry of Economy, Trade and Industry 58

59 Power System in Japan Japan s power system consisting of 10 grids is divided between East (50Hz) and West (60Hz) in frequency. 9 grids going through four main islands are connected with interconnections and FCs like fishbone, which is totally different from the meshed network in the US or Europe. Interconnections between grids vary in number, capacity and type(ac/dc). Operational Capacity of Interconnections during daytime in August, 2016 A: Hokkaido 4.3GW I: Kyushu 15.2GW J: Okinawa 1.4GW Frequency Converter AC/DC Converter Chugoku-Kyushu (AC) 2530MW 530MW G: Chugoku 11.0GW Chugoku-Shikoku (AC) 1200MW 1200MW H: Shikoku 5.0GW Kansai-Chugoku (AC) 4050MW 2780MW Kansai-Shikoku (DC) 1400MW 1400MW Hokuriku-Kansai (AC) 1300MW 1620MW F: Kansai 26.3GW Chubu-Kansai(AC) 2500MW 1920MW E: Hokuriku 5.0GW D: Chubu 24.3GW Chubu-Hokuriku (DC) 300MW 300MW Shinshinano FC Sakumma FC Higashi ー shimizu FC Tokyo-Chubu (FC) 1200MW 1200MW Hokkaido-Hpnshu (DC) 600MW 600MW B: Tohoku 13.1GW Tohoku-Tokyo(AC) 610MW 4850MW C: Tokyo 52.5GW 59
60 Solar PV penetration under FIT by grid In Kyushu, the commissioned solar PV is over the maximum capacity for grid connection. In Tohoku, the sum of commissioned and EIA completed is about to exceed the maximum capacity for grid connection. 30 GW submitted for grid connection 25 commissioned lowest load in daytime(2017) commissioni ng expected near future maximum capacity for grid connection as of the end of October, 2018 Tokyo, Chubu show total capacity of renewables 5 commissio ned 0 Hokkaido Tohoku Tokyo Chybu Hokuriku Knsai Chugoku Shikoku Kyushu Okinawa 60
61 Wind penetration under FIT by grid In Hokkaido, commissioned wind is over the maximum capacity for grid connection. In Tohoku, the sum of commissioned and EIA completed is about to exceed the maximum capacity for grid connection GW EIA beginning EIA 1st half completed EIA in final stage EIA completed commissioned maximum capacity for grid connection 2 0 Hokkaido Tohoku Tokyo Chybu Hokuriku Knsai Chugoku Shikoku Kyushu 61
62 Model Description The analysis used a production cost model customized for Japan s power system. Objective function: Minimizing generation cost (fuel cost plus start-up cost) of the total power system of interconnected 9 power grids and one isolated grid for 8760 hours. min( Ngrid ig1 idx ig NG iidx 1 ( F( P ig ig i )) min( Ngrid ig1 idx ig NG iidx ig 1 ( b ig i P i c i U i startup ST i )) As a nature of production cost simulation, it does not take fixed cost (capital cost nor depreciation) into account. Limiting conditions Balance between demand and supply Balance between variability and available flexibility (LFC * capacity) Upper and lower limit of hourly output in each power generation unit Capacity of interconnection for energy interchange * LFC (Load Frequency Control) balancing capacity able to regulate variability in a few to 15 minutes. 62
63 Calculation Condition The total capacity of solar PV (103GW) and wind (32GW) in 2030 assumed to represent massive VRE deployment Solar PV and wind distribution by grid assumed to reflect the current unevenness Other type of power generation capacity in 2030 assumed in line with Long Term Energy Demand and Supply Outlook 2015 VRE capacity by grid GRID PV(GW) Wind(GW) 100% CHP A: Hokkaido B: Tohoku % Pumped Storage Wind C: Tokyo Solar PV D: Chubu % Hydro E: Hokuriku Biomass F: Kansai % Geothermal G: Chugoku Oil H: Shikoku % LNG I: Kyushu Coal J: Okinawa % Japan Grid-A B C D E F Gr H I J Nuclear Total GW 18GW 52GW 115GW 51GW 10GW 58GW 28GW 14GW 43GW 4GW Power generation capacity by type by grid 63
64 Cases for Flexibility Evaluation The impact by availability of source of flexibility to VRE utilization and operation cost were analyzed. Coal-fired power plants LFC capacity Pumped storage hydro Priority dispatch for VRE, a known measure to support VRE, was also analyzed for comparison Analyzed case and available source of flexibility Available Source of Flexibility Case Energy Transmission by Interconnections LFC service from Coal-fired PP Pumped Storage Hydro Current situation in Japan Not fully Base Case (Base) without Interconnection (E0) No without Coal LFC (C0) No without PSH (P0) No LFC without (Load flexibilities Frequency Control) above service: (F0) balancing capacity able Noto regulate variability in a few No to 20 minutes. No 64
65 Result of Analysis: Power Generation Mix The power generation mix in Base Case by energy type shows; Nuclear: Coal: Gas: Oil: Renewables = 21%: 23%:27%:1%:28% *Gas includes CHP, and Renewables includes PSH as in line with Long Term Energy Demand and Supply Outlook 2015 The power generation mix varies by grid, mainly due to capacity portfolio in each grid but also due to conditions in neighboring grids. 100% 90% 80% 70% 60% 50% 40% 30% 20% 10% 0% Japan GRID-A GRID-B GRID-C GRID-D GRID-E GRID-F GRID-G GRID-H GRID-I GRID-J CHP PSH Wind PV Hydro Biomass Geothermal Oil LNG Coal Nuclear Power generation mix in Japan total and by grid in Base Case 65
66 Result of Analysis: Power Generation Mix The power generation mix varies by case. When Coal LFC or PSH is not available, LNG power generation increase. When flexibility is not available, the share of VRE is reduced significantly from 14% in Base to 5%. 100% 80% 60% 40% 20% 0% Base E0 C0 P0 F0 CHP PSH Wind PV Hydro Biomass Geothermal Oil LNG Coal Nuclear VRE 14% 13% 12% 9% 5% Renewables 30% 28% 28% 21% 17% Fossil 50% 51% 52% 57% 61% Power generation mix and share of selected indicators by case and by grid 66
67 Annual VRE curtailment (TWh) Result of Analysis: VRE Curtailment Each source of flexibility affects VRE curtailment, for both of Wind and Solar PV. The impact vary, interconnection < coal LFC < pumped storage hydro. Unavailability of PSH largely increases curtailment solar PV because PSH works to storage to accumulate PV s surplus power generation in daytime as well as providing flexibility. Without all the flexibility, 75% of VRE power is curtailed Base E0 C0 P0 F0 Wind PV Curtailment ratio: Wind 21% 34% 41% 47% 74% Curtailment ratio: Solar PV 16% 21% 28% 58% 75% VRE curtailment (upper figure) and VRE share in total power generation (lower table) by case 67
68 Annual VRE Curtailment (TWh) Flexibility and VRE curtailment The sum of VRE curtailment for base and total incremental VRE curtailment by each unavailable flexibility almost equals the VRE curtailment for F0, no-flexibility available case. It means the impact of each flexibility is independent, so no offset in the total impact Base E0 C0 P0 F0 annual VRE curtailsment in F0 incremental VRE curtailsment of P0 to Base incremental VRE curtailsment of C0 to Base incremental VRE curtailsment of E0 to Base annal VRE curtailsment for Base 68
69 Annual Cost (Trillion JPY) Flexibility and cost The sum of annual cost for base and total incremental annual cost by each unavailable flexibility almost equals the annual cost for F0, noflexibility available case. It means the impact of unavailability of multiple flexibility has negative synergetic affect Increase of 1.4 TJPY (45%) Base E0 C0 P0 F0 annual cost in F0 incremental cost of P0 to Base incremental cost of C0 to Base incremental cost of E0 to Base annal cost for Base 69
70
71 Useful source of Information Energy IEA: Executive summary of WEO, many free publication DOE/EIA: International Energy Outlook, energy statistic and outlook for USA and the world. IEEJ (The Institute of Energy Economics, Japan 日本エネルギー経済研究所 ) IEEJ Energy Outlook, energy statistic and outlook for Asia and the world. Eurostat: economic (including energy) statistic in EU Climate Change UNFCCC IPCC UNEP 71

72