Water Supply Constrained Options Appraisal
|
|
|
- Lee Bailey
- 5 years ago
- Views:
Transcription

1 Water Supply Constrained Options Appraisal SES Water WRMP 2019 SES Water Project number: Rev January 2018
2 Quality information Prepared by Checked by Approved by Travis Kelly Principal Hydrogeologist Jane Sladen Technical Director Jane Sladen Technical Director Revision History Revision Revision date Details Authorized Name Position Rev 1 19/07/2017 Rev 2 25/08/2017 Rev 3 15/11/2017 Rev 4 30/11/2017 Rev 5 31/01/2018 Distribution List # Hard Copies PDF Required Association / Company Name 2
3 Prepared for: SES Water Prepared by: Travis Kelly Principal Hydrogeologist Infrastructure & Environment UK Limited Midpoint Alencon Link Basingstoke Hampshire RG21 7PP UK T: +44(0) aecom.com 2017 Infrastructure & Environment UK Limited. All Rights Reserved. This document has been prepared by Infrastructure & Environment UK Limited ( ) for sole use of our client (the Client ) in accordance with generally accepted consultancy principles, the budget for fees and the terms of reference agreed between and the Client. Any information provided by third parties and referred to herein has not been checked or verified by, unless otherwise expressly stated in the document. No third party may rely upon this document without the prior and express written agreement of. 3
4 Table of Contents 1. Introduction Unconstrained Screening Unconstrained Screening Methodology Unconstrained Option Results Constrained Costing Methodology Capital and Operational Costs Social and Environmental Costs Carbon Emissions Summary of Supply Side Options Summary of Demand Side Options Water Efficiency Metering Leakage Summary EBSD Modelling Approach Data Requirements Baseline Feasible Options Optimisation CAPEX Fixed OPEX Variable OPEX Carbon Planning and Assessment Periods Scenario Runs Conclusions References Figures Figure 1. Location of sources and constrained options... 8 Figure 2. EBSD Model Operation Tables Table 1. E&S Qualitative Assessment Scoring Criteria Table 2. EBSD programmes for least cost scenario Table 3. EBSD programmes for environmental scenario Table 4. EBSD programmes for levels of service scenario Table 5. EBSD programmes for stakeholder preferences scenario Table 6. Preferred programme utilising additional stakeholder preferences scenario
5 Appendices Appendix A Constrained Option Proformas Appendix B Demand Side Costing Appendix C EBSD model output 5
6 1. Introduction This report describes the methodology adopted in the development of the constrained options for the PR19 Water Resources Management Plan (WRMP), as part of the water resources option appraisal process as set out in the Environment Agency (EA) Water Resources Planning Guideline (WRPG). The constrained options represent those considered feasible from the unconstrained screening process (, 2017a) and were taken through to a costing process. The unconstrained list included all options that could help reduce a projected supply-demand deficit over the PR19 planning period, and are a collation of all the concepts and ideas derived from SES Water staff. As specified in the WRPG, all unconstrained options are feasible from an engineering perspective but do not take in account technical, economic or environmental factors and constraints that may affect the viability of implementing an option. The unconstrained screening process involved a scoring system reflecting the degree of impediment to the scheme with respect to environmental risk, technical feasibility, deliverability and resource supply/savings, to provide a filter for identifying the most favourable options for inclusion on the constrained option list. The unconstrained screening was presented to the EA during autumn 2016 and a draft report provided, and their views were minuted and included in the unconstrained list option information sheets and added to the report. SES Water then decided to take approximately half of the options per option type to take forward to the constrained stage for costing. That is, a selection of new water resource schemes, plus transfer and bulk supply, as well as treatment schemes were taken forward; the variety of options offering flexibility and resilience for the SES Water network as well as addressing the supply-demand deficit. The schemes on the constrained options list were developed with outline engineering designs and costing together with the assessment of environmental and social costs. This included an evaluation of the carbon footprint and the carbon costs, and an assessment of potential environmental impacts arising from construction and operation. Options that could help reduce a projected supply-demand deficit may be supply-side or demand-side measures. This report describes the supply-side options in detail with a summary of demand-side options which are reported in detail separately. 6
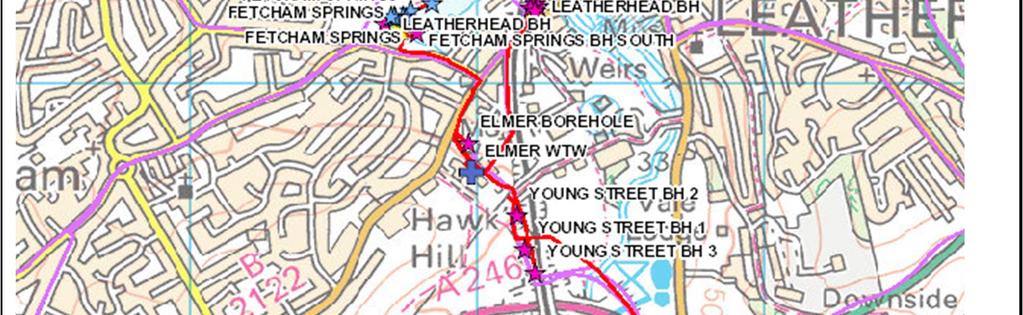
7 2. Unconstrained Screening The unconstrained screening stage is described in a separate report (, 2017a). A summary of the methodology and results is given here. 2.1 Unconstrained Screening Methodology The first step includes identifying show stoppers as part of an initial screening phase, which includes liaison with the Environment Agency. Such items include water availability and licensing policy, WFD status and risk of deterioration, and the risk to designated habitats. For options passing the initial screening, the second step assesses each option against further criteria. These related to technical difficulties such as construction impediments, water quality issues, uncertainty as to the yield benefit of the scheme, flexibility and adaptability to future needs, impacts to landscapes and communities, effect on flood risk, and drought resilience. Each criterion was scored with 1, 2, or 3 representing whether the criteria posed no impediment to the scheme, some issues which could be overcome, or a significant impediment. The rationale for scoring against the criteria was described which varied by option type. Scores were totalled to give an indication of the overall difficulty of implementing a scheme and its benefits. Different scheme types were compared separately because some criteria were not relevant to certain schemes, which gave them a lower possible score. 2.2 Unconstrained Option Results The process arrived at scored lists for water resource schemes, treatment schemes, and pipeline related transfer and bulk supply schemes. Approximately the top half of each list was selected to form the constrained list to take forward to costing. The list was checked to ensure that it offered a range of options across type and geography to maximise the flexibility of the potential assets. The SES Water sources and the constrained options are shown in Figure 1. 7


8 WRMP19 Options Appraisal Legend Existing source Option for new source New option at existing source Contains Ordnance Survey Data Crown Copyright and database right 2016 Figure 1. Location of sources and constrained options 8
9 3. Constrained Costing Methodology The following sections relate to supply-side options. The constrained options were described in a proforma format with a cost estimate based on the outline engineering designs which assessed the following: Option yield (at peak and average), CAPEX and OPEX (fixed and variable), Social and environmental costs (one off and annual), Carbon emitted and carbon costs (one off and annual), Estimates of the whole life costs of each option, including capital maintenance, A high level assessment of potential environmental impacts during construction and operation, including Water Framework Directive (WFD) status and Habitats Directive sites, An indicative development programme taking into account the need for any further studies and site investigations to aid the scheme design, environmental impact assessments, detailed design, and construction; and An understanding of any potential dependencies between options, or options that should only be taken forward if a similar solution is not implemented. The WRMP process requires Economics of Balancing Supply and Demand (EBSD) costing as per the WRPG which includes the following elements: Capital (CAPEX), Operational (OPEX) fixed and variable, environment and social (E&S) cost, carbon cost, and carbon quantity, for each scheme. There is no specification on how the costing is made in the guidance so the water company must decide what approach is suitable and proportionate for its circumstances. 3.1 Capital and Operational Costs There are broadly three approaches that can be taken. 1. Itemising costs (typically held by the water company) for each element of an option (e.g. all components related to borehole construction: drilling, steel casing, pumps, electricity, pipeline connection to treatment works etc.), as well as process costs, where all the components to an option have been bundled together (e.g. borehole construction may include drilling and casing and headworks). 2. Itemising costs by contacting various suppliers and building up a cost model from the bottom up, where the water company does not have a current list of items from the contractors they typically engage. 3. Industry standard typical costs. This approach considers typical costs for an item of infrastructure in its entirety from similar construction projects in the water industry. These are generally known from industry experience. The three approaches involve significantly different degrees of effort. As these schemes are high-level concepts with no detailed design elements, it is generally considered to be inappropriate to attempt to generate itemised costs for each component of the scheme, as this will require a significant number of assumptions that will mean the fine detail of component costs will not correlate with the uncertainty bounds of the final cost. Similarly, a list of component costs from the water company would be applied to a scheme without a detailed design, and therefore results in a cost with low confidence. In WRMP14 an options costing was derived by SES Water using an industry standard typical costs approach. The industry standard typical costs approach is considered most appropriate for the purposes of WRMP EBSD modelling, where the intention is to compare total CAPEX and OPEX costs over the lifetime of a scheme s asset to arrive at a least cost investment programme. 9
10 Therefore the WRMP costing process is a relatively high-level exercise for comparative purposes to go into EBSD modelling, and is not intended to be a tender specification or final cost for construction of a scheme. Where EBSD modelling identifies a group of schemes that provide the best cost and programme outcomes then it is assumed that these schemes would be the subject of detailed design and tendered or re-evaluated to obtain costs. For WRMP19, industry standard typical costs were compiled for construction (CAPEX); CAPEX costs tended to cluster around a consistent value with outliers present where schemes were more bespoke. Pipeline and treatment works costs tend towards a consistent cost per metre of pipeline and per volume of flow through treatment. However OPEX costs are more variable with local specific factors. In WRMP14 SES Water compared total business costs to volume of water delivered to estimate OPEX costs and it is understood that there has been no significant change. Therefore the OPEX costs for schemes brought forward from WRMP14 were used and for new schemes an equivalent WRMP14 scheme was used. 3.2 Social and Environmental Costs The aim of the environmental and social (E&S) assessment is to capture and value significant residual impacts (i.e. after mitigation) in relation to the natural environment as well as human impacts on landscape, heritage, business and recreation. The process involved the completion of a qualitative assessment to identify the likely significance of identified impacts, followed by a quantitative assessment. The E&S costing model is based on established sources used in WRMP with updates, including: Benefits Assessment Guidance (BAG) Environment Agency, 2004; Water Resource Planning Guideline The technical methods and instructions. Joint development by Environment Agency, Ofwat, Defra and the Welsh Government, June 2012; BAG User Guide, eftec, January 2012; In WRMP14 most schemes did not have E&S costs as it was demonstrated that there was no significant long term environmental impact. The details and assumptions behind this assessment are not known but this conclusion was accepted by the regulators for the WRMP14. In WRMP19 it was considered appropriate to undertake a qualitative E&S assessment to understand in more detail the E&S aspects. E&S costs were then quantified using the model described above. A qualitative ecosystems services appraisal was conducted in the context of the WRPG request to consider using an ecosystem services approach to environmental valuation to help to promote a consistent and integrated approach to environmental valuation across water environment planning. This consistency supports accountability and transparency, and helps with stakeholder engagement. As with the approach for CAPEX, it was considered proportionate and appropriate for EBSD modelling to use typical E&S costs for similar schemes, rather than input to a calculator for each scheme and carry a set of assumptions leading to uncertainty. E&S costs tend to depend on certain components which are consistent across the water industry. E&S one off costs relate to carbon inputs from construction and whether there is habitat loss. E&S ongoing costs relate to operation of the scheme, which essentially relates to energy use and the derived carbon cost, and if there is a permanent loss to the environment such as a designated habitat site. Where a water resource scheme removes water from the environment the ongoing costs largely depend on the population density around affected water bodies and habitats, the potential loss of amenity value, and effect on house prices. For schemes with no direct environmental impact, such as a treatment works upgrade where there is no new land take, then the E&S cost is largely associated with carbon costs from operation of the scheme. Therefore E&S costs were derived for each scheme based on option type, volume of flow through the scheme, whether there was a river where flow could be affected, and population density in the vicinity of the river. The approach taken is considered to reflect the WRPG guidance to use a method that is proportionate to the size of the problem, to use the building blocks approach, making a qualitative, quantitative then monetary assessment if necessary. As described above, all E&S costs were first assessed qualitatively to identify the scope of anticipated significant residual impacts during construction and operation stages. This process was undertaken by assigning anticipated (post-mitigation) magnitudes to impacts by category on a seven point scale given in Table 1. 10
11 Table 1. E&S Qualitative Assessment Scoring Criteria Score Rating Definition Major positive Significant impact - of national or international importance + + Moderate positive Important impact - at regional or local level + Minor positive Small scale impact - at local or regional level o Neutral No overall impacts of significance X Minor negative Small scale impact - at local or regional level XX Moderate negative Important impact - at regional or local level XXX Major negative Significant impact - of national or international importance Where a significant negative residual impact was described qualitatively, it was carried through into the quantitative assessment. Where no significant negative residual impact was identified, only the carbon cost of operating the scheme would comprise the E&S costs. Where the only E&S cost was a carbon cost, these were based on industry standard carbon emissions by option type and monetised using the traded and non-traded price for carbon, as provided in DECC guidance. 3.3 Carbon Emissions Carbon emissions, like OPEX, are specific to processes and the local setting. In WRMP14 SES Water estimated carbon emissions using a carbon calculator though the details are not known. It is considered that there has been no significant change as most WRMP14 schemes have been carried forward to WRMP19. For new schemes an equivalent WRMP14 scheme was applied. The carbon emissions associated with construction are a measure of the carbon embodied in the production of the main materials and items of equipment. An itemised bill of quantities for each scheme would be needed to calculate these emissions. The fixed and variable operational carbon emissions are therefore based on the consumption of energy for pumping and treatment, and the chemicals used relating to each option. These were not recalculated. The results of the calculator were reported in tonnes of carbon equivalent (tco 2e). Carbon dioxide equivalent is used as a representative for comparing the emissions from various greenhouse gases based upon their global warming potential. As described previously with regard to CAPEX costing, the WRMP process is a relatively high-level exercise for comparative purposes to go into EBSD modelling, and so using these values was considered appropriate for relative comparison of schemes which ultimately provides a carbon cost of a series of potential programmes of measures to address the supply-demand deficit. Proformas for all constrained options are provided in Appendix A. 11
12 4. Summary of Supply Side Options At the commencement of the constrained stage costing it was decided in consultation with SES Water that the option P1c should not be taken forward because the additional treatment works capacity proposed in this option was in excess of demand and the network s capacity to deliver the water. The option R1 to increase Bough Beech capacity was costed to include treatment works upgrades in line with the volume of additional yield this capacity could offer. The schemes represent a range of option types which offer SES Water resilience and flexibility in meeting demand. The schemes with the highest CAPEX costs were the Bough Beech reservoir expansion (R1) which is estimated to cost in the order of more than 10 times any other scheme. The Middle Mole abstraction (N6) was the second most expensive requiring more infrastructure inputs than other schemes. The Thames Water bulk supply at Merton (R10) was the next most expensive. All other options were half this cost or cheaper. The cheapest schemes were groundwater schemes at existing sources requiring limited infrastructure works, Outwood Lane (R22) and the Leatherhead Licence Increase (N4). Fixed operational costs were highest for the Thames Water bulk supply at Merton (R10) which was 2.5 times the cost of the next most expensive scheme, the North Downs Confined Chalk AR extension 1 (Bishopsford Road) (R2). The pipeline linking Pains Hill, Duckpit Wood and Chalk Pit Lane (N8) was the next most expensive. The cheapest schemes were Outwood Lane (R22) and the Leatherhead Licence Increase (N4), New Middle Mole abstraction (N6), New borehole (Mole Valley Chalk) - Fetcham Springs (R5), New Lower Mole Abstraction source (N5). The Thames Water bulk supply at Merton (R10) has the highest variable operational costs, while most other pipeline transfers and bulk supplies have the lowest variable operational costs, such as the Langley Park/North Looe Reservoirs to Outwood PS variants (R12, R13) and the bulk supply from South East Water (Maidenbower/Whitely Hill) to Outwood PS (R15). The pipeline linking Pains Hill, Duckpit Wood and Chalk Pit Lane (N8), lowering pumps at Kenley and Purley (R28) and Secombe Centre UV (R26) have the next highest costs. Other than the pipeline options the same schemes were cheapest as per fixed operational costs; Outwood Lane (R22) and the Leatherhead Licence Increase (N4), New Middle Mole abstraction (N6), New borehole (Mole Valley Chalk) - Fetcham Springs (R5), New Lower Mole Abstraction source (N5). E&S one-off costs were highest for options requiring the most infrastructure; the pipeline linking Pains Hill, Duckpit Wood and Chalk Pit Lane (N8), Bough Beech reservoir expansion (R1), and Lowering pumps at Kenley and Purley (R28) which also involves treatment upgrades. The lowest costs are for those schemes with the least infrastructure requirements such as Outwood Lane (R22), the Leatherhead Licence Increase (N4), and North Downs Confined Chalk AR extension 1 (Bishopsford Road) (R2). E&S ongoing costs are highest for new resource schemes that propose to take more water from the environment in a sensitive location, such as groundwater that provides baseflow to a nearby river. For the list of schemes this applies to those in the Mole catchment (R5, N4, N5 and N6). Although water is available for licensing at certain times of year the E&S calculator considers any change from the current condition to be a potential negative. Costing is largely a function of population density in the area of potentially affected ecology, whether waterfront properties are present and house prices may be affected, and whether river bank-side recreation is affected. Bough Beech is considered to have a positive ongoing cost (benefit) related to adding habitat. Groundwater schemes where there is little effect on surface waters have the lowest cost such as schemes in the upper Wandle catchment (R22, R28) and schemes in the confined Chalk (R2, R21). Some options described above were not taken forward to EBSD modelling because they do not carry a yield benefit in themselves, which is required by EBSD in order to solve the supply deficit problem. These schemes are internal pipeline schemes (R12, R13, R12-reverse, R13-reverse) which will improve the capacity of the network to move water from one location to another to meet demand from a range of supply sources. These are resilience options and the screening and outline costing conducted as part of the WRMP screening can be used by SES Water in their business planning. 12
13 5. Summary of Demand Side Options This section provides a summary of the costing process for demand-side options. The detail is provided in Appendix B including references for data sources. The unconstrained screening stage brought a variety of options through to the constrained stage for costing, including leakage, metering, and efficiency schemes. Tariff and rainwater harvesting schemes were not brought through to the costing stage. 5.1 Water Efficiency The considerations that were applied to the analysis of each of the water efficiency options were: The number of households targeted per year is based on a percent of total households; this can be overwritten or varied. The length of the programme (in years) is how long the delivery of the option lasts for and can be changed by the modeller. Longevity of savings defined as savings that persist for five years after installation, and based on the assumption that products such as tap inserts, low-flow showerheads and cistern displacement devices will remain installed for a relatively short time. An average value of five years has been used to represent this period of time, taking account of the likely period that these products are installed. More durable devices (such as ecobeta dual flush retrofits) and fixes of leaking toilets will last for a longer period. Uptake rate represents the percentage of the properties contacted that choose to take part in the programme. Suitability is the percentage of those properties that are suitable and end up receiving part or all of the retrofit. (This may also be affected by other factors such as appointments being met, etc.). Unit costs are based on SES Water actual cost where possible. The marketing cost varies according to the number of properties involved in the option. For most of the options, it was assumed that the water savings delivered in each year will persist at that level for a period of 5 years and then revert to zero. Where an option delivers over several years (e.g. over 5 years) then the year 1 savings endure until year 5, year 2 savings until year 6, etc. This provides a rectangular profile for water efficiency delivery (in the text below this is referred to as the original method). 5.2 Metering Meter costs are based on company-specific variables where possible, including meter cost, survey and installation cost, cost of meter reads, and supply pipe repair costs. The number of properties is obtained from the household demand forecast for the SES water resource zone. The maximum meter penetration is assumed to be 90% of total properties at the end of the forecast period (2080). Whilst compulsory meter for unmeasured households is proposed to be achieved in 10 years. The saving values for compulsory metering are based on results of metering projects presented in the update to the water efficiency evidence base. Dumb and AMR savings are based on the findings from Southern Water and South East Water. The additional effect of smart metering is based on results from the Anglian Water in-house display project (in the WEFF evidence base report). For compulsory metering using dumb/amr meters, we have used evidence from Southern Water (a Southampton University study). The study indicates overall saving, including anticipation effect, of 16.5% for AMR and we have initially used this value as the mean water saving. However, the additional saving obtained through AMR are based on more frequent readings and therefore more regular feedback to the customer. Because SES Water AMR meters are likely to be used as dumb, with no additional readings, the mean estimate is set a 14.5%. This has been agreed with SES Water. The lower 13
14 estimate of water savings taken from the same study suggests a 13.5% overall reduction in demand and reduced to 11.6% for the same reason. The upper saving of 18.5% reduction in demand is taken from the results of South East Water s metering programme (taken from table 48 of WEFF evidence base report) and reduced to 17.4%. For the additional effect of smart metering, 5.7 l/prop/d saving was used which is from the Anglian Water in-home display project This equates to a central value of 1.5% on average unmeasured household consumption. Lower and upper estimates are assumed at 1% and 2% respectively. Compulsory metering with smart meters is estimated to deliver 18% savings, based on the additional benefit of in-home displays (as per previous analysis). This is considered a conservative estimate, as further savings are likely from data that will be collected, e.g. on leakage, comparative consumption rates and trends in consumption over time. However this has not been included at present as there are no data to support this. Selective compulsory metering has been based on the assumption that highest users would reduce their consumption by the same percentages used for the other compulsory metering projects. However, this is unlikely to be the case, since there is insufficient evidence to investigate the potential savings based on household type. It is assumed to target the top 5% water users. A Smart Metering option has been added in at a later stage of the options process to assess cost and savings for a metering scenario of 80% meter penetration by 2024/25 and 90% by 2029/30. For this option, only meter install and maintenance costs for the additional meters were included. The meter read and back office infrastructure costs just for additional meters were included in the costs. Meter replacement is rate assumed to be 15 years. As for water efficiency options, the marginal cost of water has been considered to determine the value of water saved. 5.3 Leakage Increased find and fix leakage option costing assumes no change in the current ALC process other than a range of increases in manpower resource levels (beyond those required to deliver the short-run SELL) in order to achieve a reduced level of leakage. At some point these may be constrained by policy minimum / background leakage levels. The scope for new, additional or improved pressure management as an alternative to the current ALC process is assessed by inspection of control point (CP) pressures. CP pressures are compared with an agreed pressure threshold that will ensure that standards of service to customers would not be prejudiced. Mains renewal options assume different rates of mains renewals based on four scenarios supplied by SES Water. 5.4 Summary Costing tables for all options and comparison of option types is described in Appendix B. 14
15 6. EBSD Modelling 6.1 Approach Programme appraisal seeks to find the best way of balancing Supply and Demand from a set of feasible options. The approach being used for SES Water in PR19 is an EBSD (aggregated) approach, similar to the WRSE model used in programme appraisal at a regional level in PR14. The EBSD model used is highly flexible, and can be customised to suit water companies needs and has been used for several water company WRMP. This approach of using an existing methodology offers a number of advantages to SES Water, including: Tried and trusted; Meets regulatory requirements for a schedule of costed investments (Capex/Opex) and utilisation levels (ML/d) for different Planning Scenarios; and Same or similar data requirements to what SES Water provided for WRSE. The model produces a least cost optimised programme of investments over the Planning Period to meet the defined planning challenge. Spatial aggregation is at the level of Water Resource Zones (WRZ). There are 3 types of decision variables within the formulation: Binary: Which Options should be selected? Integer: In which year should the Option be selected / activated? Continuous: What utilisation should be made of the Option in each year of the Planning Period? In this context, an Option is any kind of intervention that will either increase available supply or reduce demand to a specific WRZ. The optimal solution will generally consist of multiple options activated in different start years which combine to give the overall least cost solution. The key input data for the model defines both the planning challenge, and the range of potential solutions to that challenge at the aggregated level of WRZ. All the modelling uses an annual time step. Different planning conditions that may arise within year are accounted for by using planning scenarios - Dry Year Annual Average (DYAA) and Dry Year Critical Period (DYCP). The diagram below provides a high-level view of the model operation. 15
16 Figure 2. EBSD Model Operation The optimisation routine finds the combination of decisions which together minimise the discounted cost of the investment programme whilst ensuring a supply-demand balance in both Dry Year Annual Average and Dry Year Critical Period. A high-level assumption is required to be made regarding the relative proportions of DYAA to DYCP within the dry year in order to estimate the overall variable operating costs within a year. The discounted costs are found using a function called Net Present Value (NPV); this computation converts future cash flows to a present-day value. It applies a progressively greater discount to costs incurred in future years. Thus, costs incurred far into the future are most heavily discounted. This encourages the model to delay expenditure in the optimised plan. 6.2 Data Requirements Baseline The baseline supply / demand balance (SDB) is developed to predict a future position with no new investment. It quantifies the size of any deficit in any WRZ on an annual basis. This defines the planning challenge to be solved by the EBSD optimisation. The SDB is defined as: Deployable output - the amount of water that can reliably be provided by an existing source Minus Minus Minus Minus Minus Climate change impacts - expected impacts on future deployable output Known Sustainability reductions Outage and process loses - expected impacts of non-availability of water supply assets Water demand - amount of potable water meet customer demand and leakage Target headroom - the allowance for uncertainty in the forecasted supply and demand. Estimates have been developed for these components in both Dry Year Annual Average (DYAA) and Dry Year Critical Period (DYCP). 16
17 The baseline included transfers between SES Water and other water companies that are already in operation or were planned based on WRSE modelling. The volumes involved were varied where required based on water company discussions. In particular SES Water transfer to South East Water at Whitely Hill was changed from a constant 5 Ml/d, to 5 Ml/d for the summer peak only with a 2.5 Ml/d annual average Feasible Options The EBSD model formulation is designed to ensure that different types of options can be appraised within the same framework. The options presented to the EBSD model are deemed to be feasible. The types of data required for each option are: Monetised Costs Impact on SDB Timing Constraints Interdependency Constraints A range of options have been developed which will contribute to reducing the forecast deficit in one of the four identified WRZ. These include a mix of option types. 6.3 Optimisation The objective of the model is to find the set of decisions (which Options, which Start Year, what utilisation) which minimise the total discounted cost whilst maintaining a supply demand balance in all zones throughout the planning period. There are 3 cost types which the model is able to consider: Capex initial and renewals Opex fixed and variable Monetised Carbon Solution costs will always be calculated for each of these three elements, however the user can choose to exclude one or two of these elements from the cost function to be minimised on a particular optimisation model run. This may be helpful to understand whether the solution is sensitive in this respect, e.g. does the inclusion / exclusion of Carbon costs affect the model decision CAPEX Capex expenditure may be of two types, initial capex associated with acquiring an asset, and renewals capex incurred periodically throughout the asset life. Within the EBSD model, there is an important pre-processing step where all the identified Capex expenditure for an option is used to create a single Annuitised Capex value. It is this Annuitised Capex value which the model will use to find the optimised solution. The Annuitised Capex value is applied in each year for a selected option from the first year of activation. Calculating an Annuitised Capex value is a way of avoiding biases which might otherwise stem from Assets/Interventions which have very different lives, or which have capital expenditure incurred over different lead times Fixed OPEX Fixed Opex refers to those operating costs which are incurred for an Option regardless of the yield benefit level. This may be constant over time (generally this is the assumption for supply options) or there could be a profile of 17
18 Fixed Opex costs over time. The model uses the Fixed Opex in a similar way to the Annuitised Capex, it will be applied in each year for a selected option from the first year of activation Variable OPEX Variable Opex (Vopex) refers to those operating costs which are related to the yield benefit level of the Option (in ML/d). The Unit Cost per ML/d needs to form an input for each Option. The total Vopex over a year is found from multiplying this Unit Cost by the utilisation in ML/d. The model anticipates that different utilisations for the same Option, in a single year may feature in the optimal programme. For example, a higher utilisation level in DYCP planning conditions to that in DYAA planning conditions may be optimal. Therefore, the Annual Vopex for an option are computed as follows by adding DYAA and DYCP Vopex costs, applying a weighting to represent the proportion of time in each. Weighted Variable Opex for a Year = Unit Cost ( k per ML/d) x Utilisation ML/d in DYAA x % of period which is DYAA + Unit Cost ( k per ML/d) x Utilisation ML/d in DYCP x % of period which is DYCP The unit cost ( k per ML/d) is a model input for each Option. The ML/d utilisation of an option within the optimised programme is a decision variable, and part of the modelling outputs Carbon Carbon created in the Option is input in tonnes of CO 2, which is then monetised through the use of a carbon calculation module within the model. This module takes into account a profile of future increasing carbon costs to produce a monetised figure which forms part of the objective cost function. 6.4 Planning and Assessment Periods Within the model there are two different time windows used - the Planning period and the Assessment period. These are partially user-configurable in length. The model works by minimising the overall costs for the assessment period in the most economic way to meet the supply demand balance in the planning period For PR19, the necessary planning period is 25 years, 2020 to SESW are undertaking model runs for a planning period of 60 years, i.e to The assessment period is the number of years of costs that the model takes into account in the calculation of a particular solution s NPV. This will be either equal to or longer than the planning period. A longer assessment period is recommended, and the SESW model is set up to use an 80-year assessment period although this is configurable. The assessment period should be of the same order as the asset life of the longest Option. This is because in annualising the Capex costs, the Capex is effectively spread over the asset life. Taking a longer cost assessment period avoids a risk of bias in selecting an expensive scheme in the later years of the planning period when this is reflecting only a small proportion of the capital outlay. The initial capex of a scheme is being spread over the asset life to produce an annuitised cost so this effect will be most pronounced on assets with long lives. Extending the assessment period beyond the period for which the model is solving the planning problem addresses this potential bias in the model. It requires an assumption of what the future utilisations and related variable operating costs will be. This is done by extrapolating the utilisation and costs in the final year of the planning period for the length of the assessment period. 18
19 6.5 Scenario Runs The EBSD model was run for numerous scenario types. Runs evolved in some instances in an iterative way; that is, the outcome of the previous run raised questions as to why the model selected or didn t select certain options, or decided to implement them at certain times. And in other instances runs were created in a way to force the model to discriminate against certain options to see what it would select instead. This iterative approach allowed SES Water to understand the drivers behind the modelling outcomes, such as costs, time frames for implementation of an option, and the yield benefit in the context of the rising demand profile with time. An Environmental run was undertaken by forcing the model not to select certain options. WFD screening, SEA screening, and discussions around sustainable catchments with the EA identified that three options (R22, R28, R8) were in catchments flagged by the EA as potentially requiring measures to achieve Good status or could put future status at risk. The EA advice was that these options could be taken forward because they were not Category 1 or 2 meaning that impacts were predicted for long into the future but the scenario was run to test what the model would select if these options were not available, to compare with other model runs. Levels of service scenario runs were conducted to test resilience by increasing demand and making the same options available to close the deficit. These were called levels of service runs. An additional scenario was created following consultation with stakeholders. Stakeholders expressed a preference for demand management rather than new supply options (, 2017b). These runs were designed to exclude supply options that the two sets of stakeholder groups independently decided were not desirable, leaving a smaller selection of supply options with all demand options available to the model. This approach meant that the model was not being forced to choose any particular demand or supply option, but was run to find a solution to the supply-demand deficit with a suite of option that included mostly demand management options. Further stakeholder runs were made utilising the preferences described above plus compulsory smart metering of selected households and mains renewal as well as runs including a greater penetration of smart metering. Each scenario was run under the worst drought in the historic record (WDHR) and a hypothetical 1 in 200 year drought. These scenario runs would enable SES Water to decide on the best programme of measures to suit their business from the range of programmes generated by EBSD modelling. 19
20 7. Conclusions The options selected by the EBSD model under each scenario are given below. The year of delivery is when the option becomes available to the EBSD model to draw water depending on demand, in the most cost effective way from amongst the range of options available in the scenario. Depending on operational costs the model will decide whether to use an option considering the amount of water required compared to other available water sources. The utilisation refers to whether the option, once available, was used in the model run period. The least cost option involved implementing demand side measures until the 2050s when new supplies would be required to meet the supply-demand deficit. This was achieved through mains renewal, pressure management to reduce leakage, and smart metering of selected households. Supply side options were the Outwood Lane pump capacity increase, Leatherhead licence increase, and new borehole at Fetcham Springs scheme. In the 2060s new demand options selected are additional leakage reduction, a variable infrastructure charge, and household works such as leaking toilets and toilet retrofit, with the new Lower Mole abstraction source an additional supply option. The options selected in each scenario are given in Table 2 below. Table 2. EBSD programmes for least cost scenario Least Cost WDHR Option Option Year Delivered Utilised (Y/N) SESW-LEA-399a: Mains renewal_a 2021 Y SESW-LEA-303: Enhanced pressure management 2021 Y SESW-MET-311: Smart metering of selected households 2046 Y SESW-NGW-R22: Outwood Lane 2051 Y SESW-NGW-N4: Leatherhead licence increase 2055 N SESW-NGW-R5: New borehole (Mole Valley Chalk) - Fetcham Springs 2058 N SESW-LEA-302b: Improve RM efficiency_b 2063 Y SESW-LEA-301a: Improve ALC efficiency_a 2063 Y SESW-WEF-308: Campaign targeting domestic customers with high consumption - leaking toilets 2063 Y SESW-WEF-307: Variable infrastructure charge 2065 Y SESW-WEF-157: Dual flush toilets retrofit 2065 Y SESW-NGW-N5: New Lower Mole Abstraction source 2068 N SESW-LEA-073f: Increased ALC effort_f 2075 Y SESW-WEF-022: Non HH WEFF company led self install 2075 Y SESW-WEF-305: Domestic retrofit targeting high consumers 2075 Y 20
21 Least Cost 1 in 200 Option Option Year Delivered Utilised (Y/N) SESW-LEA-399a: Mains renewal_a 2021 Y SESW-LEA-303: Enhanced pressure management 2021 Y SESW-NGW-N4: Leatherhead licence increase 2049 Y SESW-NGW-R22: Outwood Lane 2052 Y SESW-LEA-302a: Improve RM efficiency_a 2055 Y SESW-NGW-R5: New borehole (Mole Valley Chalk) - Fetcham Springs 2057 N SESW-LEA-301a: Improve ALC efficiency_a 2063 Y SESW-WEF-307: Variable infrastructure charge 2065 Y SESW-WEF-157: Dual flush toilets retrofit 2065 Y SESW-WEF-308: Campaign targeting domestic customers with high consumption - leaking toilets 2065 Y SESW-NGW-N5: New Lower Mole Abstraction source 2068 N SESW-WEF-022: Non HH WEFF company led self install 2075 Y SESW-WEF-305: Domestic retrofit targeting high consumers 2075 Y For the 1 in 200 year drought variant the Leatherhead licence increase supply option was selected by the model six years earlier with Outwood Lane being selected one year later, such that overall more new supply is available to meet the demand. The environmental runs resolved the supply-demand deficit in a very similar way to the least cost scenario because the options excluded from the environmental runs did not include two of the selected supply options in the least cost run. That is, compared to the least cost run the environmental run needed to find a different source to Outwood Lane. This was achieved with the New Lower Mole supply option entering service after 2059 and some alternative demand management options. For the 1 in 200 year drought variant the model resolved the supply demand deficit in a similar way to the least cost scenario again, by bringing forward supply options. Leatherhead licence increase supply option and new borehole at Fetcham Springs were both selected one year earlier. The options selected in each scenario are given in Table 3 below. 21
22 Table 3. EBSD programmes for environmental scenario Environmental WDHR Option Option Year Delivered Utilised (Y/N) SESW-LEA-399a: Mains renewal_a 2021 Y SESW-LEA-303: Enhanced pressure management 2021 Y SESW-NGW-N4: Leatherhead licence increase 2050 Y SESW-NGW-R5: New borehole (Mole Valley Chalk) - Fetcham Springs 2053 N SESW-NGW-N5: New Lower Mole Abstraction source 2059 N SESW-WEF-022: Non HH WEFF company led self install 2064 Y SESW-LEA-073g: Increased ALC effort_g 2065 Y SESW-LEA-301a: Improve ALC efficiency_a 2065 Y SESW-WEF-157: Dual flush toilets retrofit 2065 Y SESW-WEF-308: Campaign targeting domestic customers with high consumption - leaking toilets 2065 Y SESW-LEA-073c: Increased ALC effort_c 2067 Y SESW-LEA-073f: Increased ALC effort_f 2075 Y SESW-WEF-305: Domestic retrofit targeting high consumers 2075 Y SESW-LEA-302a: Improve RM efficiency_a 2077 Y Environmental 1 in 200 Option Option Year Delivered Utilised (Y/N) SESW-LEA-399a: Mains renewal_a 2021 Y SESW-LEA-303: Enhanced pressure management 2021 N SESW-NGW-N4: Leatherhead licence increase 2049 Y SESW-NGW-R5: New borehole (Mole Valley Chalk) - Fetcham Springs 2052 N SESW-LEA-302a: Improve RM efficiency_a 2057 Y SESW-NGW-N5: New Lower Mole Abstraction source 2059 N SESW-WEF-307: Variable infrastructure charge 2065 Y SESW-WEF-157: Dual flush toilets retrofit 2065 Y SESW-WEF-308: Campaign targeting domestic customers with high consumption - leaking toilets 2065 Y SESW-LEA-073g: Increased ALC effort_g 2066 Y SESW-LEA-301a: Improve ALC efficiency_a 2068 Y SESW-LEA-073f: Increased ALC effort_f 2075 Y The levels of service runs were at least four times more costly that the environmental runs. The model selected mains renewal and pressure management to reduce leakage in the 2020s and then in the 2040s brought in the three supply options used in the least cost runs. In the 2040s demand options are also required: smart metering of selected households and non-household retrofits. In the 2050s further leakage reduction options are selected and a variable infrastructure charge with a new supply source available in 2060, the new Lower Mole source. For the 1 in 200 year drought variant the supply options are each selected two years earlier. The new Lower Mole source is brought into supply four years earlier in Other demand and supply options change only marginally. The options selected in each scenario are given in Table 4 below. 22
23 Table 4. EBSD programmes for levels of service scenario Levels of Service WDHR Option Option Year Delivered Utilised (Y/N) SESW-LEA-399a: Mains renewal_a 2021 Y SESW-LEA-303: Enhanced pressure management 2021 Y SESW-NGW-R22: Outwood Lane 2042 Y SESW-WEF-022: Non HH WEFF company led self install 2044 Y SESW-MET-311: Smart metering of selected households 2045 Y SESW-NGW-N4: Leatherhead licence increase 2046 Y SESW-NGW-R5: New borehole (Mole Valley Chalk) - Fetcham Springs 2049 Y SESW-LEA-302c: Improve RM efficiency_c 2053 Y SESW-LEA-301b: Improve ALC efficiency_b 2054 Y SESW-LEA-073f: Increased ALC effort_f 2055 Y SESW-WEF-307: Variable infrastructure charge 2058 Y SESW-NGW-N5: New Lower Mole Abstraction source 2060 Y SESW-LEA-073g: Increased ALC effort_g 2064 Y SESW-LEA-073c: Increased ALC effort_c 2065 Y SESW-WEF-157: Dual flush toilets retrofit 2065 Y SESW-WEF-308: Campaign targeting domestic customers with high consumption - leaking toilets 2065 Y SESW-NGW-R28: Lowering pumps at Kenley and Purley 2074 N SESW-WEF-305: Domestic retrofit targeting high consumers 2075 Y 23
24 Levels of Service 1 in 200 Option Option Year Delivered Utilised (Y/N) SESW-LEA-399a: Mains renewal_a 2021 Y SESW-LEA-303: Enhanced pressure management 2021 Y SESW-NGW-R22: Outwood Lane 2040 Y SESW-NGW-N4: Leatherhead licence increase 2044 Y SESW-MET-311: Smart metering of selected households 2046 Y SESW-NGW-R5: New borehole (Mole Valley Chalk) - Fetcham Springs 2047 Y SESW-LEA-301a: Improve ALC efficiency_a 2051 Y SESW-LEA-302c: Improve RM efficiency_c 2054 Y SESW-NGW-N5: New Lower Mole Abstraction source 2056 Y SESW-LEA-073g: Increased ALC effort_g 2062 Y SESW-LEA-073f: Increased ALC effort_f 2062 Y SESW-WEF-307: Variable infrastructure charge 2065 Y SESW-WEF-157: Dual flush toilets retrofit 2065 Y SESW-WEF-308: Campaign targeting domestic customers with high consumption - leaking toilets 2065 Y SESW-NGW-R28: Lowering pumps at Kenley and Purley 2072 N SESW-WEF-022: Non HH WEFF company led self install 2075 Y SESW-WEF-305: Domestic retrofit targeting high consumers 2075 Y The stakeholder options excluded numerous supply side options and made certain demand management options mandatory. This scenario was more expensive that the least cost and environmental runs, and are up to three times more expensive than the levels of service runs. This scenario selected the same demand side options selected in the least cost runs however with a different mains renewal plan. With stakeholders excluded several supply side options, Outwood Lane was not implemented as in the least cost scenario, with the new Lower Mole source being brought forward four years. Smart metering of selected households is implemented in 2021 instead of 2046 to account for the loss of available supply options to choose from. For the 1 in 200 year drought variant additional efficiency measures are implemented in the 2060s to reduce demand, which allows the Kenley and Purley supply option to be no longer required. The options selected in each scenario are given in Table 5 below. 24
25 Table 5. EBSD programmes for stakeholder preferences scenario Stakeholder WDHR Option Option Year Delivered Utilised (Y/N) SESW-LEA-399d: Mains renewal_d 2021 Y SESW-LEA-303: Enhanced pressure management 2021 Y SESW-MET-311: Smart metering of selected households 2021 Y SESW-NGW-N4: Leatherhead licence increase 2055 Y SESW-NGW-R5: New borehole (Mole Valley Chalk) - Fetcham Springs 2057 Y SESW-NGW-N5: New Lower Mole Abstraction source 2064 Y SESW-WEF-308: Campaign targeting domestic customers with high consumption - leaking toilets 2065 Y SESW-LEA-302c: Improve RM efficiency_c 2070 Y SESW-WEF-307: Variable infrastructure charge 2070 Y SESW-NGW-R28: Lowering pumps at Kenley and Purley 2072 N SESW-WEF-022: Non HH WEFF company led self install 2075 Y SESW-WEF-021: Household WEFF programme partnering approach home visit 2075 Y SESW-WEF-305: Domestic retrofit targeting high consumers 2075 Y Stakeholder 1 in 200 Option Option Year Delivered Utilised (Y/N) SESW-LEA-399d: Mains renewal_d 2021 Y SESW-LEA-303: Enhanced pressure management 2021 Y SESW-MET-311: Smart metering of selected households 2021 Y SESW-NGW-N4: Leatherhead licence increase 2054 Y SESW-NGW-R5: New borehole (Mole Valley Chalk) - Fetcham Springs 2057 N SESW-LEA-302b: Improve RM efficiency_b 2063 Y SESW-NGW-N5: New Lower Mole Abstraction source 2065 N SESW-WEF-308: Campaign targeting domestic customers with high consumption - leaking toilets 2065 Y SESW-WEF-307: Variable infrastructure charge 2071 Y SESW-LEA-301a: Improve ALC efficiency_a 2073 Y SESW-WEF-022: Non HH WEFF company led self install 2075 Y SESW-WEF-021: Household WEFF programme partnering approach home visit 2075 Y SESW-WEF-305: Domestic retrofit targeting high consumers 2075 Y SES Water expressed their preference for the stakeholder scenario above compared to the other scenarios and so this was taken forward for additional runs implementing further penetration of smart metering and an export related to the identification during WRSE modelling of a transfer to South East Water, which would be operable from 2035 at 10 Ml/d peak, and 2.5 ML/d annual average. This stakeholder scenario represented SES Water s preferred plan which was then subject to a strategic environmental assessment which is described separately (, 2017c). The preferred plan is given in Table 6. EBSD model summary outputs are given in Appendix C. 25
26 Table 6. Preferred programme utilising additional stakeholder preferences scenario Final Plan WDHR Option Option Year Delivered Utilised (Y/N) SESW-MET-555: Compulsory smart metering - higher meter penetration 2020 Y SESW-LEA-399d: Mains renewal_d 2020 Y SESW-LEA-303: Enhanced pressure management 2020 Y SESW-EXW-WAF1 : Existing WAFU Sources 2020 Y SESW-NGW-N4: Leatherhead licence increase 2054 Y SESW-NGW-R5: New borehole (Mole Valley Chalk) - Fetcham Springs 2057 N SESW-NGW-N5: New Lower Mole Abstraction source 2063 N SESW-WEF-308: Campaign targeting domestic customers with high consumption - leaking toilets 2065 Y SESW-WEF-307: Variable infrastructure charge 2069 Y SESW-WEF-157: Dual flush toilets retrofit 2069 Y SESW-LEA-302c: Improve RM efficiency_c 2070 Y SESW-LEA-301a: Improve ALC efficiency_a 2071 Y SESW-RTR-N8: Pipeline linking Pains Hill, Duckpit Wood and Chalk Pit Lane to existing treatment works at Westwood and Godstone 2074 N SESW-WEF-022: Non HH WEFF company led self install 2075 Y SESW-WEF-305: Domestic retrofit targeting high consumers 2075 Y Final Plan 1 in 200 Option Option Year Delivered Utilised (Y/N) SESW-MET-555: Compulsory smart metering - higher meter penetration 2020 Y SESW-LEA-399d: Mains renewal_d 2020 Y SESW-LEA-303: Enhanced pressure management 2020 Y SESW-EXW-WAF1 : Existing WAFU Sources 2020 Y SESW-NGW-N4: Leatherhead licence increase 2053 N SESW-NGW-R5: New borehole (Mole Valley Chalk) - Fetcham Springs 2056 N SESW-LEA-302c: Improve RM efficiency_c 2057 Y SESW-NGW-N5: New Lower Mole Abstraction source 2064 N SESW-WEF-307: Variable infrastructure charge 2065 Y SESW-WEF-308: Campaign targeting domestic customers with high consumption - leaking toilets 2065 Y SESW-LEA-073f: Increased ALC effort_f 2073 Y SESW-WEF-022: Non HH WEFF company led self install 2075 Y SESW-WEF-021: Household WEFF programme partnering approach home visit 2075 Y SESW-WEF-305: Domestic retrofit targeting high consumers 2075 Y SESW-RTR-N8: Pipeline linking Pains Hill, Duckpit Wood and Chalk Pit Lane to existing treatment works at Westwood and Godstone 2078 N 26
27 8. References, 2017a. SES Water Draft Water Resources Management Plan Options Appraisal Supply-Side., 2017b. Water Supply Constrained Options Appraisal. Stakeholder Engagement Report., 2017c. SES Water Draft Water Resources Management Plan Strategic Environmental Assessment (SEA). Environment Report Artesia, WRMP19 Demand Management Options Assessment of Feasible Demand Management Options 27
28 Appendix A Constrained Options Proformas 27
29 Name Code Description Leatherhead licence increase N4 Scheme to increase licence by 2 Mld to take water available at least 50% of the time in CAMS policy. Treat at Elmer WTW as per existing source where there is existing capacity. Dependencies None Value Assumptions Maximum Utilisation (ML/d) Peak Upper Limit of Max Utilisation 0 Additional licensable water available for half the year so assume not available for peak period use. Peak Lower Limit of Max Utilisation Average Upper Limit of Max Utilisation 0 Additional licensable water available for half the year so assume not available for peak period use. 2 Maximum quantity available for licensing Average Lower Limit of 1 Lower possible bound of yield and borehole capacity Max Utilisation Earliest Start Year 2020 Assumed at start of next cycle Construction period (years) 1 Assume 1 year for replacement or modification of pumps and licensing Capex ( ) Cost based on typical industry standard costs for pump replacement/enhancement only so at lower end of cost range. Fixed Opex ( /yr) 2000 Cost based on typical costs for similar schemes in WRMP14. eg R5, reduced due to low pumping rate Variable Opex (p/m3) 13 Cost based on typical costs for similar schemes in WRMP14. eg R5, R22, R28 E&S One-Off ( ) 3000 Typical value for groundwater scheme used from E&S costing calculator at low end of range due to limited infrastructure requirements and no additional treatment. Cost largely a function of CAPEX related carbon costs. E&S Annual ( /year) 200,000 Typical value for groundwater scheme used from E&S costing calculator for proximity to stream with minor effects. Cost largely a function of population density in area of potentially affected ecology, whether waterfront properties are present and house prices may be affected, and whether river bankside recreation is affected. Carbon One-Off 19.9 Estmate based on similar scheme from (tco2e) Carbon Fixed (tco2e / n/a Estmate based on similar scheme from year) Carbon Variable Estmate based on similar scheme from (tco2e / Ml) Min Cost Down (%) 10 Based on complexity of scheme Max Cost Uplift (%) 10 28


30 29
31 Name Code Description New Lower Mole Abstraction source N5 Water availability in CAMS at least 50% of the time below Leatherhead. Scheme is to identify new source location for groundwater abstraction from the Chalk or surface water abstraction (or river terrace gravels). Pipeline required for treatment at Elmer WTW where there is existing capacity. Depending on land access can be as short a pipeline distance as possible once down gradient of CAMS assessment point at Leatherhead. Using this source for the 50% of water availabliity reduces the ADO on other sources which means they can be increased above current ADO when in use to meet existing annual licence. Dependencies None Value Assumptions Maximum Utilisation (ML/d) Peak Upper Limit of Max Utilisation 0 Additional water in CAMS only available for half the year so likely to exclude the peak period. Peak Lower Limit of Max Utilisation Average Upper Limit of Max Utilisation Average Lower Limit of Max Utilisation Likely yield based on historic rates at Leatherhead and Fetcham Maximum quantity available for licensing. This is only available for half the year. Likely yield based on historic rates at Leatherhead and Fetcham. For EBSD purposes use 5 Mld to reflect that 10 MLd could be yielded for half the year only. Earliest Start Year 2020 Assumed at start of next cycle Construction period Assume 3 years for drilling, testing, licensing and connection to 3 (years) network Cost based on typical industry standard costs for borehole with associated pipeline WRMP options appraisal. Involves borehole construction and not just pump replacement or refurbishment, and short distance pipeline, so at lower end of cost range for full boreholes schemes plus pipelines. Capex ( ) 3,500,000 Fixed Opex ( /yr) 2900 Variable Opex (p/m3) E&S One-Off ( ) E&S Annual ( /year) = 6000 Connection to local raw water main at Leatherhead boreholes approximately 400m away, based on SESW land owned downstream of Leatherhead gauging station, where water taken to Elmer WTW for treatment where there is existing capacity. Cost based on WRMP14 cost for drilling new borehole at Fetcham (R5) Cost based on WRMP14 cost for drilling new borehole at Fetcham (R5) Typical value for groundwater with pipeline scheme from E&S costing calculator. Typical pipeline cost per metre and borehole without additional treatment requirements. Cost largely a function of CAPEX related carbon costs. 200,000 Typical value for groundwater scheme used from E&S costing calculator for proximity to stream with minor effects. Cost largely a function of population density in area of potentially affected ecology, whether waterfront properties are present and house prices may be affected, and whether river bank-side recreation is affected. Carbon One-Off As per similar scheme from 2014 assessment (i.e. R5 and R6) (tco2e) Carbon Fixed (tco2e / As per similar scheme from 2014 assessment (i.e. R5 and R6) n/a year) Carbon Variable As per similar scheme from 2014 assessment (i.e. R5 and R6) 6.885E-07 (tco2e / Ml) Min Cost Down (%) 30 Based on complexity of scheme Max Cost Uplift (%) 30 30

32 31
33 Name Code Description New Middle Mole Abstraction source N6 Water availability in CAMS at least 50% of the time in Dorking area. Scheme is to identify new source location for groundwater abstraction from the Lower Greensand or surface water abstraction along the River Mole east of Dorking. Existing Dorking Lower Greensand abstraction delivered to Elmer WTW for treatment, so can use existing infrastructure to add additional source. Alternatively additional volume could be delivered via a new pipe connection to Headley Reservoir or Buckland Booster to deliver it to the Buckland area and north toward Croydon where there is greater demand, improving network resilience. Using this source for the 50% of water availabliity reduces the ADO on other sources which means they can be increased above current ADO when in use to meet existing annual licence. Dependencies None Value Assumptions Maximum Utilisation (ML/d) Peak Upper Limit of Max Utilisation Peak Lower Limit of Max Utilisation Average Upper Limit of Max Utilisation Maximum quantity available for licensing dependent on whether scheme also used at average and hence remaining water available at peak Lower possible bound of yield and borehole capacity Maximum quantity available for licensing Average Lower Limit of Lower possible bound of yield and borehole capacity 10 Max Utilisation Earliest Start Year 2020 Assumed at start of next cycle Construction period Assume 3 years for drilling, testing, licensing and connection to 3 (years) network Cost based on typical industry standard costs for borehole with associated pipeline WRMP options appraisal. Involves borehole construction and not just pump replacement or refurbishment so at upper end of cost range. Capex ( ) 10,000,000 Connection to local raw water main approximately 7km dependent on siting where water taken to Elmer WTW for treatment where there is existing capacity. Standard borehole design and pump installations. Fixed Opex ( /yr) 2900 Cost based on WRMP14 for similar scheme at Fetcham (R5) Variable Opex (p/m3) Cost based on WRMP14 for similar scheme at Fetcham (R5) E&S One-Off ( ) ,000 = 19,000 Typical value for groundwater with pipeline scheme from E&S costing calculator. Typical pipeline cost per metre and borehole without additional treatment requirements. Cost largely a function of CAPEX related carbon costs. 200,000 Typical value for groundwater scheme used from E&S costing calculator for proximity to stream with minor effects. Cost largely a function of population density in area of potentially affected E&S Annual ( /year) ecology, whether waterfront properties are present and house prices may be affected, and whether river bank-side recreation is affected. Carbon One-Off As per similar scheme from 2014 assessment (i.e. R5 and R6) (tco2e) Carbon Fixed (tco2e / As per similar scheme from 2014 assessment (i.e. R5 and R6) n/a year) Carbon Variable As per similar scheme from 2014 assessment (i.e. R5 and R6) 6.885E-07 (tco2e / Ml) Min Cost Down (%) 30 Based on complexity of scheme Max Cost Uplift (%) 30 32


34 33
35 Name Code Description Dependencies Pipeline linking Pains Hill, Duckpit Wood and Chalk Pit Lane to existing treatment works at Westwood and Godstone N8 Pipeline linking Pains Hill, Duckpit Wood and Chalk Pit Lane to existing treatment works at Westwood and Godstone (alternative to R24 and R25). Making use of existing spare capacity at Godstone WTW. Includes the construction of one pumping station and approximately 12km of pipework through suburban and rural roads and fields. Assumed +300mm diameter None Value Assumptions Maximum Utilisation (ML/d) Peak Upper Limit of Max Utilisation 5.54 Maximum designed benefit Peak Lower Limit of Max Utilisation Average Upper Limit of Max Utilisation 1 Assumed risk of lower abstraction in drier years 4.77 Maximum designed benefit Average Lower Limit of 1 Assumed risk of lower abstraction in drier years Max Utilisation Earliest Start Year 2020 Assumed start of next cycle Construction period 10 Assume 10 years for design, permissions, construction (years) Capex ( ) 3,000, ,300,000 = 4,300,000 Cost based on typical industry standard costs for construction of approximately 12km of below ground pipework. Plus cost of additional treatments works at Pains Hill and Duckpit Wood (2.14 Mld) at typical industry cost of 600k per Mld. Fixed Opex ( /yr) 30, ,000 = 48,050 Variable Opex (p/m3) = 26 New option requiring assessment based on equivalence with WRMP14 costed options. No clear equivalence by length of pipeline, column pumped or terrain. R15 WRMP14 values used as a mid range cost. Scheme incorporates WRMP14 schemes for treatment options so same values used (average of both schemes). New option requiring assessment based on equivalence with WRMP14 costed options. No clear equivalence by length of pipeline, colume pumped or terrain. R15 values used as a mid range cost. Scheme incorporates WRMP14 schemes for treatment options so same values used (average of both schemes). E&S One-Off ( ) E&S Annual ( /year) 500, ,000 = 541,000 24, ,300 = 30,300 Typical value for pipeline scheme from E&S costing calculator. Middle of range requiring pumping stations and pipeline. Cost largely a function of CAPEX related carbon costs. Typical value for treatment works used from E&S costing calculator per Mld (2.14 Mld). Cost largely a function of CAPEX related carbon costs. 19,000 per Mld. Based on typical costs from E&S calculator for pipeline schemes. Costs largely a function of pumping across distance carbon costs at typically 2/metre. Assumes no loss of priority habitat or stream ecology impacts by careful routing. Typical value for treatment scheme used from E&S costing calculator for site that does not reduce priority habitats. Cost largely a function of carbon operational running costs. Typically 3000 per Mld. Carbon One-Off (tco 2 e) = 3317 Based on WRMP14 costing for R2, scaled up for pipeline length. Treatment works as per WRMP14. Carbon Fixed (tco 2 e/year) Carbon Variable (tco 2 e/ml) N/A = Based on WRMP14 costing for R2, scaled up for pipeline length. Treatment works as per WRMP14 average ongoing cost for combined schemes. Min Cost Down (%) 50 Based on uncertainty around WRMP14 costing rationale Max Cost Uplift (%) 50 34


36 35
37 Name Code Description Dependencies Raising of Bough Beech reservoir R1 Raising the Bough Beech reservoir embankment would increase the volume of stored water, which would provide an increase in the average yield from the reservoir. This option has been included to demonstrate the costs and likely increases in average yield from such a scheme. Based on available drawings of the earth dam alignment, a 3m raising of the embankment would appear to be feasible. It is likely that some realignment of the embankment locally to the small housing development on the north side of the embankment would be required. A detailed study would be necessary to confirm the viability of this scheme. A 3m raising of the embankment would increase the storage volume of the reservoir by approximately 3,600Ml. The Aquator model of the Bough Beech reservoir system was used to estimate the additional average yield created by the dam raising. It is estimated that the scheme would provide an additional annual average yield of 5.5Ml/d, but no increase in peak output which is constrained by the WTW capacity. None Value Assumptions Maximum Utilisation (ML/d) Peak Upper Limit of Max Utilisation Peak Lower Limit of Max Utilisation Average Upper Limit of Max Utilisation 0 Average scheme only 0 Average scheme only 4.9 Maximum designed benefit Average Lower Limit of 2 Assumed risk of lower abstraction in drier years Max Utilisation Earliest Start Year 2020 Assumed start of next cycle Construction period 10 Assume 10 years for design, permissions, construction (years) Capex ( ) 150,000,000 Cost based on typical industry standard costs for reservoirs. Including embankment, pipework and treatment upgrades. Similar to WRMP14 estimate. Fixed Opex ( /yr) 31,940 As per 2014 assessment. Variable Opex (p/m3) As per 2014 assessment. E&S One-Off ( ) 500,000 Typical costs from E&S calculator. E&S one-off costs associated with carbon emissions from construction. Assumed to include storage structure plus treatment and pipework upgrades. E&S Annual ( /year) As per 2014 assessment. Note that E&S impacts are anticipated to be positive. Carbon One-Off As per 2014 assessment. (tco 2 e) Carbon Fixed N/A As per 2014 assessment. (tco 2 e/year) Carbon Variable As per 2014 assessment. (tco 2 e/ml) Min Cost Down (%) 30 Based on complexity of scheme Max Cost Uplift (%) 30 36


38 37
39 Name Code Description Dependencies North Downs Confined Chalk AR extension 1 (Bishopsford Road) R2 Bishopsford Rd borehole was drilled and constructed in This scheme connects the borehole into the Cheam WTW East Main at Goatbridge. The objective of the scheme is to increase the PDO of the licence group by allowing recovery of the artificially recharged volume at Hackbridge at a higher abstraction rate over a shorter period of time during the subsequent peak demand period. In order to realise this 5 Ml/d increase in PDO, a licence variation would be required allowing a 5 Ml/d increase in the daily licence from 19 Ml/d to 24 Ml/d. This scheme connects the existing licensed borehole into the WTW A East Main at Source. Estimated approximately 1.2km pipeworks for 600mm pipe as coordinates are not immediately available. Value Assumptions Maximum Utilisation (ML/d) Peak Upper Limit of Max Utilisation Peak Lower Limit of Max Utilisation Average Upper Limit of Max Utilisation Anticipated yield. Assumed lower end of likely yield Peak scheme only Average Lower Limit of Peak scheme only 0 Max Utilisation Earliest Start Year 2020 Assumed start of next cycle Construction period (years) 3 Capex ( ) 640,000 Cost based on typical industry standard costs for pipeline construction Fixed Opex ( /yr) As per 2014 assessment Variable Opex (p/m3) As per 2014 assessment E&S One-Off ( ) 2,000 E&S Annual ( /year) 2,400 Typical value for transfer scheme from E&S costing calculator. Typical pipeline cost per metre without associated treatment requirements. Cost largely a function of CAPEX related carbon costs. Based on typical costs from E&S calculator for pipeline schemes. Costs largely a function of pumping across distance carbon costs at typically 2/metre. Assumes no loss of priority habitat or stream ecology impacts by careful routing. Carbon One-Off (tco 2 e) 304 As per 2014 assessment Carbon Fixed (tco 2 e/year) N/A As per 2014 assessment Carbon Variable (tco 2 e/ml) As per 2014 assessment Min Cost Down (%) 30 Based on complexity of scheme Max Cost Uplift (%) 30 38


40 39
41 Name Code Description New borehole (Mole Valley Chalk) - Fetcham Springs R5 The PDO of the Fetcham Spring/Boreholes source could potentially be increased by 3.148Ml/d to the peak licence by the installation of new boreholes which would allow abstraction above the current potential yield of the source. The scheme comprises the installation of a collector well and radiating horizontal boreholes to intercept natural springflow and minimising drawdown thereby reducing the environmental impact on natural groundwater flow to the River Mole. Potential for an ADO scheme based on licence usage, assuming works described above enable additional yield to be abstracted. Fetcham springs averages MLd compared to a licensed daily rate Mld. Data from indicates that the licence offers 4.78 Mld on average if borehole can be made to yield. Dependencies None Value Assumptions Maximum Utilisation (ML/d) Peak Upper Limit of Max Utilisation Peak Lower Limit of Max Utilisation Average Upper Limit of Max Utilisation Average Lower Limit of Max Utilisation Maximum quantity available for licensing 2 Lower possible bound of yield and borehole capacity 4.78 Maximum quantity available for licensing 2 Lower possible bound of yield and borehole capacity Earliest Start Year 2020 Assumed at start of next cycle Construction period (years) 3 Assume 3 years for drilling, testing, licensing and connection to network Capex ( ) 2,000,000 Cost based on typical industry standard costs for borehole WRMP options appraisal. Involves borehole construction and not just pump replacement or refurbishment so at upper end of cost range. Connection to local main only at short distance where water taken to Elmer WTW for treatment where there is existing capacity. Standard borehole design and pump installations. Fixed Opex ( /yr) 2900 As per 2014 assessment. Variable Opex (p/m3) As per 2014 assessment. E&S One-Off ( ) Typical value for groundwater scheme used from E&S costing 5000 calculator at middle of range related to borehole infrastructure with only limited pipeline requirements and no additional treatment. Cost largely a function of CAPEX related carbon costs. E&S Annual ( /year) 200,000 Typical value for groundwater scheme used from E&S costing calculator for proximity to stream with minor effects. Cost largely a function of population density in area of potentially affected ecology, whether waterfront properties are present and house prices may be affected, and whether river bankside recreation is affected. Carbon One-Off As per 2014 assessment (tco 2 e) Carbon Fixed N/A As per 2014 assessment (tco 2 e/year) Carbon Variable As per 2014 assessment (tco 2 e/ml) Min Cost Down (%) 30 Based on complexity of scheme Max Cost Uplift (%) 30 40


42 41
43 Name Code Description Upgrade WTW (Lower Greensand) - The Clears ammonia and pesticide treatment R8 The Cliftons Lane Licence Group (Cliftons Lane, Buckland and The Clears) ADO is constrained by combination of DAPWL (Cliftons Lane) and water quality (Buckland) but is only 1.6 Ml/d short of licence based on difference between daily average licence and abstraction returns from , so little scope for significant increase in ADO. The Group PDO is constrained by combination of DAPWL (Cliftons Lane - base of the confining layer) and water quality (Buckland) and is 2.57Ml/d short of group licence. PDO could potentially be increased by 2.57Ml/d by provision of ammonia treatment at The Clears (or possibly Buckland) to allow pumping reintroduction of the source (or pumping beyond the operational guideline of 1.4Ml/d at Buckland). This scheme is therefore to provide ammonia removal plant (ion exchange with zeolite) and GAC adsorbers (for residual pesticides) on site at The Clears. The anticipated ADO gain is 0.38 Ml/d and the PDO gain is 2.57 Ml/d. Dependencies None Value Assumptions Maximum Utilisation (ML/d) Peak Upper Limit of Max Utilisation Peak Lower Limit of Max Utilisation Average Upper Limit of Max Utilisation Average Lower Limit of Max Utilisation Maximum estimated benefit Based on WTW design full benefit anticipated Maximum estimated benefit Based on WTW design full benefit anticipated Earliest Start Year 2020 Assumed start of next cycle Construction period Assume 3 years for WTW design, permissions, construction 3 (years) Capex ( ) 1,500,000 Cost based on typical industry standard costs for treatment works upgrades for MLd capacity. ( 600k per Mld used). Fixed Opex ( /yr) 25,000 As per 2014 assessment. Variable Opex (p/m3) 18.2 As per 2014 assessment. E&S One-Off ( ) 48,830 E&S Annual ( /year) Typical value for treatment works used from E&S costing calculator per Mld. Cost largely a function of CAPEX related carbon costs. 19,000 per Mld. 7,710 Typical value for treatment scheme used from E&S costing calculator for site that does not reduce priority habitats. Cost largely a function of carbon operational running costs. Typically 3000 per Mld. Carbon One-Off (tco 2 e) As per 2014 assessment. Carbon Fixed (tco 2 e/year) N/A As per 2014 assessment. Carbon Variable (tco 2 e/ml) As per 2014 assessment. Min Cost Down (%) 30 Based on complexity of scheme Max Cost Uplift (%) 30 42


44 43
45 Name Code Description 15Ml/d bulk supply from Thames Water (London WRZ) to SESW at Merton R10 This option involves the same infrastructure components as the 30Ml/d transfer scheme, but each component is instead sized to accommodate a 15Ml/d bulk transfer from Thames Water's London ring main into the north of SESW at Merton. The scheme comprises a new pumping station at Merton, significant mains upgrade works to transport water from Merton to Cheam WTW, where it will require additional softening at a new ion exchange softening plant before being blended with the other water treated at Cheam and distributed throughout the SESW area. Two new distribution mains will then also be required to transport the water from Cheam WTW to SESW's North Looe and Langley Park service reservoirs, for onward distribution throughout the network. This scheme is mutually exclusive with the other two size variants of this option. This option includes 14km pipework running from Merton to North Looe Reservoir via Langley Park, a medium size pumping station for 15Ml/d transfer. The price includes a softening plant, however, consideration of the feasibility for introducing this feature is recommended. Dependencies None Value Assumptions Maximum Utilisation (ML/d) Peak Upper Limit of Max Utilisation Peak Lower Limit of Max Utilisation Average Upper Limit of Max Utilisation 15 Design capacity 15 Assume capacity can be met from a variety of sources 15 Design capacity Average Lower Limit of Max Utilisation 15 Assume capacity can be met from a variety of sources Earliest Start Year 2020 Assumed start of next cycle Construction period (years) 10 Assume 10 years for design, permissions, construction Capex ( ) 7,600,000 Cost based on typical industry standard costs for construction of four pumping stations to transport 12Ml/d and approximately 14km below ground pipework. Fixed Opex ( /yr) 131,150 As per WRMP14 assessment Variable Opex (p/m3) As per WRMP14 assessment E&S One-Off ( ) 212,000 As per WRMP14 assessment E&S Annual ( /year) 28,000 Based on typical costs from E&S calculator for pipeline schemes. Costs largely a function of pumping across distance carbon costs at typically 2/metre. Assumes no loss of priority habitat or stream ecology impacts by careful routing. Carbon One-Off (tco 2 e) 2092 As per WRMP14 assessment Carbon Fixed (tco 2 e/year) N/A As per WRMP14 assessment Carbon Variable (tco2e/ml) As per WRMP14 assessment Min Cost Down (%) 30 Based on complexity of scheme Max Cost Uplift (%) 30 44


46 45
47 Name Code Description 10Ml/d bulk supply from SEW RZ2 (Maidenbower/Whitely Hill) to Outwood PS R15 This option involves a 10Ml/d bulk supply from South East Water's (SEW's) RZ2 at Whitely Hill into SESW at Outwood. A new pumping station would be required at Whitely Hill, a new treated water transfer main to transport water north to Outwood, and a new softening plant at Outwood to soften the water prior to distribution throughout the network. This variant of the option is not mutually exclusive with the 5Ml/d option, i.e. there could be in total a 15Ml/d transfer. Includes the construction of a pumping station and approximately 14km pipework via an outlined route via fields and rural roads to transport 10Ml/d. Softening plant preliminary costings included, however, it is strongly advised a feasibility study of the requirements for softening plant infrastructure is undertaken. Dependencies None Value Assumptions Maximum Utilisation (ML/d) Peak Upper Limit of Max Utilisation Peak Lower Limit of Max Utilisation Average Upper Limit of Max Utilisation 10 Design capacity 10 Assume capacity can be met from a variety of sources 10 Design capacity Average Lower Limit of Max Utilisation 10 Assume capacity can be met from a variety of sources Earliest Start Year 2020 Assumed start of next cycle Construction period Assume 10 years for design, permissions, construction 10 (years) Cost based on typical industry standard costs for construction Capex ( ) 3,400,000 of one pumping station, softening plant, and approximately 14km below ground pipeworks to transport 10Ml/d. Fixed Opex ( /yr) 30,050 As per 2014 assessment Variable Opex (p/m3) 6.03 As per 2014 assessment E&S One-Off ( ) 30,000 E&S Annual ( /year) 28,000 Carbon One-Off (tco 2 e) Carbon Fixed (tco 2 e/year) Carbon Variable (tco2e/ml) N/A Typical costs for pipeline scheme from E&S costing calculator per metre. Softening not considered to carry significant cost compared to typical treatments. Based on typical costs from E&S calculator for pipeline schemes. Costs largely a function of pumping across distance carbon costs at typically 2/metre. Assumes no loss of priority habitat or stream ecology impacts by careful routing. As per 2014 assessment As per 2014 assessment As per 2014 assessment Min Cost Down (%) 30 Based on complexity of scheme Max Cost Uplift (%) 30 46


48 47
49 Name Code Description North Downs Confined Chalk AR extension 2 (new borehole on SE side of Football Club) R21 The scheme comprises the drilling of another borehole approximately halfway between Goatbridge and Bishopsford Road boreholes. Subject to a licence variation, this borehole would allow recovery of the water that has been artificially recharged at Hackbridge between November and March at a higher rate and over a shorter period of time than is currently possible. This would effectively increase the PDO by an assumed 5Ml/d to allow the Company to address increases in peak demand from Cheam over the summer months. The annual licence would remain unchanged. Potential for an ADO scheme has been considered by comparing the Cheam group daily average licence limit with abstraction returns for the group from The group licence offers an average headroom of 2.16 Mld. If this quantity was taken from Cheam and discharged at the Hackbridge discharge borehole then this could offer average use as well as peak. Dependencies This scheme is contingent on the Bishopsford Road borehole scheme (R2) being implemented first as it is effectively an extension of that scheme and assumes that it would tap into a new main running to Bishopsford Rd. Value Assumptions Maximum Utilisation (ML/d) Peak Upper Limit of Max Utilisation 5 Maximum estimated benefit Peak Lower Limit of Max Utilisation Average Upper Limit of Max Utilisation 2 Minimum likely yield 2.16 Headroom avialable on existing licence Average Lower Limit of 2 Minimum likely yield Max Utilisation Earliest Start Year 2025 Assumed after completion of R2 Construction period (years) 2 Assume 2 years for borehole construction and connection to network, and licence change Capex ( ) 2,000,000 Cost based on typical industry standard costs for borehole WRMP options appraisal. Involves borehole construction and not just pump replacement or refurbishment so at upper end of cost range. Connection to local main only at approximately 0.5km distance to connect to main Bishopsford Road to Goatbridge. Standard borehole design and pump installations. Fixed Opex ( /yr) 8310 As per 2014 assessment Variable Opex (p/m3) As per 2014 assessment E&S One-Off ( ) = 6000 Typical value for groundwater with pipeline scheme from E&S costing calculator. Typical pipeline cost per metre and borehole without additional treatment requirements. Cost largely a function of CAPEX related carbon costs. E&S Annual ( /year) 2,000 Typical value for groundwater scheme used from E&S costing calculator for distant from stream with minor effects. Cost largely a function of population density in area of potentially affected ecology, whether waterfront properties are present and house prices may be affected, and whether river bankside recreation is affected. In this case little measureable effect on ecology so impact is carbon related. Carbon One-Off As per 2014 assessment (tco 2 e) Carbon Fixed N/A As per 2014 assessment (tco 2 e/year) Carbon Variable As per 2014 assessment (tco 2 e/ml) Min Cost Down (%) 30 Based on complexity of scheme Max Cost Uplift (%) 30 48


50 49
51 Name Code Description Outwood Lane R22 This scheme seeks an increase in daily licence from 3 Ml/d to 8 Ml/d and requires an equivalent increase in pump capacity. The hydraulic capacity of the source has been proved during previous test pumping. The increase in PDO associated with the scheme would be 5 Ml/d. Potential for an ADO scheme has been considered by comparing the Woodmansterne group daily average licence limit with abstraction returns for the group from The group licence offers an average headroom of 3.4 Mld if the borehole can be made to yield it. Dependencies None Value Assumptions Maximum Utilisation (ML/d) Peak Upper Limit of Max Utilisation 5 Maximum proven yield Peak Lower Limit of Max Utilisation Average Upper Limit of Max Utilisation 5 Proven yield 3.4 Headroom avialable on existing licence Average Lower Limit of 3.4 Headroom avialable on existing licence Max Utilisation Earliest Start Year 2020 Assumed at start of next cycle Construction period (years) 1 Assume 1 year for replacement or modification of pumps and licensing Capex ( ) Cost based on typical industry standard costs for pump replacement/enhancement only so at lower end of cost range. Fixed Opex ( /yr) 4580 As per 2014 assessment. Variable Opex (p/m3) 12.7 As per 2014 assessment. E&S One-Off ( ) 3000 Typical value for groundwater scheme used from E&S costing calculator at low end of range due to limited infrastructure requirements and no additional treatment. Cost largely a function of CAPEX related carbon costs. E&S Annual ( /year) 2,000 Typical value for groundwater scheme used from E&S costing calculator for distant from stream with minor effects. Cost largely a function of population density in area of potentially affected ecology, whether waterfront properties are present and house prices may be affected, and whether river bankside recreation is affected. In this case little measureable effect on ecology so impact is carbon related. Carbon One-Off 19.9 As per 2014 assessment. (tco 2 e) Carbon Fixed N/A As per 2014 assessment. (tco 2 e/year) Carbon Variable As per 2014 assessment. (tco 2 e/ml) Min Cost Down (%) 20 Based on complexity of scheme Max Cost Uplift (%) 20 50


52 51
53 Name Code Description Secombe Centre UV R26 This scheme provides UV treatment for the Secombe Centre groundwater source which is currently out of supply due to bacti detections on the raw water. Due to the limited footprint available at the Secombe Centre site, the UV treatment plant would be located at Cheam WTW on the 'East Main' which feeds water from Hackbridge, Goatbridge, Woodcote, Oaks, Langley Park, Sutton and Sutton Court Rd boreholes as well as Secombe Centre. Although the PDO of Secombe Centre is only 4.54 Ml/d, the daily licence for the East Main sources is 66 Ml/d and so the plant would need to have this capacity. This would provide pre-emptive protection against any further bacti or cryptosporidium detections at other sources on the main. The anticipated increase in ADO is 2.07 Ml/d (= 3.9 ADO of source that could be reassigned to Cheam and 0.3 to Sutton Court Rd) and in PDO is 4.54 Ml/d. Dependencies None Value Assumptions Maximum Utilisation (ML/d) Peak Upper Limit of Max Utilisation Peak Lower Limit of Max Utilisation Average Upper Limit of Max Utilisation Average Lower Limit of Max Utilisation 4.54 Maximum estimated benefit 4.54 Based on WTW design full benefit anticipated 2.07 Maximum estimated benefit 2.07 Based on WTW design full benefit anticipated Earliest Start Year 2020 Assumed start of next cycle Construction period 3 Assume 3 years for WTW design, permissions, construction (years) Capex ( ) 3,000,000 Cost based on typical industry standard costs for treatment works upgrades for MLd capacity ( 600k per Mld used). Fixed Opex ( /yr) 17,400 As per 2014 assessment Variable Opex (p/m3) As per 2014 assessment E&S One-Off ( ) 86,260 Typical value for treatment works used from E&S costing calculator per Mld. Cost largely a function of CAPEX related carbon costs. 19,000 per Mld. E&S Annual ( /year) 13,620 Typical value for treatment scheme used from E&S costing calculator for site that does not reduce priority habitats. Cost largely a function of carbon operational running costs. Typically 3000 per Mld. Carbon One-Off 575 As per 2014 assessment (tco 2 e) Carbon Fixed N/A As per 2014 assessment (tco 2 e/year) Carbon Variable As per 2014 assessment (tco 2 e/ml) Min Cost Down (%) 30 Based on complexity of scheme Max Cost Uplift (%) 30 52


54 53
55 Name Code Description Lowering pumps at Kenley and Purley R28 Increase Kenley PDO from 18 Ml/d by 6 Ml/d to 24 Ml/d by lowering pump and pump cutout in Borehole No. 1 by 2m. Increase Purley PDO from 6.9 Ml/d by 8.5 Ml/d to 15.4 Ml/d by lowering pump and pump cutout in Borehole Nos. 5, 6 & 7 by approximately 15m Potential for ADO scheme has been considered looking at average usage at the group licence boreholes, Kenley and Purley. However there is uncertainty in the data sources regarding headroom available. These licences aggregated and giving an average licence headroom of 4.77 MLd. However also an additional aggregation to Smitham which is in the Woodmansterne Group. Woodmansterne Group has an average headroom of 3.4 Mld. However uncertain whether this licence information is correct and whether additional Kenley & Purley abstraction can only be up to the licence limit of the lowest of Kenley & Purley and Woodmansterne or Kenley & Purley only. Conservative estimate used here. Dependencies None Value Assumptions Maximum Utilisation (ML/d) Peak Upper Limit of Max Utilisation Peak Lower Limit of Max Utilisation Average Upper Limit of Max Utilisation Maximum quantity available for licensing dependent on whether scheme also used at average and hence remaining water available at peak Lower possible bound of yield and borehole capacity Headroom available on existing licence Average Lower Limit of Headroom available on existing licence 3.4 Max Utilisation Earliest Start Year 2020 Assumed at start of next cycle Construction period Assume 1 year for replacement or modification of pumps and 1 (years) licensing Cost based on typical industry standard costs for pump replacement/enhancement only so at lower end of cost range. Capex ( ) 30, ,040,000= 2,070,000 Costs for UV treatment at Kenley treatment works due to increasing microbial detections and increasing yield at this source increases its criticality to supply. Therefore additional treatment to insure against outage. Costs based on typical industry costs at an average of 600k per Mld. Average yield benefit used. Fixed Opex ( /yr) Variable Opex (p/m3) E&S One-Off ( ) E&S Annual ( /year) 24, ,400 = 41, = ,500 = 278,500 As per 2014 assessment for borehole works, plus additional treatment works opex using Secombe Centre UV as approximate equivalent per Mld. As per 2014 assessment for borehole works, plus additional treatment works opex using Secombe Centre UV as approximate equivalent per Mld. Typical value for groundwater scheme used from E&S costing calculator at upper end of range; though limited infrastructure but additional treatment requirements. Treatment costs typically 19k per Mld. Cost largely a function of CAPEX related carbon costs. 2,000 Typical value for groundwater scheme used from E&S costing calculator for distant from stream with minor effects. Cost largely a function of population density in area of potentially affected ecology, whether waterfront properties are present and house prices may be affected, and whether river bankside recreation is affected. In this case little measureable effect on ecology so impact is carbon related. Carbon One-Off (tco 2 e) 92.8 As per 2014 assessment. Carbon Fixed (tco 2 e/year) N/A As per 2014 assessment. Carbon Variable (tco 2 e/ml) As per 2014 assessment. Min Cost Down (%) 20 Based on complexity of scheme Max Cost Uplift (%) 20 54


56 55
57 Appendix B Demand Side Costing 56
58 SES Water WRMP19 demand management options Assessment of Feasible Demand Management Options AR1181 January 2018
59 Report title: Report number: WRMP19 demand management options Assessment of Feasible Demand Management Options AR1181 Date: January 2018 Client: Author(s): SES Water Daniele Di Fiore Dene Marshallsay Rob Lawson The contents of this document are subject to copyright and all rights are reserved. No part of this document may be reproduced, stored in a retrieval system or transmitted, in any form or by any means electronic, mechanical, photocopying, recording or otherwise, without the prior written consent of the copyright owner. This document has been produced by Artesia Consulting Ltd. Any enquiries relating to this report should be referred to the authors at the following address: Artesia Consulting Ltd, Unit 2 Badminton Court, Yate, Station Road, Bristol, BS37 5HZ. Telephone: + 44 (0) Website:
60 SES Water Executive Summary This report complements the report regarding unconstrained option identification and screening that have been produced to investigate demand management strategies for SES Water resource zone. In particular, it details the approach and assumptions that Artesia have used to evaluate cost and benefits of feasible demand management strategies identified in previous stages. The report details: Classification of feasible options that have been assessed quantitatively; Description and rationale of why some option have been assessed qualitatively only; Detailed assumptions regarding savings and costs for water efficiency, metering and leakage options; Assumptions around the evaluation of carbon costs; Required information that needs to be outputted into the Economics of Balancing supply and Demand (EBSD) workbook that has been produced by decisionlab and will be used to screen options as indicated by the EBSD requirements. The aforementioned EBSD workbook is supplied together with this document. Artesia ref: AR1181 Artesia Consulting Ltd 2018
61 SES Water Contents 1 Introduction Structure of this report Feasible options list Options not assessed quantitatively Costs and savings of feasible water efficiency and metering options Water efficiency Metering projects Costs and savings of feasible leakage options Leakage options Carbon Cost Summary of results EBSD Workbook output Tables Table 1 Feasible option list... 4 Table 2 Cost of water efficiency options Table 3 Water efficiency option savings Table 4 Variable infrastructure charge uptake scenarios Table 5 Variable infrastructure charge cost (loss of revenue) and saving Table 6 Metering option Costs Table 7 Metering option Savings Table 8 Metering Option 555 Costs Table 9 PMA scheme types Table 10 Leakage Increasing ALC effort costs Table 11 Mains renewal scenarios Table 12 Mains renewal costs Table 13 Carbon weights and costs Table 14 Carbon assumptions travel and materials Table 15 Summary of AIC and savings for feasible options (over 25 years planning period) Artesia ref: AR1181 Artesia Consulting Ltd 2018
62 SES Water 1 Introduction This document details the analysis of demand side options that were selected as feasible options during the initial option screening process, including leakage, water efficiency, metering, tariffs, and reuse/recycling. This report describes the approach, including information sources and assumptions used, to estimate the costs and savings of SES Water demand-side options for use in water resources planning (WRMP19) and investment planning (PR19). This is part of a wider options identification and assessment process being undertaken for these plans. asked Artesia to provide options information into an EBSD (Economics of Balancing Supply and Demand) workbook developed by decisionlab. In details, the aim of the project was to: To develop fully justified (cost/benefit) demand management strategies for the feasible option identified; To evaluate carbon cost for options taken forward; To feed options information about cost and savings into an EBSD template workbook developed by decisionlab and used to screen options as indicated by the EBSD requirements. 1.1 Structure of this report This report contains the following sections: Section 2 summarises the feasible options and details those have costs and benefits identified, and justification for those not evaluated. Section 3 presents the costs and savings used in the analysis of water efficiency and metering options. Section 4 presents the costs and savings used in the analysis of water efficiency and metering options. Section 5 summarises the assumptions used in assessing carbon costs. Section 6 summarises the AIC (average incremental cost) and saving results for central scenario for each option assessed. Section 7 details the data required by the EBSD workbook. Artesia ref: AR1181 Artesia Consulting Ltd
63 SES Water 2 Feasible options list Table 1 presents the complete list of feasible options and indicates which options have had costs and benefits assessed (CBA) in this stage of the project. Two additional options (113a and 399) have been added at a later stage following SES Water request of an AMR-based compulsory metering option. One final additional smart metering option (555) has been produced in order to achieve 80% meter penetration by 2024/25 and 90% by 2029/30. Some of the options have not been assessed quantitatively these are discussed further in section 2.1. Table 1 Feasible option list # Option name Score CBA assessed? Leakage 073 Increasing ALC effort. Increase leakage find and fix budget by 'x' percent 17 Yes 302 Improved R&M efficiency 17 Yes 178 Raw water and WTW leakage reduction 19 No 301 Increasing ALC efficiency (detection and location) 20 Yes 303 Enhanced pressure management 21 Yes 399 Mains renewal 1 Yes Metering 311 Smart metering of selected households 16 Yes 113 Smart metering of all households 20 Yes 113a Compulsory metering (AMR) of all households 1 20 Yes 312 Smart metering of selected non households 20 No 555 Smart metering enhanced meter penetration 1 Rainwater/greywater harvesting Yes 124 Installation of rainwater harvesting in new build non-households Tariffs 21 No 038 Special tariff for sprinkler users 20 No 1 Options added at a later stage following SES Water request Artesia ref: AR1181 Artesia Consulting Ltd
64 SES Water 015 Increasing volumetric charges 21 No Water Efficiency Household water efficiency programme (Company led, self-install) Household water efficiency programme (Company led, plumber installed) Domestic retrofit programme targeting high consumers Household water efficiency programme (Partnering approach, home visit) Non-household water efficiency programme (Company led, self-install) 18 Yes 18 Yes 19 Yes 19 Yes 19 Yes 308 Targeting leaking WCs, taps and showers 19 Yes 157 Dual flush toilet retrofits (company funded) 20 Yes 307 Variable infrastructure charge 20 Yes 2.1 Options not assessed quantitatively Tariff options (038, 015) Costs and benefits of tariff options remain uncertain there have been several studies but the results have been mixed. Two of the most recent water-company led trials had slightly differing results. South West Water carried out a trial of a rising block tariff at 1,000 properties, on change of occupier, over the period. The company reported that this trial failed to produce significant behaviour change, and as a result it was unable to justify the major changes required to implement the scheme universally. Wessex Water carried out a more extensive trial, for which interim results were reported in This trial, of 6,000 properties assessed the effectiveness of four different charging structures, including seasonal and rising block tariffs. The results were promising in terms of the observed reductions in water use. The simple seasonal and rising block charging structures have shown additional demand reductions compared to standard metered charges of 6% on average. However, customer acceptance of tariffs was low and this was seen as an important barrier to overcome before tariffs could be widely applied. Wessex Water s study highlighted the benefits of smart metering, particularly in the context of tariffs, and this technology will enable a wide range of tariffs to be applied. However, this means that tariff options could only be implemented after smart metering has been delivered something that is at least 10 years away. Therefore the feasible tariff options have been assessed in broad terms only, based on these observations. Artesia ref: AR1181 Artesia Consulting Ltd
65 SES Water Increasing volumetric charges (015) Description This option would involve increasing the volumetric charge for water supply. Increasing the volumetric charge would encourage customers to use water more wisely, reducing demand. Discussion The technical requirements for this option are simple: an increased unit price of water could be applied with current metering technology, assuming that current approach to charging based on metered consumption is maintained. This could be a one-off increase, or an annual increase up to a pre-determined level Approval from Ofwat would be a necessity as this option is likely to affect the tariff basket and could also influence future price determinations. Consultation with CCWater would be strongly recommended. It would be necessary to set out and communicate a price increase policy to customers. It is known that the relationship between water use and price is relatively inelastic i.e. a large increase in the volumetric charge for metered customers would be required to effect a reduction in demand. It may be necessary to reduce unmeasured household charges in order to maintain the tariff basket. This would be counterproductive as it would create a disincentive to opt for a metered bill for a large number of customers. Therefore, whilst this is a technically simple option, the regulatory challenges and uncertainties are significant and the ultimate benefit, in terms of overall customer water efficiency, are also questionable. Consequently this option is not assessed further. Special tariff for sprinkler users (038) Description This option would involve the introduction of time based volumetric charge that incentives off peak usage or sprinkler users. Discussion The option would involve an optional special tariff with time-based volumetric charge that would incentivise off peak usage for sprinkler users. This means several different rates, depending on the time of day the sprinkler is used. The tariff would likely benefit high user, which could shift sprinkler use to other times of the day to save money. The main technical requirement of the option is that a smart meter would be necessary to be able to record peak/off-peak usage. Current meter technology and meter-read frequency do not offer the capability at the required resolution. Therefore, a smart meter installation programme would be necessary. Additional analysis would also be needed to assess the optimal peak/off-peak selection. Due to the technical requirements and the uncertainties around the smart meter programme implementation, this option is not assessed further Installation of rainwater harvesting in new build nonhouseholds (124) Storm water runoff from commercial buildings has potential for water capture and reuse 2. Historically roof run off was rapidly removed from site, now this is recognised as a resource and technologies are emerging to resolve this use. 2 Lucke, T., Beecham, S., Zillante, G. (2007) Rainwater harvesting options for commercial buildings using siphonic roof drainage systems. International transitions conference, Australian Industry of Building Surveyors, Adelaide, Artesia ref: AR1181 Artesia Consulting Ltd
66 SES Water Nevertheless, this option is problematic because of the new retail market for nonhouseholds, which makes it difficult for wholesale water companies to provide advice to non-household customers. Also, it is difficult to estimate the savings that would result from this option, even assuming it is practicable. For example, it would be very difficult to estimate how many developers take up the offer and also what is the number and type of non-households which would be built. Installation of rainwater harvesting in new build non-households (104) Description This option would involve a reduced infrastructure charge for developers that install rainwater/greywater harvesting system in newly built non-households. Discussion The Infrastructure Charge is payable where new or existing premises are connected for the first time to the public water supply or to a public sewer, either directly or indirectly. The charge is set out by the water company with amounts that can vary based on the characteristics of the property. The option would involve the company offering a reduced infrastructure charge for developers that agree to install rainwater/greywater harvesting system in newly built non-households. The company could offer different levels of discounts to developers based on the water-saving capabilities of the system put in place. Storm water runoff from commercial buildings has potential for water capture and reuse 2 ; however there is no sufficient evidence on how the systems work in different type of non-households properties. Additionally, there is not enough data on how many and what type of non-household developments are planned in the company area. It is also difficult to estimate the number of developers which would pick up the offer and what type of system they would build. Due to the aforementioned uncertainties, this option is not assessed further Smart metering of selected non households (312) The same rationale used for option 124 applies to the smart metering of selected non households. In this case the main issue is the consideration of uncertainties around retail separation in the non-household market. Smart metering of selected non households (312) Description This option would involve the installation of a smart meter for selected non-households. Discussion The option would involve identifying non-households with largest water consumption. A smart meter would be installed in the selected non-households. This would help the customers understand their water consumption and would incentivise them to reduce it. Customer would be also offered advice on how to diminish their water demand and improve efficiency. The main technical problem around this option is that there is no sufficient information around retail separation ad likely effect of smart meter on non-household. Therefore, this option is not assessed further. Artesia ref: AR1181 Artesia Consulting Ltd
67 SES Water Raw water and Water treatment work (WTW) leakage reduction (178) This option would involve reducing leakage on raw water mains and through the wastewater treatment work (WTW) to reduce abstraction. The option would increase the deployable output rather than reduce demand; therefore, it is outside the scope of the demand side assessment. Due to the aforementioned reasons, the option has not been assessed. Smart metering of selected non households (312) Description This option would involve reducing leakage on raw mains and through the WTW to reduce abstraction. Discussion Leakage at raw mains and through WTW reduce the water available to customers. The option would need to identify the best cost-effective approach between sensitivity and location accuracy, cost and ease of use on the other. It is likely that the option could potentially save a lot of water. However, not enough information are available on the asset and leakage levels at these locations. Additionally, the option would increase the deployable output rather than reduce demand. Therefore, this option is not assessed further. 3 Costs and savings of feasible water efficiency and metering options 3.1 Water efficiency Below are the considerations that were applied to the analysis of each of the water efficiency options: The number of households targeted per year is based on a percent of total households; this can be overwritten or varied. The length of the programme (in years) is how long the delivery of the option lasts for and can be changed by the modeller. Longevity of savings defined as savings that persist for five years after installation, and based on the assumption that products such as tap inserts, low-flow showerheads and cistern displacement devices will remain installed for a relatively short time. An average value of five years has been used to represent this period of time, taking account of the likely period that these products are installed. More durable devices (such as ecobeta dual flush retrofits) and fixes of leaking toilets will last for a longer period. Uptake rate represents the percentage of the properties contacted that choose to take part in the programme. Artesia ref: AR1181 Artesia Consulting Ltd
68 SES Water Suitability is the percentage of those properties that are suitable and end up receiving part or all of the retrofit. (This may also be affected by other factors such as appointments being met, etc.). Unit costs are based on SES Water actual cost where possible. The marketing cost varies according to the number of properties involved in the option Modelling the water savings For most of the options, it is assumed that the water savings delivered in each year will persist at that level for a period of 5 years and then revert to zero. Where an option delivers over several years (e.g. over 5 years) then the year 1 savings endure until year 5, year 2 savings until year 6, etc. This provide a rectangular profile for water efficiency delivery (in the text below this is referred to as the original method). An alternative approach that may have been used is to assume that the savings delivered in year 1 then decay using a half-life decay curve, with the half-life set to half of the asset life of the water efficiency fitting. Artesia decided to use the rectangular profile for each years water efficiency delivery, rather than the half-life profile. This choice was made because it makes the modelling of the water savings in each option simpler and more flexible in the EBSD workbook. The approach was agreed with SES Water. A more detailed explanation is presented in the Appendix Water Efficiency costs and savings Table 2 presents the main cost estimates and assumptions used for the central value estimate. Cost of devices have been agreed with SES Water based on their current costs. Upper and lower cost variations can be defined because in general these values are less well defined than for water saving estimates. At present, the default values for upper and lower costs estimates are set at ±20% of the central value. Table 3 presents the devices installed and/or fixes associated with each efficiency option and associated savings. Savings have been agreed with SES Water and are based on a combination of evidence, from assumptions currently used in the Water saving calculator offered by SES Water and from the WEFF evidence base H2eco 3. Lower estimate is 50% of central estimate; upper is 150% of central estimate. 3 Ashton V, Lawson R, Marshallsay D and Ponsonby K (2015) Water efficiency evidence base statistical analysis - Report Number AR Client: Water efficiency collaborative fund via Dŵr Cymru. Artesia Consulting ltd Artesia ref: AR1181 Artesia Consulting Ltd
69 SES Water Table 2 Cost of water efficiency options Ref Cost item Unit cost Units 157 Dual flush toilet plumber cost and travel - private per property 157 Dual flush ecobeta toilet device per item 157 Dual flush communication, management and evaluation 8.00 per property 157 Dual Flush marketing campaign per Company led communication, management and evaluation 8.00 per property 019 Company led materials 8.61 per visit 019 Company led marketing campaign per loss of revenue - lower scenario per property 307 loss of revenue - central scenario per property 307 loss of revenue - upper scenario per property 307 Internal company cost per Company led Plumber per visit per visit 020 Company led materials per visit 020 Company led communication, management and evaluation 8.00 per property 020 Company led marketing campaign per Company led marketing campaign per billing data analysis to ID high users - possible leakage 2.00 per property 308 Company led Plumber per visit per visit 308 Company led materials per visit 308 Company led communication, management and evaluation 8.00 per property 305 Company led Plumber per visit per visit 305 Company led materials per property 305 Company led communication, management and evaluation 8.00 per property 305 Company led marketing campaign per billing data analysis to ID high users 2.00 per property 022 Non HH self-install products ( 3 x CDD, 3 x taps) & postage 022 Non HH self-install communication, management and evaluation per property 8.00 per property 022 Non HH self-install Marketing campaign per Company led Plumber per visit per visit Artesia ref: AR1181 Artesia Consulting Ltd
70 SES Water 021 Company led materials per visit 021 Company led communication, management and evaluation 8.00 per connection 021 Marketing per Table 3 Water efficiency option savings Option Measure Lower Central Upper unit 019 CDD+showerhead+tap inserts+shower timer l/prop/d 020 ecobeta+tap inserts+showerhead+hosepiper trigger gun 305 ecobeta+tap inserts+showerhead+hosepiper trigger gun 021 ecobeta+tap inserts+showerhead+hosepiper trigger gun l/prop/d l/prop/d l/prop/d 022 tap inserts (x3) + CDD (x3) l/prop/d 157 Dual flush ecobeta toilet device l/prop/d 307 combination of different approaches (refer to option 307 section) l/prop/d 308 fix leaking toilet l/prop/d 200 Washing Machine l/prop/d When assessing cost benefits of water efficiency options, the marginal cost of water has been considered to determine the value of water saved because less pumping is required. The marginal costs represents, effectively, the change in costs as a result of a specified change in demand thus entailing a reduction in operational costs. The value of marginal cost of water for SES Water is 202/Ml Household Water efficiency (WEFF) programmes (019,020, 021) The household water efficiency (WEFF) programmes include option 019 (Household WEFF programme company led self-install), 020 Household WEFF programme company led plumber Install) and 021 (Household WEFF programme partnering approach home visit). Option 019 involves the distribution of water efficiency information and devices as a kit. The kit includes: an aerated shower head, a save a flush cistern displacement device, aerated tap inserts, universal plug and a shower timer. The water efficiency devices would be installed by the customer and the devices chosen are easy to install. Option 020 would involve a home visit by plumber to install water efficient devices. The visit will also provide information on behavioural change and impact on water use. The home visit would be delivered by the water company; most likely via an external contractor. Efficiency devices are installed by a qualified plumber and householders are encouraged to change water-use behaviour by provision of water efficiency information. Artesia ref: AR1181 Artesia Consulting Ltd
71 SES Water Option 021 would involve a home visit by plumber to install water efficient devices. The visit will also provide information on behavioural change and impact on water use. The home visit would be delivered via and external contractor, and using a partnering approach with organisations such as Housing Associations or Local Authorities. Therefore, lower costs are assumed. Efficiency devices are installed by a qualified plumber and householders encouraged to change water-use behaviour by provision of water efficiency information. For all WEFF programmes, the number of households targeted per year is currently based on 10% of total households, but can be varied by the modeller. Savings are assumed to last for 5 years Domestic retrofit targeting high consumers (305) Domestic retrofit programme which targets metered customers with high consumption as identified by billing information. Customers would be offered a range of devices to help to reduce consumption. This would be a visit and fix/install programme. This option would involve a home visit by plumber to install water efficient devices. The visit will also provide information on behavioural change and impact on water use. The home visit would be delivered by the water company, most likely via an external contractor. Efficiency devices are installed by a qualified plumber and householders encouraged to change water-use behaviour by provision of water efficiency information. Uptake rates are assumed to be high as this will directly help the customer save water and therefore save money so in the customers best interest to participate. Will require additional analytics to identify the high consumers from billing data. The number of households targeted per year is currently based on 5% of total households, but can be varied by the modeller. Savings are assumed to last for 5 years Non Household WEFF company led self-install (022) This self-install programme initially proposes the provision of cistern displacement advice or dual flush retrofit devices and tap inserts and provision of saving your business water use information. There are a total of 13,574 non-household properties (excluding unknowns). We have selected a total of 1,534 for this option. This is for a variety of reasons, including; those with greatest consumption associated with them, and those considered to be 'big wins' in terms of the water saving on consumption component. These organisations include; schools, offices, healthcare and hotels. These four sectors will have high toilet, shower and tap use which can yield the greatest water saving. Based on Thames Water "Smarter Business Visits" they have seen significant water savings 4. In some cases water savings have been 3,600l/d by using sensor urinals, sensor taps and propel air ultra-low flush toilets. Saving are assumed to last for 5 years. 4 Tucker A (2017) Water Efficiency with our Smart Meter Rollout - WWT Conference (March 2017). Available at: Tucker.pdf Artesia ref: AR1181 Artesia Consulting Ltd
72 SES Water Campaign targeting domestic customers with high consumption - leaking toilets (308) The domestic retrofit programme targets metered customers with high consumption. They are identified by billing information and this is regarded as an effort to tackle internal leakage - in particular leaking toilets. Customers would be offered a visit by a plumber to ascertain if the property has a leaking toilet and then fix it. The visit will also provide information on behavioural change and impact on water use. The assumed water saving is based on evidence from Thames metering programme 4. The option targets metered customers and would require some analytic cost for the identification of high users. Not enough information is available on toilet fix programmes at the current time, therefore a series of assumption on continuation of saving and uptake rate have been made. The programme target the top 5% of users. Uptake rate (high consumers that actually have a leak) are assumed at 5% of the targeted properties for central scenario (lower = 1%, upper 10%); this can be varied by the modeller if/when more detailed data are available. Savings are assumed to last for 15 years Dual flush toilets retrofit (157) This option is a Water Company funded dual flush retrofit scheme. The programme will start with a company-wide marketing campaign to engage with consumers. Those who apply to take part in the scheme will receive a visit from a plumber to their property and a dual flush mechanism will be retrofitted to the toilet. The number of households targeted per year is currently based on 20% percent of total households, but can be varied by the modeller. Savings are assumed to persist for 15 years Variable infrastructure charge (307) The scenarios have been supplied by SES Water based on a hypothetical 1800 property development. The Government updated Part G of the Building Regulations in 2010, setting a whole building standard of 125 litres per person per day for domestic properties. Based on the efficiency level company could offer the following discounts to Infrastructure Charges might then apply: 15% reduction if smart meters are fitted, allowing the customer to track their water usage at least daily. A saving of 5 litres per person per day is assumed, i.e. 120 litres/person/day. 30% reduction if all bathroom fittings are A -rated based on the Water Label or either rainwater harvesting or greywater recycling is fitted. This equates to a water usage of around 105 litres/person/day. 50% reduction if all bathroom fittings are A -rated based on the Water Label AND either rainwater harvesting or greywater recycling is fitted. This equates to a water usage of around 80 litres/person/day. Artesia ref: AR1181 Artesia Consulting Ltd
73 SES Water Three Scenarios have been developed based on different uptake percentages by the developers, as presented in Table 4. Table 4 Variable infrastructure charge uptake scenarios Water Efficiency options Lower Central Upper Scenario 1 Scenario 2 Scenario 3 (low WE) (medium WE) (high WE) Standard 75% 50% 35% Option 1 (smart meters) 10% 20% 25% Option 2 (A rated or RWH/GWR) 10% 20% 25% Option 3 (A rated and RWH/GWR) 5% 10% 15% Reduction in income 45,057 90, ,690 Water Savings (m3/year) 7,801 15,603 21,352 Assuming a standard charge per property of 357.6, the average cost (loss of revenue) and saving per property presented in Table 5 would be achieved. Table 5 Variable infrastructure charge cost (loss of revenue) and saving Cost and Savings Lower Central Upper Scenario 1 Scenario 2 Scenario 3 (low WE) (medium WE) (high WE) Average cost (loss of revenue) per property Average saving - l/prop/day Savings are assumed to persist for fifteen years after installation due to the combination of devices installed. 3.2 Metering projects Below are the assumptions used when assessing the metering options (311, 133, 113a, 555): Meter costs are based on company-specific variables where possible, including meter cost, survey and installation cost, cost of meter reads, and supply pipe repair costs. The number of properties is obtained from the household demand forecast for the SES water resource zone. The maximum meter penetration is assumed to be 90% of total properties at the end of the forecast period (2080). Whilst compulsory meter for unmeasured households is proposed to be achieved in 10 years. Artesia ref: AR1181 Artesia Consulting Ltd
74 SES Water The saving values for compulsory metering are based on results of metering projects presented in the update to the water efficiency evidence base 3. Dumb and AMR savings are based on the findings from Southern Water 5 and South East Water 3. The additional effect of smart metering is based on results from the Anglian Water inhouse display project (in the WEFF evidence base report) 3. For compulsory metering using dumb/amr meters, we have used evidence from Southern Water (Southampton University study) 5. The study indicates overall saving, including anticipation effect, of 16.5% for AMR and we have initially used this value as the mean water saving. However, the additional saving obtained through AMR are based on more frequent readings and therefore more regular feedback to the customer. Because SES Water AMR meters are likely to be used as dumb, with no additional readings, the mean estimate is set a 14.5%. This has been agreed with SES Water. The lower estimate of water savings taken from the same study suggests a 13.5% overall reduction in demand and reduced to 11.6% for the same reason. The upper saving of 18.5% reduction in demand is taken from the results of South East Water s metering programme (taken from table 48 of WEFF evidence base report) 3 and reduced to 17.4%. For the additional effect of smart metering, 5.7 l/prop/d saving was used which is from the Anglian Water in-home display project This equates to a central value of 1.5% on average unmeasured household consumption. Lower and upper estimates are assumed at 1% and 2% respectively. Compulsory metering with smart meters is estimated to deliver 18% savings, based on the additional benefit of in-home displays (as per previous analysis). This is considered a conservative estimate, as further savings are likely from data that will be collected, e.g. on leakage, comparative consumption rates and trends in consumption over time. However this has not been included at present as there are no data to support this. Selective compulsory metering has been based on the assumption that highest users would reduce their consumption by the same percentages used for the other compulsory metering projects. However, this is unlikely to be the case, since there is insufficient evidence to investigate the potential savings based on household type. It is assumed to target the top 5% water users As for water efficiency options, the marginal cost of water has been considered to determine the value of water saved. Table 6 presents meter option cost estimates, and Table 7 illustrates the potential savings. 5 Ornaghi C and Tonin M (2015). The effect of metering on water consumption Artesia ref: AR1181 Artesia Consulting Ltd
75 SES Water Table 6 Metering option Costs high AMI 113a - AMR Meter Cost Meter Installation External Meter Installation Internal Meter replacement strategy Meter Survey SPL repairs Meter reads (single read) Networks Annual Charge 1/property 1/property Network Mast(s) installation 150, ,000 Communications Interface 137,895 6,628,066 10,625 Analytics Annual Charge 100,000 50,000 Table 7 Metering option Savings Meter type Lower Central Upper DUMB 11.60% 14.50% 17.40% AMR 11.60% 14.50% 17.40% AMI 14.4% 18.0% 21.6% M to Smart 1.00% 1.50% 2.00% Smart metering enhanced meter penetration (555) This option has been added in at a later stage to assess cost and savings for a metering scenario of 80% meter penetration by 2024/25 and 90% by 2029/30. For this option, only meter install and maintenance costs for the additional meters will be included. The meter read and back office infrastructure costs just for additional meters are included in the costs. Meter replacement rate assumed to be 15 years. The estimated costs for the option are summarised in Table 8. Savings are assessed for the additional smart meter installed only and are estimated at 18% (refer to the previous section for details). Artesia ref: AR1181 Artesia Consulting Ltd
76 SES Water Table 8 Metering Option 555 Costs AMI Meter Cost 38 Meter Installation External 123 Meter Installation Internal 58 Meter replacement strategy 39 Meter Survey 29 SPL repairs 300 Meter reads (single read) 0 Networks Annual Charge 1/property Network Mast(s) installation 150,000 Communications Interface 676,265 Analytics Annual Charge 35,000 4 Costs and savings of feasible leakage options 4.1 Leakage options Enhanced Pressure management (303) The scope for new, additional or improved pressure management is assessed by inspection of control point (CP) pressures. CP pressures are compared with an agreed pressure threshold that will ensure that standards of service to customers would not be prejudiced; this is normally taken to be a surrogate pressure of 20 to 25 meters and provides a buffer to allow for uncertainty and friction losses between the CP point and customer stop taps. The differences between the current CP pressures and the threshold will define the potential additional head drop that could be implemented and hence the potential reductions in average zone night pressures (AZNP).The current and potential AZNP values will be used within the Fixed and Variable Area Discharges FAVAD equation that relates pre and post AZNP values to leakage levels: Where: L 1 x HDF 1 = L 0 x HDF 0 / (AZNP 0 /AZNP 1 ) N1 Equation 1 L 0, L 1 = net night flows before and after pressure management (m 3 /hr). HDF 0, HDF 1 = hour day factors before and after pressure management The exponent N1 is a function of the PMA asset condition. A value of has been used (which is the average of a number of UK studies). Artesia ref: AR1181 Artesia Consulting Ltd
77 SES Water HDF 1 values will be dependent on the proposed scheme type. The rationale in Table 9 has been used to define scheme types: Table 9 PMA scheme types Existing scheme type Gravity Fixed outlet Flow modulation / Time profile / Closed loop New scheme type Fixed outlet Retro-fit flow modulation Optimisation HDF 1 values will use the average of a sample of current HDF values of the same scheme type. The current PMA net night flow values, L 0 have been used within equation 1 to determine L 1. The difference between L 0 and L 1, define the scheme leakage savings Increasing ALC effort. Increase leakage find and fix budget by 'x' percent (073) This option assumes no change in the current ALC process other than a range of increases in manpower resource levels (beyond those required to deliver the short-run SELL) in order to achieve as far as possible the steps in leakage. At some point these may be constrained by policy minimum / background leakage levels. Transition and annual maintenance costs are estimated separately. The total costs and leakage savings profiles associated with each option have been quantified. Main costs are detailed in Table 10. Table 10 Leakage Increasing ALC effort costs Job Unit cost ( /job) Unit cost ( /hour) Monitoring 344,110 Leakage detection - fixed costs 26,732 Leakage detection - variable costs 425,860 Mains repair 3,123 Communication Pipes 715 Ferrule 1,938 Meter 34 Stop cock 900 Supply pipes 730 Fire hydrant Improve efficiency options Increasing ALC efficiency (detection and location) (301); Improved R&M efficiency (302) Both these options assumes change in the current ALC process to increase efficiency in detection and location (option 301) and replacement and maintenance activities (option 302). Artesia ref: AR1181 Artesia Consulting Ltd
78 SES Water For option 301 scenarios are: Reduce detection and sweep time by 10% Reduce detection and sweep time by 15% Reduce detection and sweep time by 20% For option 302 scenarios are: Reduce repair and maintenance time by 10% Reduce repair and maintenance time by 15% Reduce repair and maintenance time by 20% Transition and annual maintenance costs are estimated separately. Costs are based on Table 10 and recalculated according to efficiency level and leakage savings Mains renewal (399) These options assumes different rates of mains renewals based on 4 scenarios supplied by SES Water. The scenarios are detailed in the Table 11 and Table 12. Table 11 Mains renewal scenarios Option Code Baseline 399a 399b 399c 399d Scenario Description Base Scenario - Leakage at 24.0 Ml/d (stable serviceability) Scenario 1 - Flat Costs (leakage at 23.6 Ml/d in AMP7) Scenario 2 - leakage at 22.8 Ml/d (5% reduction) Scenario 3 - leakage at 21.6 Ml/d (10% reduction) Scenario 4 - leakage at 20.4 Ml/d (15% reduction) Table 12 Mains renewal costs Scenario AMP7 Cost ( ) AMP 7 Length (km) AMP8 Cost AMP 8 Length (km) AMP9 Cost AMP 9 Length (km) baseline 28,866, ,331, ,222, a 36,636, ,224, ,096, b 43,136, ,227, ,384, c 62,875, ,602, ,703, d 86,598, ,913, ,897, Annual maintenance costs and savings are estimated based on the above assumptions. It is assumed that maximum savings are achieved at the end of AMP7 (5 year lead-in) and retained for the rest of planning period. Maintenance and replacement costs are kept flat after AMP9. Artesia ref: AR1181 Artesia Consulting Ltd
79 SES Water 5 Carbon Cost Carbon cost for water efficiency and metering cost has been calculated based on the assumptions presented in Table 13 and Table 14. Assumptions Unit cost Table 13 Carbon weights and costs Carbon emitted by production of 1Ml of cold water (gco2/l) 8.1 Carbon emitted by production of 1Ml of hot water (tco2/l) Source Veolia PR09 Ofwat % % of water consumed that is heated Ofwat Cost of traded carbon DECC Cost of non-traded carbon DECC 2011 Table 14 Carbon assumptions travel and materials Item Value Units Travel tco2e/ml/km Composite* meter or water saving device tco2e/property * Composite meter 95% plastic 5% metal 500g Carbon costs are calculated following a yearly profile and then summarised in the EBSD workbook as: CAPEX carbon costs - carbon cost for capital expenditure up to the 12 th year. This include device installed plus mileage needed for the installation OPEX carbon costs - Yearly operational carbon costs that the option requires for each year the project is run. This includes benefits due to less water pumped plus cost associated with operational activities if present. Artesia ref: AR1181 Artesia Consulting Ltd
80 SES Water 6 Summary of results The following table presents the central estimate AIC values, the average annual and discounted average annual savings for all feasible options assessed. The figures are calculated considering the 25-years period required by the EBSD model. Table 15 Summary of AIC and savings for feasible options (over 25 years planning period) Option Full Code Option Description AIC p/m3 Average saving (Ml/d) Discounted Average saving (Ml/d) Water efficiency WEFF 019 WEFF Household WEFF programme company led self-install WEFF 020 WEFF Household WEFF programme company led plumber install WEFF 305 WEFF Domestic retrofit targeting high consumers WEFF 021 WEFF Household WEFF programme partnering approach home visit WEFF 022 WEFF Non HH WEFF company led self-install WEFF 308 WEFF Campaign targeting domestic customers with high consumption - leaking toilets WEFF 157 WEFF Dual flush toilets retrofit WEFF 307 WEFF Variable infrastructure charge Metering MET 311 MET Smart metering of selected households MET 113 MET Compulsory Smart Metering of all households MET 113a MET 113a - Compulsory Metering of all households MET 555 MET 555 Smart metering enhanced meter penetration Leakage LEAK 073_a LEAK 073_a - Increased ALC effort_a LEAK 073_b LEAK 073_b - Increased ALC effort_b Artesia ref: AR1181 Artesia Consulting Ltd
81 SES Water LEAK 073_c LEAK 073_c - Increased ALC effort_c LEAK 073_d LEAK 073_d - Increased ALC effort_d LEAK 073_e LEAK 073_e - Increased ALC effort_e LEAK 073_f LEAK 073_f - Increased ALC effort_f LEAK 073_g LEAK 073_g - Increased ALC effort_g LEAK 073_h LEAK 073_h - Increased ALC effort_h LEAK 073_i LEAK 073_i - Increased ALC effort_i LEAK 073_j LEAK 073_j - Increased ALC effort_j LEAK 073_k LEAK 073_k - Increased ALC effort_k LEAK 301_a LEAK 301_a - Improve ALC efficiency_a LEAK 301_b LEAK 301_b - Improve ALC efficiency_b LEAK 301_c LEAK 301_c - Improve ALC efficiency_c LEAK 302_a LEAK 302_a - Improve RM efficiency_a LEAK 302_b LEAK 302_b - Improve RM efficiency_b LEAK 302_c LEAK 302_c - Improve RM efficiency_c LEAK_303 LEAK Enhanced pressure management LEAK_399_a LEAK_399_a - Mains renewal_a LEAK_399_b LEAK_399_b - Mains renewal_b LEAK_399_c LEAK_399_c - Mains renewal_c LEAK_399_d LEAK_399_d - Mains renewal_d Artesia ref: AR1181 Artesia Consulting Ltd
82 SES Water 7 EBSD Workbook output Information and results about each options have been outputted into an ESBD workbook developed by decisionlab. The file is supplied together with this report. Artesia were required to provide info about: General option information (such as name, description and code). Carbon costs. FOPEX profile up to 25 th year total cost expenditure for each option up to year 25. Yield in Ml/d up to the 25 th year - water saving in Ml/d achieved by each option up to year 25. Artesia ref: AR1181 Artesia Consulting Ltd
83 SES Water Appendix Feasible options: water efficiency - modelling the water savings Introduction In the WRMP19 feasible options sheets for the water efficiency options, we have assumed that the water savings delivered in each year persist at that level for a period of 5 years and then go to zero. Where an option delivers over several years (e.g. 5 years) then the year 1 savings last until year 5, the year 2 savings until year 6, etc. An alternative approach, which we have used previously, is to assume that the savings delivered in year 1 then decay using a half-life decay curve, with the half-life set to half of the asset life of the water efficiency fitting. For WRMP19 we decided to use the rectangular profile for each years water efficiency delivery, rather than the half-life profile (in the text below this is referred to as the original method). This choice was made because it makes the modelling of the water savings in each option simpler and more flexible in the feasible options sheet. The purpose of this technical note is to quantify the impact of this choice, and to justify that the choice is robust. Data and method Data was used from Option WEFF 020; Household WEFF programme, company led plumber install. This option carries out plumber installation of water efficiency devices each year for 5 years. Each year the programme delivers Ml per year, persisting for another 4 years. For the half-life calculation we have assumed that the average asset life of the water efficiency devices is 7 years (a value that we have applied for similar options in WRMP14). Results The original (5 year savings in blue) and the half-life water savings (in red) per year for the option are shown in the figure below: Artesia ref: AR1181 Artesia Consulting Ltd
84 SES Water Water Saving per year Ml/year Central - Original Central - Half life decay The original profile delivers more water earlier, than the half-life profile; but then stops delivering water earlier than the half-life profile (which continues to deliver an everdecreasing amount of water). In the feasible options analysis, both the costs and the yield need to be discounted using net present value 6. Therefore, in summarising the water savings delivered by both the original and half-life methods, we have discounted the volumes using a discount rate of 4.5%. The total savings and the discounted savings over the 25 year planning period are summarised in the table below. Central Original 5 year saving Central Half-life decay saving % difference Total volume (Ml) % Total discounted volume (Ml) % Conclusion The reason for the use of the 5-year water saving profile was essentially made on pragmatic grounds, as it makes the water saving modelling simpler and more flexible to implement in the feasible options worksheets. The total volume savings for this method are about 10% lower than the half-life method. However, when using the discounted volume savings there is only about 1% difference in the two methods. As discounted savings should be used in the feasible options analysis, then we believe the use of the 5-year water saving profile is justified. 6 The underlying premise is that the unit of water has an economic value. It is this value that is discounted. However, because estimating the actual value of water is a difficult activity it is not usually undertaken and the value is left as a volumetric form. UKWIR: A framework for valuing the options for managing water demand, Ref: 07/WR/25/3 Artesia ref: AR1181 Artesia Consulting Ltd
85 Appendix C EBSD model output 58
86 Report on EBSD model runs Run 013 Least Cost 014 Least Cost Environmental Environmental 017 Increased Level of Service 018 Increased Level of Service 019 Stakeholder Choices 020 Stakeholder Choices 021 Stakeholder Choices with 311 instead of Stakeholder Choices with 311 instead of Stakeholder Undiscounted Cost First year of option utilisation Options disallowed Costs/Yields Drought - 173, None Most Likely WDHR - 2,147, None Most Likely 1:200 3,052, R8, R22, R28 Most Likely WDHR 2,260, R8, R22, Most Likely 1:200 R28 12,800, None Most Likely WDHR 9,632, None Most Likely 1: ,299, mandatory 171,299, mandatory 33,760, mandatory 32,980, mandatory 246,941, mandatory R5, R8, N4, R6, R21, R22, R26, R2, R10 R5, R8, N4, R6, R21, R22, R26, R2, R10 R5, R8, N4, R6, R21, R22, R26, R2, R10 R5, R8, N4, R6, R21, R22, R26, R2, R10 R5, R8, N4, R6, Most Likely WDHR Most Likely 1:200 Most Likely WDHR Most Likely 1:200 Most Likely WDHR
87 Choices with Mains Replacement 024 Choices with Mains Replacement 025 Relaxed Stakeholder Choices 026 Relaxed Stakeholder Choices Least Cost (stakeholder) Least Cost (stakeholder) 029 Environmental Run (stakeholder) Environmental Run (stakeholder) 031 Increased Level of Service (stakeholder) 032 Increased Level of Service 62,568, mandatory 63,128, mandatory 57,963, mandatory R21, R22, R26, R2, R10 R5, R8, N4, R6, R21, R22, R26, R2, R10 R8, R21, R22, R26, R2, R10 R8, R21, R22, R26, R2, R10 2,297, R10, R12, R12R, R13, R13R, R15, N8-809, R10, R12, R12R, R13, R13R, R15, N8 8,005, R10, R12, R12R, R13, R13R, R15, N8, R8, R22, R28 3,729, R10, R12, R12R, R13, R13R, R15, N8, R8, R22, R28 25,854, R10, R12, R12R, R13, R13R, R15, N8 22,100, R10, R12, R12R, R13, R13R, Most Likely 1:200 Most Likely WDHR Most Likely 1:200 Most Likely WDHR Most Likely 1:200 Most Likely WDHR Most Likely 1:200 Most Likely WDHR Most Likely 1:200
88 (stakeholder) R15, N8 Costs for runs 13, 14 and to an extent 15 and 16 have very low costs. This is due to reductions in demand profiles from previous runs, and the selection of demand management options which have negative fixed operating costs in their lifespan. This is highlighted by the selection of option Leakage 303 Pressure Management, which has large negative costs from year 2 of its lifespan, and is selected in 2021 in all runs. As the demand profile rises, (runs 17 and 18), or more expensive options are forced (runs 19 and 20), costs can be seen to rise, as they do with runs 21 and 22 (by a smaller amount due to using the smart metering of selected households option). Mutual Exclusivities: One increased ALC Effort option: SESW-LEA-078a to SESW-LEA-078k One increased ALC Efficiency Option: SESW-LEA-301a to SESW-LEA-301c One increased Repair efficiency option: SESW-LEA-302a to SESW-LEA-302c One Metering option from: SESW-MET-311: Smart metering of selected households SESW-MET-113: Smart Metering of all households SESW-MET-113a: AMR Metering One Water Efficiency option from: SESW-WEF-019: Household WEFF programme company led self Install SESW-WEF-020: Household WEFF programme company led plumber install SESW-WEF-021: Household WEFF programme partnering approach home visit SESW-WEF-157: Dual flush toilets retrofit One Main Renewal option from: SESW-LEA-399a: Mains renewal_a SESW-LEA-399b: Mains renewal_b SESW-LEA-399c: Mains renewal_c SESW-LEA-399d: Mains renewal_d
89 Phased Deliveries: 1. SESW-ASR-R21: North Downs Confined Chalk AR extension 2 (new borehole on SE side of Football Club) is dependent on: SESW-ASR-R2: North Downs Confined Chalk AR extension 1 (Bishopsford Road) 2. SESW-RTR-R12R: 20Ml/d transfer from Langley Park/North Looe Reservoirs to Outwood PS-reverse is dependent on: SESW-RTR-R12: 20Ml/d transfer from Langley Park/North Looe Reservoirs to Outwood PS 3. SESW-RTR-R13R: 12Ml/d transfer from Langley Park/North Looe Reservoirs to Buckland-reserve is dependent on: SESW-RTR-R13: 12Ml/d transfer from Langley Park/North Looe Reservoirs to Buckland Comments: The DO values in runs 13, 15, 17 and 19 are in line with the drought effect from Worst Drought on Historic Record. 14, 16, 18 and 20 are in line with the 1:200 drought scenario The DO is reduced by 2.5Ml/d for an existing transfer out to SEW in DYAA, and 5Ml/d in DYCP The mutually exclusive interdependencies are applied the same to all runs; the mandatory options are applied to runs 19 and 20. These are: SESW-MET-113: Smart Metering of all households SESW-LEA-078i: Increased ALC effort_i SESW-LEA-301c: Improve ALC efficiency_c SESW-LEA-302c: Improve RM efficiency_c SESW-LEA-303: Enhanced pressure management In runs 21 and 22 the mandatory options above are selected, with SESW-MET-113 being replaced with SESW-MET-311: Smart Metering of selected households Transfers R12 and R13 have zero yield as they don t contribute to the S/D balance; they are growth options. In runs the mandatory options are the following: SESW-MET-311: Smart metering of selected households SESW-LEA-399d: Mains renewal_d Runs had the mandatory options deselected.
90 Report on EBSD model runs Run 041 Met555 plus 2035 export without R22/R28 can start from Final Run with N8 1in200 Undiscounted Cost First year of option utilisation 93,098, mandatory 93,292, mandatory Options disallowed R10, R12, R12R, R13, R13R, R15, R8, R21, R26, R2, R1, R22, R28 R10, R12, R12R, R13, R13R, R15, R8, R21, R26, R2, R1, R22, R28 Costs/Yields Drought Most Likely WDHR Most Likely 1:200 Mandatory Options Runs have the following mandatory options selected: SESW-MET-555: Compulsory smart metering - higher meter penetration SESW-LEA-399d: Mains renewal_d Mutual Exclusivities: One increased ALC Effort option: SESW-LEA-078a to SESW-LEA-078k One increased ALC Efficiency Option: SESW-LEA-301a to SESW-LEA-301c One increased Repair efficiency option: SESW-LEA-302a to SESW-LEA-302c One Metering option from:
91 SESW-MET-311: Smart metering of selected households SESW-MET-113: Smart Metering of all households SESW-MET-113a: AMR Metering One Water Efficiency option from: SESW-WEF-019: Household WEFF programme company led self Install SESW-WEF-020: Household WEFF programme company led plumber install SESW-WEF-021: Household WEFF programme partnering approach home visit SESW-WEF-157: Dual flush toilets retrofit One Main Renewal option from: SESW-LEA-399a: Mains renewal_a SESW-LEA-399b: Mains renewal_b SESW-LEA-399c: Mains renewal_c SESW-LEA-399d: Mains renewal_d Phased Deliveries: 1. SESW-ASR-R21: North Downs Confined Chalk AR extension 2 (new borehole on SE side of Football Club) is dependent on: SESW-ASR-R2: North Downs Confined Chalk AR extension 1 (Bishopsford Road) 2. SESW-RTR-R12R: 20Ml/d transfer from Langley Park/North Looe Reservoirs to Outwood PS-reverse is dependent on: SESW-RTR-R12: 20Ml/d transfer from Langley Park/North Looe Reservoirs to Outwood PS 3. SESW-RTR-R13R: 12Ml/d transfer from Langley Park/North Looe Reservoirs to Buckland-reserve is dependent on: SESW-RTR-R13: 12Ml/d transfer from Langley Park/North Looe Reservoirs to Buckland

92 SESWater EBSD Model Run Output Case Name: Relaxed Stakeholder Choices (WDHR) Code: Run025 Input file used: EBSD Input Template EBSD Input Template SESW PR19 v4.8 WDHR.xlsx Date/Time of optimisation run: 10:30 24 nd Nov 2017 Options Used and Start Year: Supply/Demand Balance:
93 Costs:

94 SESWater EBSD Model Run Output Case Name: Relaxed Stakeholder Choices (1 in 200) Code: Run026 Input file used: EBSD Input Template EBSD Input Template SESW PR19 v4.8 1 in 200.xlsx Date/Time of optimisation run: 16:40 24 nd Nov 2017 Options Used and Start Year: Supply/Demand Balance:

95 Costs:
 Code: Run027 Input file to be used: EBSD")

96 SESWater EBSD Model Run Output Case Name: Least Cost stakeholder (WDHR) Code: Run027 Input file to be used: EBSD Input Template SESW PR19 v4.8 WDHR.xlsx Date/Time of optimisation run: 11:40 29 nd Nov 2017 Options Used and Start Year: Supply/Demand Balance:

97 Costs:

98 SESWater EBSD Model Run Output Case Name: Least Cost without mandatory options (1 in 200) Code: Run028 Input file to be used: EBSD Input Template SESW PR19 v4.8 1 in 200.xlsx Date/Time of optimisation run: 16:40 29 nd Nov 2017 Options Used and Start Year: Supply/Demand Balance:
99 Costs:

100 SESWater EBSD Model Run Output Case Name: Environmental run stakeholder (WDHR) Code: Run029 Input file to be used: EBSD Input Template SESW PR19 v4.8 WDHR.xlsx Date/Time of optimisation run: 15:40 29 nd Nov 2017 Options Used and Start Year: Supply/Demand Balance:
101 Costs:

102 SESWater EBSD Model Run Output Case Name: Environmental Run stakeholder (1 in 200) Code: Run030 Input file to be used: EBSD Input Template SESW PR19 v4.8 1 in 200.xlsx Date/Time of optimisation run: 12:40 29 nd Nov 2017 Options Used and Start Year: Supply/Demand Balance:

103 Costs:
104 SESWater EBSD Model Run Output Case Name: Improved Level of Service Cost stakeholder (WDHR) Code: Run031 Input file to be used: EBSD Input Template SESW PR19 v4.8 WDHR.xlsx Date/Time of optimisation run: 15:40 29 nd Nov 2017 Options Used and Start Year: Supply/Demand Balance:
105 Costs:
106 SESWater EBSD Model Run Output Case Name: Improved Level of Service Run stakeholder (1 in 200) Code: Run032 Input file used: EBSD Input Template EBSD Input Template SESW PR19 v4.8 1 in 200.xlsx Date/Time of optimisation run: 12:40 30 nd Nov 2017 Options Used and Start Year: Supply/Demand Balance:
107 Costs:

108 SESWater EBSD Model Run Output Case Name: Stakeholder runs with Met export w/o R22/R28 (WDHR) starting at 2020 Code: Run041 Input file to be used: EBSD Input Template SESW PR19 v4.10 WDHR.xlsx Date/Time of Optimisation run: 16:50 23 th Jan 2018 Options Used and Start Year: Supply/Demand Balance:
109 Costs:


110 SESWater EBSD Model Run Output Case Name: Final Run with N8 1in200 Code: Run043 Input file to be used: EBSD Input Template SESW PR19 v4.11 1in200.xlsx Date/Time of Optimisation run: 18:15 23 th Jan 2018 Options Used and Start Year: Supply/Demand Balance: DYAA


111 DYCP Costs: