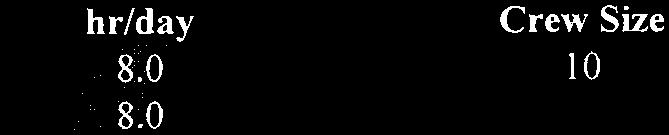
APPENDIX 4.1 Air Quality Reports and Correspondence
|
|
|
- Elizabeth Logan
- 5 years ago
- Views:
Transcription
1 APPENDIX 4.1 Air Quality Reports and Correspondence
2 4.1a Localized Significance Threshold Analysis (Project Construction), Air Quality Dynamics, January 2014
3 CASTAIC HIGH SCHOOL PROJECT LOCALIZED SIGNIFICANCE THRESHOLD ANALYSIS (Project Construction) Prepared For: Meridian Consultants LLC 860 Hampshire Road, Suite P Westlake Village, California Prepared By: Air Quality Dynamics (818) January 2014
4 TABLE OF CONTENTS Section Page 1.0 Introduction Site Description Localized Significance Threshold Analysis Estimation of On-Site Emissions 3.2 Estimation of Pollutant Concentrations 4.0 Pollutant Impact Analysis Findings Conclusion Mitigation of Pollutant Impacts 10 References 12 Appendices Appendix A Appendix B Appendix C Appendix D Emission Calculation Worksheets Emission Rate Summary/Source Data Worksheets Source-Receptor Grid Networks Dispersion Model Input/Output Files (Electronic Format) List of Figure(s) Figure 1 Site Location /Vicinity Aerial Photograph List of Table(s) Table 1 Maximum Daily Emissions/Site Access Roads Table 2 Maximum Daily Emissions/School Site Table 3 California Ambient Air Quality Standards Table 4 Santa Clarita Monitoring Summary/Source-Receptor Area 13 Table 5 SCAQMD Air Quality Significance Thresholds Table 6 Maximum Pollutant Concentrations/Site Access Roads Table 7 Maximum Pollutant Concentrations/School Site
5 1.0 INTRODUCTION The South Coast Air Quality Management District (SCAQMD) provides voluntary guidance on the evaluation of localized air quality impacts to public agencies conducting environmental review of projects located within its jurisdiction. Localized air quality impacts are evaluated by examining the on-site generation of pollutants and their resulting downwind concentrations. For construction, pollutant concentrations are compared to significance thresholds for particulates (PM 10 and PM 2.5 ), carbon monoxide (CO) and nitrogen dioxide (NO 2 ). The significance threshold for PM 10 represents compliance with SCAQMD Rule 403 (Fugitive Dust). The threshold for PM 2.5 is designed to limit emissions and allow progress toward attainment of the ambient air quality standard. Thresholds for CO and NO 2 represent the allowable increase in concentrations above background levels that would not cause or contribute to an exceedance of their respective ambient air quality standards. Based upon the extent of the project s earth moving and related construction activities, a Localized Significance Threshold (LST) analysis was prepared to determine the project s potential environment effects on local air quality. The technical approach and dispersion modeling methodologies used in the preparation of the LST analysis were composed of all relevant and appropriate procedures presented by the U.S. Environmental Protection Agency (U.S. EPA), California Environmental Protection Agency and SCAQMD. The methodologies and assumptions offered under this regulatory guidance were used to ensure that the analysis effectively quantified exposures to sensitive receptors associated with the generation of pollutant emissions from on-site construction activity. This report summarizes the protocol used to evaluate pollutant exposures and presents the results of the LST analysis. 2.0 SITE DESCRIPTION The project consists of the construction of a new high school complex with approximately 250,000 square feet of building area. Building amenities include classrooms, library, performing arts, multipurpose, physical education and administrative facilities. Athletic services include a 5,000-seat football/soccer stadium with a running track, tennis courts, basketball courts, baseball and softball fields and related play fields. The project will also incorporate the development of several roadway segments providing school access via Canyon Hill Road, Sloan Canyon Road East, Baringer Road and Sloan Canyon Road South. The project is located within the community of Castaic, an unincorporated area of Los Angeles County, California. The site encompasses land east and west of Romero Canyon Road. The City of Santa Clarita is located approximately five miles south; Castaic Lake to the northeast, east of Interstate 5 (I-5) and the Los Padres National Forest to the north. The site is currently vacant and consists of hills, steep ridges and canyons. Sparse residential dwellings are located predominately south of the site with dense residential development 1

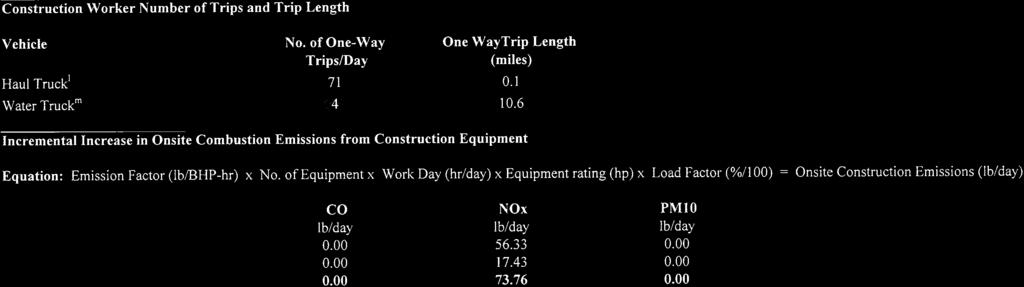
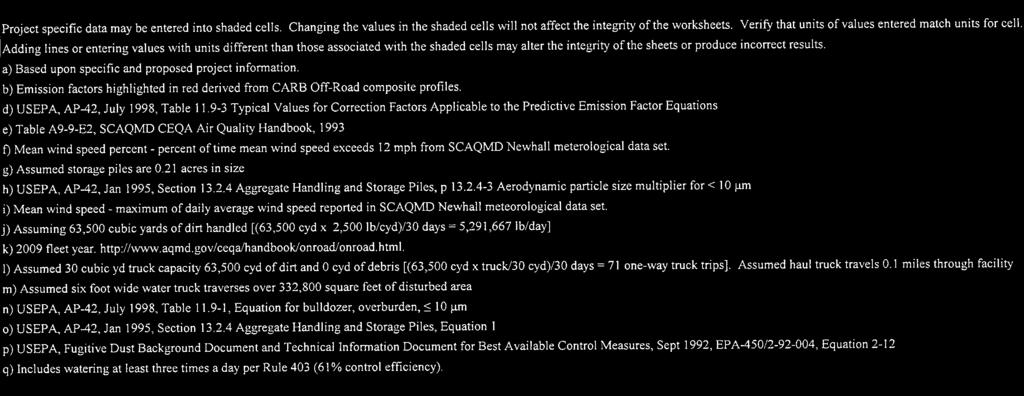
6 located to the east. North and west of the site the land is generally undeveloped. Figure 1 presents an aerial photograph of the proposed project location. Figure 1 Site Location /Vicinity Aerial Photograph 3.0 LOCALIZED SIGNIFICANCE THRESHOLD ANALYSIS Based upon the extent of the project s proposed earth moving and heavy construction activities, air quality was identified as one area subject to further analysis whereby emissions associated with construction operations may result in concentrations in the immediate vicinity of the project site that exceed significance thresholds for PM 10, PM 2.5, CO and NO 2 established by the SCAQMD. To determine if these potential impacts are significant, an LST analysis was prepared. 3.1 Estimation of On-Site Emissions The localized impacts of the project were evaluated based on the maximum daily emissions generated during each identified construction phase. To determine maximum daily emissions, the sample construction scenario spreadsheets developed by the SCAQMD were used as the basis to estimate project specific emissions. For the east and south access road locations, emissions associated with site preparation/clearing/grading and paving were assessed. For construction of the main school site/campus, the analysis evaluated discrete phases 2
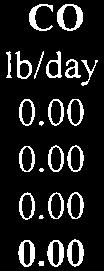
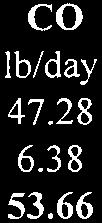
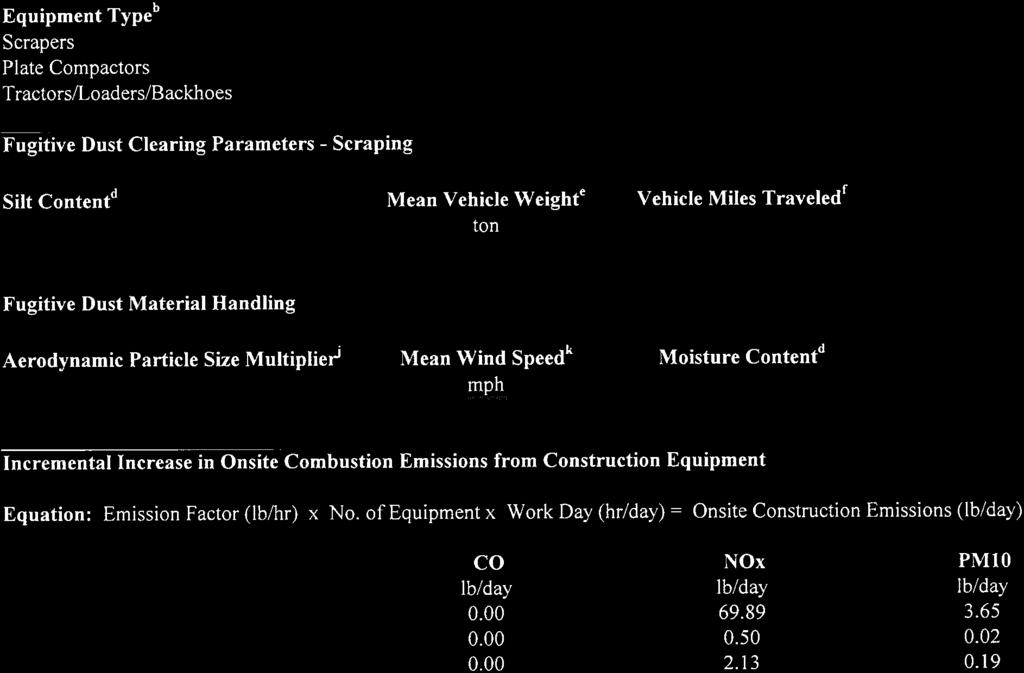
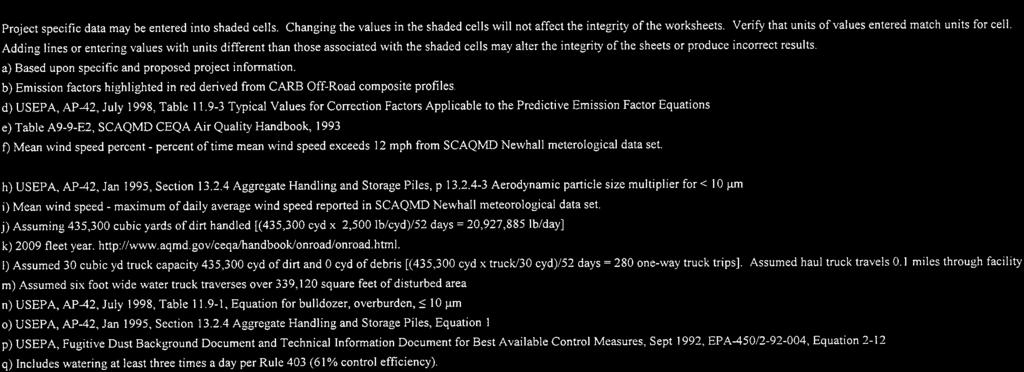
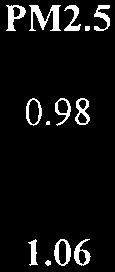
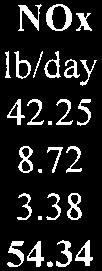
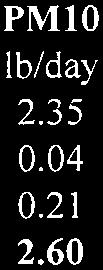
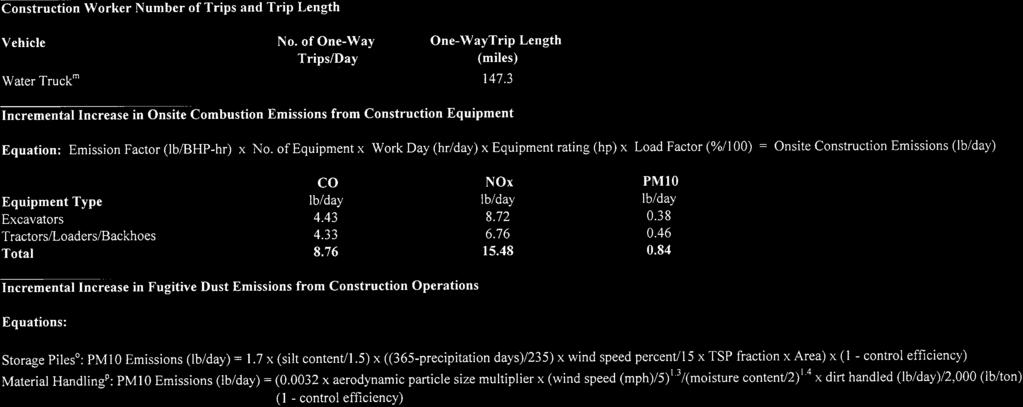
7 commensurate with those identified by the project applicant and include site preparation/clearing, grading, trenching/utilities, building construction and paving. Appropriate adjustments were made to the SCAQMD construction scenarios to accommodate specific characteristics of the proposed project. These adjustments include the use of updated off-road emission factors, site dimensions, equipment inventory, number of on-site workers, hours of operation, duration of construction phase, disturbed surface area, amount of soil/debris handled and wind speed. Tables 1 and 2 provide a summary of estimated maximum daily emissions for each site and construction phase. Appendix A presents the emission calculation worksheets used to quantify pollutant source strength. Table 1 Maximum Daily Emissions Site Access Roads Segment Construction Phase Pollutant PM 10 PM 2.5 CO NO x (Lbs/Day) (Lbs/Day) (Lbs/Day) (Lbs/Day) Canyon Hill Road Sloan Canyon Road East Baringer Road / Romero Canyon Road Improvements Sloan Canyon Road South Site Preparation/Clearing/ Grading Paving Site Preparation/Clearing/ Grading Paving Site Preparation/Clearing/ Grading Paving Site Preparation/Clearing/ Grading Paving Table 2 Maximum Daily Emissions School Site Pollutant Construction Phase PM 10 PM 2.5 CO NO x (Lbs/Day) (Lbs/Day) (Lbs/Day) (Lbs/Day) Site Preparation/Clearing Grading Trenching/Utilities Building Construction Paving
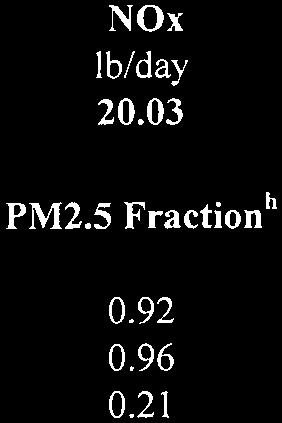
8 3.2 Estimation of Pollutant Concentrations In order to assess the impact of PM 10, PM 2.5, and CO emissions on the adjoining community, air quality modeling utilizing the Industrial Source Complex-Short Term (ISCST3) model was performed. This model is a steady state Gaussian plume model used by the SCAQMD to develop the LST Methodology. For NO 2, the AMS/EPA Regulatory Model AERMOD was used to assess the downwind extent of nitrogen oxide (NO x ) emissions and determine their subsequent conversion to ambient NO 2 concentrations. AERMOD offers a refinement over the conversion rate ratios utilized in the LST Methodology as adapted from the work of Arellano et al. AERMOD s air dispersion algorithms are based upon a planetary boundary layer turbulence structure and scaling concepts, including the treatment of surface and elevated sources in simple and complex terrain. The model incorporates two methodologies to perform the NO x to NO 2 conversion. In a recent clarification memorandum (U.S. EPA, 2011), the Office of Air Quality Planning and Standards provides guidance on the use and performance of the two algorithms referred to as the ozone limiting (OLM) and plume volume molar ratio (PVMRM) methods. Based upon this guidance, the OLM algorithm with the OLMGROUP ALL option was identified as the preferred method to perform the analysis. An initial NO 2 /NO x ratio of 5 percent (i.e., NO2STACK), as utilized in the LST Methodology, was assigned to all mobile sources. Although the project is located in complex terrain, ISCST3 assumes area sources are terrain following. To ensure consistency in the modeling exercise, mobile source PM 10 and PM 2.5 emissions were also modeled assuming flat terrain. For CO emissions, both flat and complex terrain conditions were assessed to identify maximum pollutant concentrations. For NO2, the analysis followed guidance promulgated by the U.S. EPA (U.S. EPA, 2009) whereby the AERMOD model was programmed to assume flat, level terrain. This was done as the model will tend to underestimate pollutant concentrations in cases where receptor elevations are lower than the base elevation of the source and down-slope gravity and drainage flow patterns promote a terrain following plume. Source treatment outlined in the LST methodology was utilized whereby exhaust emissions from construction equipment were treated as a set of side-by-side elevated volume sources with a release height of five and an initial vertical dimension of 1.4 meters. Fugitive dust emissions were treated as a ground-based source with a one meter vertical dimension and source areas incorporating project site acreage and configuration. For PM 10 and PM 2.5, plume depletion due to dry removal mechanisms was assumed (i.e., ARDPLT). Entrained or fugitive PM 10 emissions were separated into three aerodynamic diameter sizes of 1.0, 2.5 and 10 microns ( m) with weight fractions of , , and , respectively. Fugitive PM 2.5 emissions were separated into two particle sizes of 1.0 and 2.5 m with corresponding weight fractions of and PM 10 emissions associated with mobile source activity were assigned particle size bins of 2.5 and 10 microns with corresponding weight fractions of 0.92 and PM 2.5 emissions were limited to an 4
9 aerodynamic diameter of 2.5 m. A particle density of 2.3 grams per cubic centimeter was assigned to all size bins. Air dispersion models require additional input parameters including pollutant emission data and local meteorology. Due to the their sensitivity to individual meteorological parameters such as wind speed and direction, the U.S. EPA recommends that meteorological data used as input into dispersion models be selected on the basis of relative spatial and temporal conditions that exist in the area of concern. In response to this recommendation, meteorological data from the SCAQMD Newhall/Santa Clarita monitoring station was used to represent local weather conditions and prevailing winds. For ISCST3, a preprocessed 1981 data set was utilized. For AERMOD, five years ( ) of available meteorological data were reviewed to identify the calendar years which produced the highest NO 2 pollutant concentrations. Model scalar options were additionally invoked to address emissions generated during daytime hours and commensurate with on-site construction activity (e.g., ending hours 9 to 16). Construction activities associated with identified access roads and the school site will not coincide and are treaded as discrete operations in the dispersion analysis. To accommodate a Cartesian grid format for the identified construction activities, direction dependent calculations were obtained by identifying the universal transverse mercator (UTM) coordinates for each source location. Off-site receptors were identified to provide representative coverage throughout the adjoining community. A flagpole receptor height of two meters was also assumed and assigned to each receptor location. A graphical representation of the source-receptor grid networks associated with access road and school site construction activities are presented in Appendix C. Pollutant emission rate and source data used to complete the dispersion analysis are provided in Appendix B. A complete listing of model input/output files are provided in electronic format in Appendix D. 4.0 POLLUTANT IMPACT ANALYSIS The State of California has promulgated strict ambient air quality standards for various pollutants. These standards were established to safeguard the public s health and welfare with specific emphasis on protecting those individuals susceptible to respiratory distress, such as asthmatics, the young, the elderly and those with existing conditions which may be affected by increased pollutant concentrations. Table 3 presents the California Ambient Air Quality Standards (CAAQS) and averaging times for the criteria pollutants considered in the assessment. Pollutant emissions are considered to have a significant effect on the environment if they result in concentrations that create either a violation of an ambient air quality standard, contribute to an existing air quality violation or expose sensitive receptors to substantive pollutant concentrations. Should ambient air quality already exceed existing standards, the 5
10 SCAQMD has established significance criteria for selected compounds to account for the continued degradation of local air quality. Background concentrations are based upon the highest observed value for the most recent three year period. Table 3 California Ambient Air Quality Standards Pollutant Standard Health Effects Particulates (PM 10 ) Particulates (PM 2.5 ) Carbon Monoxide (CO) Nitrogen Dioxide (NO 2 ) >50 g/m3 (24 hr avg.) >20 g/m3 (Annual) >12 g/m3 (Annual) >9.0 ppm (8 hr avg.) >20.0 ppm (1 hr avg.) >0.18 ppm (1 hr avg.) 1) Excess deaths from short-term exposures and the exacerbation of symptoms in sensitive individuals with respiratory disease. 2) Excess seasonal declines in pulmonary function especially in children. 1) Excess deaths and illness from long-term exposures and the exacerbation of symptoms in sensitive individuals with respiratory and cardio pulmonary disease. 1) Aggravation of angina pectoris and other aspects of coronary heart disease. 2) Decreased exercise tolerance in persons with peripheral vascular disease and lung disease. 3) Impairment of central nervous system functions. 4) Possible increased risk to fetuses. 1) Potential to aggravate chronic respiratory disease and respiratory symptoms in sensitive groups. 2) Risk to public health implied by pulmonary and extrapulmonary biochemical and cellular changes and pulmonary structural changes. Abbreviations: ppm: parts per million; g/m 3 : micrograms per cubic meter. Source: California Code of Regulations, Title 17, Section For short duration construction activities, the SCAQMD has established discrete thresholds for particulates based upon ambient air concentrations required to exceed an equivalent value of 50 micrograms per cubic meter ( g/m 3 ) averaged over five hours. The equivalent concentration for both PM 10 and PM 2.5 is 10.4 g/m 3. This threshold applies to sensitive receptors such as a residence, hospital or convalescent facility were it is possible that an individual could remain for 24 hours. For the CO 1 and 8-hour averaging times and the NO 2 1-hour averaging time, background concentrations are below current air quality standards. As such, significance is achieved when pollutant concentrations add to existing levels and create an exceedance of the CAAQS. Unlike the particulate threshold referenced above which is based upon an individuals daily exposure, short duration exposures apply to all receptors such as industrial or commercial facilities since it is reasonable to assume that an individual could be present for periods of one to eight hours. Table 4 shows the pollutant concentrations for CO and NO 2 collected at the Santa Clarita Monitoring Station (Source-Receptor Area 13) for the last three years of available data. Table 5 outlines the relevant significance thresholds considered in the LST analysis. 6
11 Table 4 Santa Clarita Monitoring Summary / Source-Receptor Area 13 Pollutant/ Year Averaging Time Maximum Carbon Monoxide (CO) 1-Hour 8-Hour Nitrogen Dioxide (NO 2 ) 1-Hour Note: PM 10 concentrations are expressed in micrograms per cubic meter ( g/m 3 ). All others are expressed in parts per million (ppm). Source: South Coast Air Quality Management District and U.S Environmental Protection Agency. Table 5 SCAQMD Air Quality Significance Thresholds Pollutant Averaging Time Pollutant Concentration Particulates (PM 10 ) Particulates (PM 2.5 ) Carbon Monoxide (CO) Nitrogen Dioxide (NO 2 ) 24-Hours 1/8-Hours 1-Hour 10.4 g/m3 (construction) SCAQMD is in attainment; project is significant if it causes or contributes to an exceedance of the following attainment standards 20 ppm (1-hour) and 9 ppm (8-hour). SCAQMD is in attainment; project is significant if it causes or contributes to an exceedance of the following attainment standard 0.18 ppm. Abbreviations: ppm: parts per million; g/m 3 : micrograms per cubic meter Source: South Coast Air Quality Management District. 5.0 FINDINGS A brief discussion of the results of the dispersion analysis are presented for each identified construction phase Tables 6 and 7 present the modeled concentrations predicted for each pollutant. For the construction of Canyon Hill Road, PM 10 and PM 2.5 maximum concentrations of and micrograms per cubic meter ( g/m 3 ) were predicted. These values do not exceed SCAQMD s significance threshold of 10.4 g/m 3. The maximum modeled 1-hour average concentration for CO of parts per million (ppm) when added to an existing background concentration of 2.0 ppm, will not cause an exceedance of the CAAQS of 20 ppm. For the 8-hour averaging time, the maximum predicted concentration of , when added to an existing background level of 1.1 ppm, does not cause an exceedance of the CAAQS of 9 ppm. For NO 2, a maximum one hour concentration of ppm ( g/m 3 ) was predicted. This concentration, when added to a background concentration of ppm, will not cause an exceedance of the CAAQS of 0.18 ppm. 7
12 For the construction of Sloan Canyon Road East, PM 10 and PM 2.5 maximum concentrations of and micrograms per cubic meter ( g/m 3 ) were predicted. These values do not exceed SCAQMD s significance threshold of 10.4 g/m 3. The maximum modeled 1-hour average concentration for CO of ppm when added to an existing background concentration of 2.0 ppm, will not cause an exceedance of the CAAQS of 20 ppm. For the 8- hour averaging time, the maximum predicted concentration of , when added to an existing background level of 1.1 ppm, does not cause an exceedance of the CAAQS of 9 ppm. For NO 2, a maximum one hour concentration of ppm ( g/m 3 ) was predicted. This concentration, when added to a background concentration of ppm, will exceed the CAAQS of 0.18 ppm. For the construction of Baringer Road and Romero Canyon Road improvements, PM 10 and PM 2.5 maximum concentrations of and g/m 3 were predicted. For PM10, this value exceeds SCAQMD s significance threshold of 10.4 g/m 3. The maximum modeled 1-hour average concentration for CO of ppm when added to an existing background concentration of 2.0 ppm, will not cause an exceedance of the CAAQS of 20 ppm. For the 8- hour averaging time, the maximum predicted concentration of , when added to an existing background level of 1.1 ppm, does not cause an exceedance of the CAAQS of 9 ppm. For NO 2, a maximum one hour concentration of ppm ( g/m 3 ) was predicted. This concentration, when added to a background concentration of ppm, will exceed the CAAQS of 0.18 ppm. For the construction of Sloan Canyon Road South, PM 10 and PM 2.5 maximum concentrations of and g/m 3 were predicted. These values do not exceed SCAQMD s significance threshold of 10.4 g/m 3. The maximum modeled 1-hour average concentration for CO of ppm when added to an existing background concentration of 2.0 ppm, will not cause an exceedance of the CAAQS of 20 ppm. For the 8-hour averaging time, the maximum predicted concentration of , when added to an existing background level of 1.1 ppm, does not cause an exceedance of the CAAQS of 9 ppm. For NO 2, a maximum one hour concentration of ppm ( g/m 3 ) was predicted. This concentration, when added to a background concentration of ppm, will not cause an exceedance of the CAAQS of 0.18 ppm. For school site construction, PM 10 and PM 2.5 maximum concentrations of and g/m 3 were predicted. These values do not exceed SCAQMD s significance threshold of 10.4 g/m 3. The maximum modeled 1-hour average concentration for CO of ppm when added to an existing background concentration of 2.0 ppm, will not cause an exceedance of the CAAQS of 20 ppm. For the 8-hour averaging time, the maximum predicted concentration of ppm, when added to an existing background level of 1.1 ppm, does not cause an exceedance of the CAAQS of 9 ppm. 8
13 For NO 2, a maximum one hour concentration of ppm ( g/m 3 ) was predicted. This concentration, when added to a background concentration of ppm, will not cause an exceedance of the CAAQS of 0.18 ppm. Table 6 Maximum Pollutant Concentrations Site Access Roads Segment Construction Phase Pollutant PM 10 PM 2.5 CO NO x (24-Hours) (24-Hours) (1-Hour/8 Hours) (1-Hour) Canyon Hill Road Sloan Canyon Road East Baringer Road / Romero Canyon Road Improvements Sloan Canyon Road South Site Preparation/Clearing/ Grading / Paving / Site Preparation/Clearing/ Grading / Paving / Site Preparation/Clearing/ Grading / Paving / Site Preparation/Clearing/ Grading / Paving / Note: Particulate concentrations are expressed in micrograms per cubic meter ( g/m 3 ). All others are expressed in parts per million (ppm). Nitrogen Dioxide (NO2) concentrations were converted from the dispersion model output expressed in micrograms per cubic meter ( g/m 3 ) to ppm assuming a compound molecular weight of 46 and conversion at 25 o C. Table 7 Maximum Pollutant Concentrations School Site Pollutant Construction Phase PM 10 PM 2.5 CO NO x (24-Hours) (24-Hours) (1-Hour/8 Hours) (1-Hour) Site Preparation/Clearing / Grading / Trenching/Utilities / Building Construction / Paving / Note: Particulate concentrations are expressed in micrograms per cubic meter ( g/m 3 ). All others are expressed in parts per million (ppm). Nitrogen Dioxide (NO2) concentrations were converted from the dispersion model output expressed in micrograms per cubic meter ( g/m 3 ) to ppm assuming a compound molecular weight of 46 and conversion at CONCLUSION Results of the LST analysis reveal that maximum pollutant concentrations of NO 2 during construction (i.e., site preparation, clearing and grading) of Sloan Canyon Road East are 9
14 predicted to exceed the significance threshold of 0.18 ppm. In addition, site preparation, clearing and grading activities associated with the construction of Baringer Road and associated Romero Canyon Road improvements are predicted to exceed significance thresholds for PM 10 and NO 2. For all remaining construction phases of the proposed project, pollutant concentrations are not anticipated to exceed identified significance thresholds at any receptor location. 7.0 MITIGATION OF POLLUTANT IMPACTS As noted above, the significance threshold for PM 10 represents compliance with SCAQMD Rule 403. Implementation of the following mitigation options are recommended to reduce particulate concentrations associated with the construction of the Baringer Road/Romero Canyon Road improvements segment below identified significance thresholds. Option 1 Comply with all relevant and appropriate provisions of SCAQMD Rule 403. Implementation of best available control measures as outlined in Rule 403 will serve to prevent, reduce and mitigate fugitive dust emissions. Validation of compliance, which limits disparity in upwind/downwind PM 10 concentrations to 50 g/m 3, can be achieved by conducting simultaneous sampling to identify the difference between upwind/downwind samples collected on high-volume particulate matter samplers or other U.S. EPA-approved equivalent methods. Option 2 Utilize heavy construction equipment rated 75 horsepower and above that meet Tier 3 emission standards. Under this scenario, a maximum PM 10 concentration of g/m 3 was predicted. This value is below the SCAQMD significance threshold of 10.4 g/m 3. The significance threshold for NO 2 represents the allowable increase in concentrations above background levels that would not cause or contribute to an exceedance of the ambient air quality standard. As previously noted, the LST analysis assumed a maximum background concentration of ppm. It is recommended that a performance standard be utilized to limit NO 2 exposures by verifying background concentrations prior to the commencement of construction activities for Sloan Canyon East and the Baringer Road/Romero Canyon Road improvements construction phases. The SCAQMD provides a daily forecast of pollutant concentrations for the Santa Clarita Valley ( A daily review should be conducted and background values recorded and compared to the maximum predicted LST analysis concentration. For forecast concentrations at or below 0.02 ppm (based upon an averaging time adjustment factor of 0.4 to convert a 24 hour to one hour averaging time), NO 2 impacts would be considered less than significant. Should background concentrations exceed 0.02 ppm, the following options may be implemented to eliminate and/or reduce NO 2 impacts. 10
15 For Sloan Canyon Road East: Option 1 Reduce the construction fleet which limits active scraper and bulldozer activity to 6 and 4, respectively. Under this scenario, a maximum one hour NO 2 concentration of ppm ( g/m 3 ) was predicted. This concentration, when added to a background concentration of ppm, will meet but not exceed the CAAQS. Option 2 Utilize heavy construction equipment rated 75 horsepower and above that meet Tier 3 emission standards. Under this scenario, a maximum one hour NO 2 concentration of ppm ( g/m 3 ) was predicted. This concentration, when added to a background concentration of ppm, will produce pollutant concentrations below the CAAQS. For Baringer Road/Romero Canyon Road improvements: Option 1 Reduce the construction fleet which limits active scraper and bulldozer activity to 6 and 4, respectively. Under this scenario, a maximum one hour NO 2 concentration of ppm ( g/m 3 ) was predicted. This concentration, when added to a background concentration of ppm, will exceed the CAAQS. Although the impact remains significant, the reduction in equipment inventory will serve to reduce pollutant concentrations yet maintain a sufficient off-road fleet to allow continued construction of the roadway segment. Option 2 Utilize heavy construction equipment rated 75 horsepower and above that meet Tier 3 emission standards. Under this scenario, a maximum one hour NO 2 concentration of ppm ( g/m 3 ) was predicted. This concentration, when added to a background concentration of ppm, will exceed the CAAQS. Use of this option will reduce but not eliminate pollutant impacts. 11
16 REFERENCES 1. Arellano et al, A Chemically Reactive Plume Model for the NO-NO 2 -O 3 System. 2. California Air Pollution Control Officers Association (CAPCOA), Toxic Air Pollutant Source Assessment Manual for California Air Pollution Control Districts and Applicants for Air Pollution Control District Permits, prepared by Interagency Workshop Group, (Revised) December California Air Pollution Control Officers Association (CAPCOA), Air Toxics Hot Spots Program Risk Assessment Guidelines. 4. California Air Resources Board, Methods for Assessing Area Source Emissions in California: Volume III (Revised). 5. California Code of Regulations, Title 17, Section Futaba, Debbie, California Air Resources Board, Revised off road in-use emission factors for the South Coast Air Basin. 7. McCarthy, Brian, Meridian Consultants, LLC., Personal communications with Bill Piazza, Air Quality Dynamics. 8. United States Environmental Protection Agency, AirData Data Mart. Website: 9. United States Environmental Protection Agency, Office of Air Quality Planning and Standards, Additional Clarification Regarding Application of Appendix W Modeling Guidance for the 1-hour NO2 National Ambient Air Quality Standard. 10. United States Environmental Protection Agency, User s Guide for the AMS/EPA Regulatory Model - AERMOD. EPA-454/B United States Environmental Protection Agency, Office of Air Quality Planning and Standards, Compilation of Air Pollutant Emission Factors, Volume 1: Stationary Point and Area Sources, Fifth Edition. AP United States Environmental Protection Agency, Screening Procedures for Estimating the Air Quality Impact of Stationary Sources, Revised. EPA-450/R United States Environmental Protection Agency, Guideline on Air Quality Models (Revised). EPA-450/ R. 14. United States Environmental Protection Agency, Office of Air Quality Planning and Standards, User s Guide for the Industrial Source Complex (ISC3) Dispersion Models, Volumes I and II. EPA-454/B a and b. 15. South Coast Air Quality Management District, Historical Data by Year. Website: 12
17 16. South Coast Air Quality Management District, Daily Air Quality Forcast. Website: South Coast Air Quality Management District, SCAQMD Air Quality Significance Thresholds. Website: South Coast Air Quality Management District, Air Quality Significance Thresholds. Website: South Coast Air Quality Management District, AQMD Modeling Guidance for AERMOD. Website: Guidance.html. 20. South Coast Air Quality Management District, CEIDARS PM Profile Database. Website: South Coast Air Quality Management District, Meteorological Data Set for Santa Clarita, California. 22. South Coast Air Quality Management District, Final Localized Significance Threshold Methodology. 23. South Coast Air Quality Management District, Final Methodology to Calculate Particulate Matter (PM) 2.5 and PM 2.5 Significance Thresholds. 24. South Coast Air Quality Management District, Sample Construction Scenarios for Projects Less than Five Acres in Size. 25. South Coast Air Quality Management District, Meteorological Data Set for Newhall, California. 26. William S. Hart Union High School District, 2012, Castaic High School Draft Environmental Impact Report (SCH No
18 APPENDIX A Emission Calculation Worksheets A


19
20

21
22

23

24


25

26

27


28


29


30
31
32


33


34
35

36


37
38
39


40
41

42
43

44


45
46


47

48


49
50
51
52


53

54
55


56


57


58
59


60


61

62

63


64
65

66


67


68

69
70
71


72
73


74
75

76


77


78


79
80


81


82


83
84

85


86


87

88


89


90

91
92


93

94
95
96 APPENDIX B Emission Rate Summary/Source Data Worksheets B
97 Emission Rate Summary Worksheet Canyon Hill Road PM10 Phase Fugitive Combustion Fugitive Combustion mass mass g/s/m2 g/s/source SP/C/G E E-03 Paving E E-04 Source Area Sources 41 PM2.5 Phase Fugitive Combustion Fugitive Combustion mass mass g/s/m2 g/s/source SP/C/G E E-03 Paving E E-04 Source Area Sources 41 CO Phase Combustion Combustion mass g/s/source SP/C/G E-02 Paving E-03 Sources 41 NOX Phase Combustion Combustion mass g/s/source SP/C/G E-02 Paving E-03 Sources 41 B-1
98 Emission Rate Summary Worksheet Sloan Canyon Road East PM10 Phase Fugitive Combustion Fugitive Combustion mass mass g/s/m2 g/s/source SP/C/G E E-03 Paving E E-04 Source Area Sources 52 PM2.5 Phase Fugitive Combustion Fugitive Combustion mass mass g/s/m2 g/s/source SP/C/G E E-03 Paving E E-04 Source Area Sources 52 CO Phase Combustion Combustion mass g/s/source SP/C/G E-02 Paving E-03 Sources 52 NOX Phase Combustion Combustion mass g/s/source SP/C/G E-02 Paving E-03 Inventory Reduction Sources 52 NOX Phase Combustion Combustion mass g/s/source SP/C/G E-02 Tier 3 Inventory Sources 52 NOX Phase Combustion Combustion mass g/s/source SP/C/G E-02 Sources 52 B-2
99 Emission Rate Summary Worksheet Baringer Road / Romero Canyon Road Improvements PM10 Phase Fugitive Combustion Fugitive Combustion mass mass g/s/m2 g/s/source SP/C/G E E-03 Paving E E-04 Source Area Sources 35 PM2.5 Phase Fugitive Combustion Fugitive Combustion mass mass g/s/m2 g/s/source SP/C/G E E-03 Paving E E-04 Source Area Sources 35 CO Phase Combustion Combustion mass g/s/source SP/C/G E-02 Paving E-03 Sources 35 NOX Phase Combustion Combustion mass g/s/source SP/C/G E-01 Paving E-03 Inventory Reduction Sources 35 PM10 Phase Fugitive Combustion Fugitive Combustion mass mass g/s/m2 g/s/source SP/C/G E E-03 Source Area Sources 35 NOX Phase Combustion Combustion mass g/s/source SP/C/G E-02 Sources 35 B-3
100 Tier 3 Inventory PM10 Phase Fugitive Combustion Fugitive Combustion mass mass g/s/m2 g/s/source SP/C/G E E-03 Source Area Sources 35 NOX Phase Combustion Combustion mass g/s/source SP/C/G E-02 Sources 35 B-4
101 Emission Rate Summary Worksheet Sloan Canyon Road South PM10 Phase Fugitive Combustion Fugitive Combustion mass mass g/s/m2 g/s/source SP/C/G E E-03 Paving E E-04 Source Area Sources 53 PM2.5 Phase Fugitive Combustion Fugitive Combustion mass mass g/s/m2 g/s/source SP/C/G E E-03 Paving E E-04 Source Area Sources 53 CO Phase Combustion Combustion mass g/s/source SP/C/G E-02 Paving E-03 Sources 53 NOX Phase Combustion Combustion mass g/s/source SP/C/G E-02 Paving E-03 Sources 53 B-5
102 Emission Rate Summary Worksheet School Site PM10 Phase Fugitive Combustion Fugitive Combustion mass mass g/s/m2 g/s/source SP/C E E-04 Grading E E-03 T/U E E-04 Building E E-04 Paving E E-04 Source Area A Sourch Area B Sources A 232 Sources B 200 PM2.5 Phase Fugitive Combustion Fugitive Combustion mass mass g/s/m2 g/s/source SP/C E E-04 Grading E E-03 T/U E E-04 Building E E-04 Paving E E-04 Source Area A Source Area B Sources A 232 Sources B 200 CO Phase Combustion Combustion mass g/s/source SP/C E-03 Grading E-02 T/U E-03 Building E-03 Paving E-03 Sources A 232 Sources B 200 NOX Phase Combustion Combustion mass g/s/source SP/C E-03 Grading E-02 T/U E-03 Building E-03 Paving E-03 Sources A 232 Sources B 200 B-6
103 Source Data Worksheet Canyon Hill Road Area Poly X Y Volume Sources X Y ZS ZS RH SY SZ CHR_ CHR_ CHR_ CHR_ CHR_ CHR_ CHR_ CHR_ CHR_ CHR_ CHR_ CHR_ CHR_ CHR_ CHR_ CHR_ CHR_ CHR_ CHR_ CHR_ CHR_ CHR_ CHR_ CHR_ CHR_ CHR_ CHR_ CHR_ CHR_ CHR_ CHR_ CHR_ CHR_ CHR_ CHR_ B-7
104 CHR_ CHR_ CHR_ CHR_ CHR_ CHR_ B-8
105 Source Data Worksheet Sloan Canyon Road East Area Poly X Y Volume Sources X Y ZS ZS RH SY SZ SCR_E SCR_E SCR_E SCR_E SCR_E SCR_E SCR_E SCR_E SCR_E SCR_E SCR_E SCR_E SCR_E SCR_E SCR_E SCR_E SCR_E SCR_E SCR_E SCR_E SCR_E B-9
106 SCR_E SCR_E SCR_E SCR_E SCR_E SCR_E SCR_E SCR_E SCR_E SCR_E SCR_E SCR_E SCR_E SCR_E SCR_E SCR_E SCR_E SCR_E SCR_E SCR_E SCR_E SCR_E SCR_E SCR_E SCR_E SCR_E SCR_E SCR_E SCR_E SCR_E SCR_E B-10
107 Source Data Worksheet Baringer Road / Romero Canyon Road Improvements Area Poly X Y Volume Sources X Y ZS ZS RH SY SZ BRRCR_ BRRCR_ BRRCR_ BRRCR_ BRRCR_ BRRCR_ BRRCR_ BRRCR_ BRRCR_ BRRCR_ BRRCR_ BRRCR_ BRRCR_ BRRCR_ BRRCR_ BRRCR_ BRRCR_ BRRCR_ BRRCR_ BRRCR_ BRRCR_ BRRCR_ BRRCR_ BRRCR_ BRRCR_ BRRCR_ B-11
108 BRRCR_ BRRCR_ BRRCR_ BRRCR_ BRRCR_ BRRCR_ BRRCR_ BRRCR_ BRRCR_ B-12
109 Source Data Worksheet Sloan Canyon Road South Area Poly X Y Volume Sources X Y ZS ZS RH SY SZ SCR_S SCR_S SCR_S SCR_S SCR_S SCR_S SCR_S SCR_S SCR_S SCR_S SCR_S SCR_S SCR_S SCR_S SCR_S SCR_S SCR_S SCR_S SCR_S SCR_S SCR_S SCR_S SCR_S SCR_S SCR_S SCR_S SCR_S SCR_S SCR_S B-13
110 SCR_S SCR_S SCR_S SCR_S SCR_S SCR_S SCR_S SCR_S SCR_S SCR_S SCR_S SCR_S SCR_S SCR_S SCR_S SCR_S SCR_S SCR_S SCR_S SCR_S SCR_S SCR_S SCR_S SCR_S B-14
111 Source Data Worksheet School Site (Site Preparation/Clearing/Grading) Area Poly X Y Volume Sources Source ID X Y ZS ZS RH SY SZ V V V V V V V V V V V V V V V V V V V V V V V V V V V V B-15
112 V V V V V V V V V V V V V V V V V V V V V V V V V V V V V V V V V V V V V V V V V V V V V V V V V V V V V B-16