Lake Erie LaMP Nutrient Management Strategy Lake Erie Millennium Network April 27, 2010 Windsor, ON
|
|
|
- Mitchell Green
- 5 years ago
- Views:
Transcription


1 Lake Erie LaMP Nutrient Management Strategy Lake Erie Millennium Network April 27, 2010 Windsor, ON Marie-Claire Doyle & Sandra George On behalf of the Lake Erie Lakewide Management Plan (LaMP)


2 Status of Lake Erie Nutrients Nutrient Strategy: Framework and Targets Next Steps Outline


3 Lake Erie Western Basin September 2009
4 Status of Offshore Waters Not consistently meeting 11,000 tonnes/yr loading target Non-point sources continue to be the largest portion of the loadings to Lake Erie. 48% of loadings to offshore waters comes from western basin watersheds. Western basin rarely meets GLWQA TP target concentration in spring or summer. Central and Eastern basin mostly meets targets in summer; occasionally in spring. External Phosphorus Sources Water Years Average Phosphorus Load metric tons/year % of Total Non-point sources 5, % Point sources 1, % Atmospheric deposition % Upper Lakes 1, % Total 9, % Source: Dave Dolan, U. Wisconsin, Green Bay

5 Status of Nearshore Waters Cladophora in eastern basin reminiscent of 1970s Benthic mat-forming blue-green algae and Microcystis reported in the west basin Increased costs to water treatment plants to remove potentially harmful algal toxins Periodic fish and wildlife kills due to elevated algal toxin levels in water Unstable fish communities Disruptions in food web and energy flow Degraded habitats especially nearshore, wetlands and tributaries Beach closures and contamination Property values declining


6 Status of Tributaries Large rivers contributing majority of TP Smaller rivers may be impacting localized nearshore areas, especially after significant storm events SRP appears to be increasing disproportionably to TP in tributaries Agriculturally dominated watersheds appear to be highest contributors Trenton Channel- high TP


7 The Nutrient Management Strategy identifies binational: Goals Objectives Indicators & Targets Principles Status of Nutrients & Management Actions Mitigation Priorities including watersheds Monitoring Priorities Research Priorities Reporting requirements

8 Why Focus on Phosphorus? Phosphorus is the nutrient that limits algal growth Widely collected, in all habitat types Total phosphorus is easier to measure than its component fractions Need to develop reliable methods for collecting soluble reactive phosphorus information. Nitrogen and other nutrients will continue to be monitored.


9 Strategy Goals Lake Erie LaMP Nutrient inputs from both point and non-point sources are managed to ensure that ambient concentrations are within bounds of sustainable watershed management and consistent with the Lake Erie Vision. GLWQA A substantial reduction in the present levels of algal biomass to levels below a nuisance condition including bays and other areas where nuisance algal blooms may occur (GLWQA Annex 3-1).

10 Strategy Objectives Stop further degradation. Conserve and protect waters that meet nutrient targets Restore waters that don t meet nutrient targets Monitor and report on status of nutrients against targets and progress of domestic actions WB Sept 2009

11 Strategy Principles Adaptive management Precautionary principle Government Responsibility Shared Responsibility Accountability Pollution Prevention Integration and Cooperation
12 Total Phosphorus Indicator Targets Habitat Type TP Target (ug/l) Offshore West Basin Central Basin East Basin Nearshore 20 Tributaries 32 Coastal Wetlands one recording of <30 µg/l / year
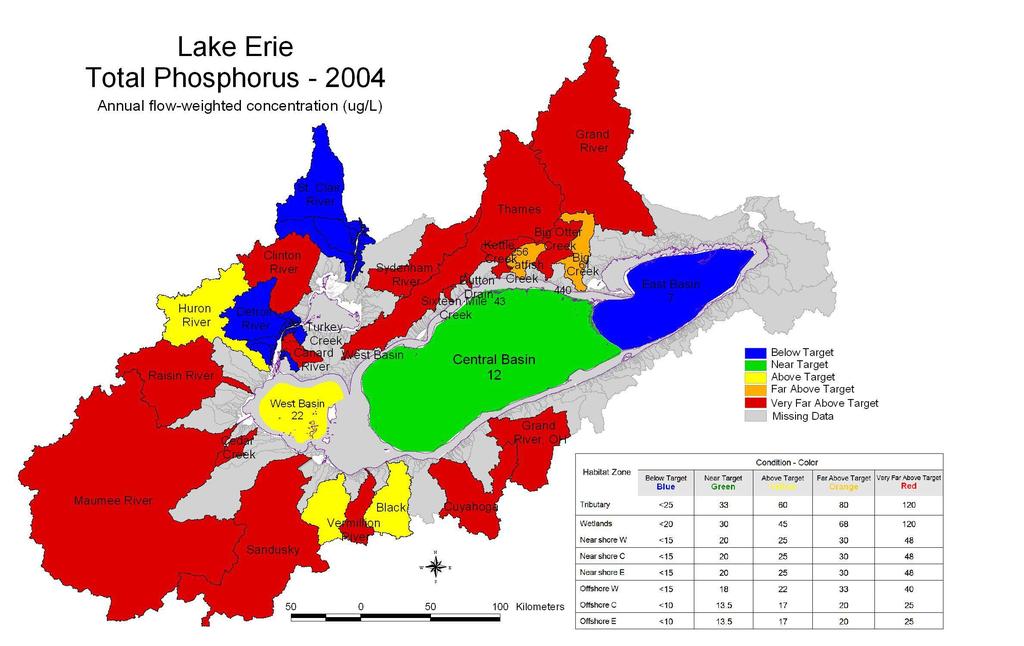
13

14 Status of Management Actions Current nutrient management actions and programs are not achieving the nutrient levels required to achieve the Lake Erie LaMP Vision. We need to optimize existing Programs If optimization of existing programs cannot achieve LaMP nutrient targets, then new programs should be considered Improved action is needed urgently! Baker et al
 Restore")
 Evaluate effectiveness")
15 Nutrient Mitigation Priorities Reduce Non-point source inputs substantially Selective reductions in point sources (municipal & industrial) Restore functional landscapes and hydrological processes Improve habitat amount, complexity, linkages Understand emerging issues (science) Evaluate effectiveness of actions (monitor)

16 Ecosystem processes Relative importance of various forms of P Impact of human activities Prediction of outcomes Effectiveness of existing beneficial management practices and technologies Role of climate change Communicate science Research Priorities


17 Monitoring Priorities Determine and report on progress Identify relationships between human uses and ecosystem response Minimize potential harm to the ecosystem Assist in setting research and monitoring priorities Evaluate the success of implementation activities

18 Ecosystem Status & Response Reporting Reporting will be integrated into the 5-year reporting cycle required by the LaMP. Will use the monitoring and research data acquired over the five-year cycle and compare results against agreed to targets and indicators. Reports will be short, map-based, and visual using GIS technology. In the absence of an indicator, results will be compared against previously collected data and identify where trends exist.


19 Next Steps. Develop marketing and communications products and conduct outreach and education LaMP Binational Work Plans Domestic Work Plans Continue Science and Monitoring


20 In conclusion It s complicated Science essential Stay focused and prioritize External vigilance required