Sustaining Our Water Resources Public Health. April 27, 2011
|
|
|
- Debra Conley
- 5 years ago
- Views:
Transcription


1 Sustaining the the Bay Bay Environmental Environmental Health Health Sustaining Our Water Resources Public Health Sustaining i i Our Our County Economic i Health Health lh IMPLEMENTATION: 2011 and Beyond April 27, 2011 The Maryland National Capital Park and Planning Commission Prince George s County Planning Department
2 AGENDA 1. Introduction Water Resources Element 2. Chesapeake Bay TMDL and Water Quality 3. Implications for Planners Case Study Hypothetical Watershed 4. Questions and Discussion
3 WATER RESOURCES FUNCTIONAL MASTER PLAN Introduction & Objectives
4 NON-POINT SOURCE (NPS) NUTRIENT LOAD MODELING


5 Water Resources Element Non-Point Source Modeling NPS Modeling Goals 1. To evaluate impacts of development patterns on receiving water quality 2. To evaluate impacts of land management practices (BMPs) on receiving water quality 3. To assist in policy development Photo courtesy of NOAA

 based on Land")

 added to terrestrial loads Photo")
6 Water Resources Element Non-Point Source Modeling NPS Modeling Approach Countywide (coarse) scale model Nutrient load estimates (TN Nitrogen & TP Phosphorus) based on Land use categories (MDP 2007) MDE s land use specific loading rates Impervious area % (IA %) WWTP (TN & TP) and septic system loads (TN) added to terrestrial loads Photo courtesy of NOAA
7 Water Resources Element Non-Point Source Modeling Annual lcountywide Nutrient tloads 2,403,633 lbs Nitrogen, 202,136 lbs Phosphorus (Total Lbs/Yr) Developed Land = 158,537 Acres (Urban/Suburban Stormwater) Low, Med, High Residential, Rural Residential, Commercial/Institutional, Road, Industrial Resource Land = 150,817 Acres Forest, Brush, Wetlands, Agriculture, Open Water Land Cover (Phosphorus not shown) Septic Systems = 24,000 Systems* serving population of 62,000 ** Residential + commercial/industrial equivalents WWTP Point Sources = 6 WWTPs* serving population of 809,000 *Significant WWTPs only, *Significant WWTPs only, ** Residential + commercial/industrial equivalents
 Low, Med, High Residential, Rural Residential, Commercial/Institutional,")

8 Water Resources Element Non-Point Source Modeling Terrestrial Loads per Acre (Total Nitrogen Lbs/Yr) Developed Land = 158,537 Acres (Urban/Suburban Stormwater) Low, Med, High Residential, Rural Residential, Commercial/Institutional, Road, Industrial 7.85 Lbs/Acre Resource Land = 150,817 Acres Forest, Brush, Wetlands, Agriculture, Open Water Land Cover (Phosphorus not shown) 3.77 Lbs/Acre *Significant WWTPs only, ** Residential + commercial/industrial equivalents


 *Significant")
9 Water Resources Element Non-Point Source Modeling Wastewater Loads per Person (Total Nitrogen Lbs/Yr) Septic Systems = 17,000 Residential Systems* 3.8 Lbs/Person > 6x WWTP Load 44,000 residents WWTP Point Sources = 6 WWTPs* serving population of 809, Lbs/Person (Phosphorus not shown) *Significant WWTPs only, *Significant WWTPs only, ** Residential + commercial/industrial equivalents
10 Water Resources Element Non-Point Source Modeling Terrestrial and Wastewater Loads per Person (Total Nitrogen Lbs/Yr) Terrestrial Wastewater Urban/Suburban Runoff 1.5 Lbs/Person Excluding large lot residential Rural Runoff 13.7 Lbs/Person Including large lot residential Septic Systems 3.8 Lbs/Person 44,000 residents (Phosphorus not shown) (Phosphorus not shown) WWTP TN Loads = 0.5 Lbs/Person 809,000 sewered population *Significant WWTPs only, ** Residential + commercial/industrial equivalents
11 Water Resources Element Non-Point Source Modeling Total Loads per Person (Total Nitrogen Lbs/Yr) Prince George s County Annual TN per Person Developed = 2.0 lbs Rural = 17.5 lbs Average = 2.8 lbs Based on 2007 Land Use and Round 7.1 Population Data (Phosphorus not shown) *Significant WWTPs only, ** Residential + commercial/industrial equivalents

 WWTPs only, ** Residential + commercial/industrial")
12 Land Use and Water Quality HowDensity Affects Loads Low Density ½ acre lots, 38% IA High Density 16 DWU/ac, 53% IA Higher Density = Lower load/person Lowest loads/person achieved through high density development Fewer F roadway miles Fewer travel miles (TN from vehicles) More resource conservation Example based on prototypical land use patterns (Phosphorus *Significant not shown) WWTPs only, ** Residential + commercial/industrial equivalents


 Land Use")


13 Areas with higher % impervious cover typically generate higher nutrient loads (nitrogen & phosphorus) Land Use and Water Quality Implications for Planners But, higher density development achieves lower loads/person and preserves natural land covers Natural land covers such as forest, grasslandandbrush and act as buffers = lower nutrient loads to water
14 CHESAPEAKE BAY TMDL Total Daily Maximum Load


15 Why Do Loads Matter? Chesapeake Bay TMDL TMDL = Total Maximum Daily Load Definition: The total amount of a pollutant that can be released to a waterbody and still achieve designated uses and water quality standards. Implications: 1. Stormwater historically regulated through reporting on Best Management Practices 2. TMDL provides a regulatory context for quality of runoff in the form of pollutant limits 3. TMDL can limit activities, growth & development in impaired watersheds Development Controls


16 Chesapeake Bay Restoration 1970 s studies identified nutrients (nitrogen & phosphorus) as primary source of Bay degradation and loss of living resources Current overall Bay Health Index = C University of Maryland Center for Environmental Science


17 Nutrient & Sediment Loads from Multiple l Sectors Agriculture, Urban/ Suburban Runoff, Wastewater, Air & Natural Sources
18 Chesapeake Bay Restoration Progress to Date Agriculture Good progress - Federal & State cost-share Urban/Suburban SW Loads Increasing Wastewater Significant progress - BNR & ENR Upgrades Source: Chesapeake Bay Program
19 The 2010 TMDL and Implications for the Next Phase of Bay Restoration The TMDL Will Affect Land Management Decisions


 States")

20 The 2010 TMDL and Implications for the Next Phase of Bay Restoration TMDL finalized December 29, 2010 Load limits for Sediment, Nitrogen, Phosphorus Executive Order Bay Restoration Strategy requires each state to submit Watershed Implementation Plans (WIPs) States must achieve and demonstrate TMDL load reductions in order to protect growth & local l decision-making i


21 The 2010 TMDL and Implications for the Next Phase of Bay Restoration TMDL assumes new or increased loads will be offset by reductions from other sources Assumes zero load allocation to new or expanded discharges Will apply to new development, WWTPs, agriculture, air sources, etc Offset through reduction from other point or non-point sources Jurisdictions not meeting milestones will need net improvement offsets (e.g, 2:1 or more) Offset - a reduction in pollutant loading compensating for loading from a different point or NPS in a manner consistent with meeting WQS. ---TMDL, December 2010 Development Controls Source: Accounting For Future Loads: Balancing Growth and Water Quality, Jon Capacasa, Director Water Protection Division. Presentation to Principal Staff Committee April 29, 2010


 Septics Successful implementation")


22 Prince George s County s Phase II WIP Phase II WIP will require input from all sectors Planning/development o o o Agriculture Wastewater o o Zoning & Ordinances Urban SW (MS4) Construction WWTP (NPDES) Septics Successful implementation necessary to protect growth & local ldecision making i State Timeline: EPA Ph5.3 Model Draft Milestones Draft Phase II WIP Final Milestones Final Phase II WIP Jun30 Nov1 Dec 1 Jan3 Mar30

23 Prince George s County s Phase II WIP How Much Reduction Will be Required? Target loads not yet established, but MD s nitrogen target = 21% overall reduction 18% Stormwater runoff* 39% Septic systems 26% WWTP & CSO s 15% Resource Lands Current County TN Load = 2.4m lbs/yr 21 % Reduction = 1.9m lbs/yr Per Acre (308,355 acres) Rd Reduce from average to 619lb 6.19 lbs/ac Per Person (882,853) Reduce from 2.82 to 2.25 lbs/person But, TMDL requires offsets for growth 2030 Population = 992,871 (Round 7.1) 1,915,254 lbs/yr 992,871 = 1.93 lbs/person = 32% TN Reduction/Person * Developed land, in this case assumed to include regulated and non-regulated stormwater
24 Land Use and Water Quality Implications i for Planners The TMDL Will Affect Land Management Decisions CASE STUDY HYPOTHETICAL WATERSHED


25 Hypothetical ti Watershed 875 acres 30% developed, average 12% impervious 900 households with population p = 2, ac Low density residential 126 ac Medium density residential 2 ac Institutional 398 ac Forest 202 ac Brush 11 ac Large lot residential
26 Hypothetical Watershed - Current Land Use TN load from current land use = 2,700 lbs/year Wastewater TN = 3 lbs/person/yr = 7,500 lbs/yr < 10% septic systems > 90% WWTP, but not Bay treatment standards (ENR) 2,300 lb reduction needed to achieve MDE s TN goals 18% urban/suburban SW, 26% wastewater Sample Watershed TN Lbs/Yr Current Land Use Acres Total Load Reduction Goal Target Load Low density residential Medium density residential Institutional Forest Brush Large lot residential Total Area 875 2, ,400 Average WW TN lbs/person 3 7,500 1,950 5,550 TOTAL TN LOAD (lbs/yr) 10,200 2,300 7,900 18% SW Reduction 26% WW Reduction Target Load

 2,300 lb")

27 Hypothetical Watershed - Current Land Use TN load from current land use = 2,700 lbs/year Wastewater TN = 3 lbs/person/yr = 7,500 lbs/yr < 10% septic systems > 90% WWTP, but not Bay treatment standards (ENR) 2,300 lb reduction needed to achieve MDE s TN goals 18% urban/suburban SW, 26% wastewater Target Load 26% WW Reduction 18% SW Reduction 0% Reduction
28 Reductions from Stormwater Retrofit 274 acres developed prior to SW requirements assumed to have little or no stormwater management Pollutant loads and runoff can be reduced by retrofitting existing development with SW BMPs Target Load 18% SW 18% SW Reduction


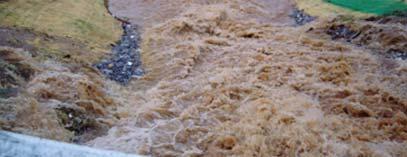
29 Reductions from Stormwater Retrofit Many communities developed without significant stormwater management Early practices were intended to protect communities from flooding designed to convey water from roads and structures as rapidly as possible High intensity runoff increases erosion and degrades downstream stream channels and water quality *Significant WWTPs only, ** Residential + commercial/industrial equivalents


30 Reductions from Stormwater Retrofit Many communities developed without significant stormwater management Early practices were intended to protect communities from flooding designed to convey water from roads and structures as rapidly as possible High intensity runoff increases erosion and degrades downstream stream channels and water quality Current SWM practices designed to capture small storms onsite & remove pollutants, then safely convey large storms Current standards place high value on resource conservation & disconnection of impervious surfaces from the conveyance system *Significant WWTPs only, ** Residential + commercial/industrial equivalents


31 Reductions from Stormwater Retrofit Retrofit Examples Effective for runoff reduction, less effective for nutrient & sediment reduction Cisterns, rain barrels Effective for runoff reduction and more effective for nutrient & sediment reduction Permeable pavers Impervious I i Rain gardens disconnection Infiltration Sheet flow to trenches buffers Grass Green roofs channels (expensive) Bio retention cells *Significant WWTPs only, ** Residential + commercial/industrial equivalents


32 Reductions from Stormwater Retrofit Larger Scale Stormwater Practices Variable effectiveness for runoff reduction & pollutant reduction Extended detention Ponds Highway swales, etc Effective for pollutant reduction Wet pond Stormwater wetland Sand d fl filters Redesign ponds Larger bioretention cells *Significant WWTPs only, ** Residential + commercial/industrial equivalents


33 Reductions from Stormwater Retrofit Runoff and pollutant reduction can be achieved through stormwater treatment train Control Hot Spots Reduce volume Onsite Treatment (LID) Streetscape & Urban Design Larger g Scale Practices Regional g Treatment Stream Restoration Riparian p Enhancements
34 Reductions from Stormwater Retrofit MDE may require retrofit of 20% impervious acres developed prior to 1985 (or more) Retrofit may achieve ~5% TN reduction = 100 lbs SW retrofit cost $18k/acre* (per MDE) = $400k = $200/lb TN reduced/year (hypothetical) Achieved 100 Lb Reduction *Based on MDE s assumed average TN efficiency=25%. Cost calculated at $18k per Imp acre. 274 acres* average 39% IA = 108 acres. Assumes costs annualized over 20 years

 Upgrade to WWTP with")


35 Reductions from Wastewater Upgrade 2,500 residents, Wastewater TN = 3 lbs/person/yr < 10% septic systems > 90% WWTP, but not Bay treatment standards (ENR) Upgrade to WWTP with Enhanced Nutrient Removal (ENR) can reduce loads by > 2 lbs/person Exceeded goal by 3,500 lbs 3,500 Lb Development Capacity { 26% WW Reduction Achieved 5,800 Lb Reduction *Cost calculated at $xxxxxx
36 Land Use and Water Quality Implications i for Planners Costs to comply with the TMDL will vary depending on the nutrient reduction strategy chosen Preferred options will vary for different communities depending on type of existing development (urban, suburban, rural) and future development plans The County will need to consider numerous options, including: Retrofit existing development WWTP upgrade, septic upgrades, septic retirement t (connect tto WWTP) Ecosystem services (stream or wetland restoration, riparian enhancements, conservation) Redevelopment Relative Cost Medium to High Medium Low


37 Future Development Assume populationwill double from 2,500 to 5,000 = 1,000 new households Wastewater TN = 0.65 lbs/person/yr (ENR) 600 acres of forest & brush available for development Forest and brush will be converted proportional to existing land cover 66% forest 34% brush Future Mean household size = 2.5 (versus current 2.74)
 All current & future households on upgraded WWTP (ENR) (0.")

38 Future Development Low Density 1,000 new households, ½ acre lots (RR) = 500 acres 83% of existing Resource/Natural Land converted (330 ac forest ac brush) All current & future households on upgraded WWTP (ENR) (0.65 lbs/person/yr) Change in TN Loads: Resource/Natural Land 600 lbs Development WWTP Net Change 4,400 lbs existing + 4,100 new = 8,500 lbs/yr + 3,100 lbs + 1,625 lbs + 4,100 lbs 600 Lbs to Offset 8,500 { { 3,500 0 Lb Lb Development Capacity
 = 65 acres 10% of existing")
 All current & future households on upgraded WWTP")
 Change in TN Loads: Resource/Natural")

39 Future Development High Density Residential 1,000 new households, 40 /acre (R P C) = 65 acres 10% of existing Resource/Natural Land converted (43 ac forest + 22 ac brush) All current & future households on upgraded WWTP (ENR) (0.65 lbs/person/yr) Change in TN Loads: Resource/Natural Land 75 lbs Development WWTP Net Change 4,400 lbs existing + 2,000 new = 6,400 lbs/yr lbs + 1,625 lbs + 2,000 lbs Zero Offset { 1,500 Lb Remaining Capacity (or Credits)


40 Considering Benefits other than Water Quality Ecosystem Services including Carbon Sequestration should be considered as part of the overall benefits of watershed dbased water quality improvements 149% Increase 137% Increase 12% less impact on Carbon footprint 83% reduction in 83% reduction in ecosystem services Only 10% reduction in ecosystem services
41 Conclusions Water Quality is affected by a range of planning policies /regulations and we have to consider cumulative impacts. There is no silver bullet and a comprehensive approach is needed. Zoning and Density Growth Pattern and Policy (Development Zones) Redevelopment / Infill Policy Green Infrastructure - Subdivision Staging Policy/Subdivision Regulations
42 Conclusions The Water Resources Functional Master Plan recommends a systems based management approach. This includes Development of modeling tools and measurable goals that can test policy and plans and predict potential impacts to water quality, cost implications and burdens. Water Quality strategies should be considered as a part of a comprehensive cost benefit evaluation.
43 Conclusions A balanced approach to regulation, incentives, shared cost burdens should be sought Pollutant load capacities / Water Quality Credit trading could be explored Retrofits (County costs) vs. New Development BMPs (Developer costs); Offset balance Zoning policy should explore more innovative conservation development options
44 CONTACT INFORMATION Karen Buxbaum Planner Coordinator Jane McDonough, AECOM Avi Srivastava, AECOM
45 Questions & Discussion