The Least Limiting Water Range and other indicators : the threat they represent for soil physics in Brazil
|
|
|
- Alice Brittney Garrett
- 5 years ago
- Views:
Transcription


1 The Least Limiting Water Range and other indicators : the threat they represent for soil physics in Brazil Quirijn de Jong van Lier CENA-USP qdjvlier@usp.br
2 My interpretation of some messages transmitted at this meeting Dennis Timlin: Soil physics is needed in crop growth modeling and much more information is needed Nelson da Costa: Advanced mathematics is an important tool Marcel Schaap: We should not forget about the uncertainty in our parameters, and learn how to deal with that Luiz Pires: Advanced techniques are available and being developed, also in Brazil Nunzio Romano: Field capacity: do we need it in soil physics? Round Table 1: The importance of data acquisition and spatial and temporal data management - aspects of scale and resolution. Jan Vanderborght: Root water uptake and plant transpiration can be modeled in 3D using soil physical and plant physiological parameters


3 SOIL PHYSICS Modeling and measurement of soil physical properties Predicting behavior of natural or managed ecosystems
 the capacity of a specific kind of soil to function, within natural or managed")


4 SOIL QUALITY (Warkentin and Fletcher, 1977) fitness for use (Larson and Pierce, 1991) the capacity of a specific kind of soil to function, within natural or managed ecosystem boundaries, to sustain plant and animal productivity, maintain or enhance water and air quality, and support human health and habitation (Karlen et al., 1997, Soil SSSA Ad Hoc Committee on Soil Quality) a measure of the condition of soil relative to the requirements of one or more biotic species and or to any human need or purpose
 50000 40000 30000 20000 10000 0 XXVII 0.002 0.003 0.004 0.005 0.006 0.")
5 Output parameter Soil physical knowledge should be linked to modeling Prediction of system behavior Concept Development Calibration Validation Sensitivity analysis MS (kg ha -1 ) XXVII RM S (kg kg -1 d -1 ) Input parameter
 XXVII 0 0.002 0.003 0.004 0.005 0.006 0.")
6 The sensitivity of a model output to an input parameter indicates the (im)possibility of excluding that parameter for prediction purposes! MS (kg ha -1 ) XXVII RM S (kg kg -1 d -1 )
7 Some common indicators of soil physical quality The quality of an indicator depends on its capability of representing those soil attributes to which the (state-of-the-art) model shows Bulk density Aggregate stability OM content sensitivity Available water the search for a single indicator for soil physical quality is, probably, an irrational effort mission impossible
8
9 Letey Adv. Soil Sci., 1985
10 Letey Adv. Soil Sci., 1985 The non-limiting water range (NLWR)

 in the")
11 The introduction of NLWR => LLWR in the Brazilian soil physics world by Álvaro da Silva (ESALQ/USP) in the 1990s

12 The Brazilian follow-up: hits on Google Scholar, 3960 since 2011 for Intervalo Hídrico Ótimo IHO = LLWR. NONE of these publications evaluated the adequacy of the LLWR to describe the soil quality
13 The definition os the LLWR as used since the 1990s in Brazil: LLWR max 0,min, max, fc air pwp pr fc air pwp pr h fc = -10 kpa air = s h pwp = kpa pr ~ 2 MPa

14 Water content and a very popular type of graph s = 1 r / r s fc air = s pwp pr Bulk density critical density
15 Is this the challenge? Is this SOIL PHYSICS? Is this Is this Modeling and measuring soil physical properties? Predicting system behavior? LLWR max 0, min fc, air max pwp, pr Water content s = 1 r / rs fc air = s pw p pr Bulk density critical density fc air pwp pr hfc = -10 kpa air = s hpwp = kpa pr ~ 2 MPa

16 saturation Thinking about the limiting water contents LLWR? 0 pr pwp crit fc air Drought stress 1 2 Anoxic stress Mechanical stress


17 Challenge #1 FIELD CAPACITY h fc = -10 kpa?? RBCS 12: , 1988
18 Challenge #1 FIELD CAPACITY h fc = -10 kpa?? Simulation of a drainage experiment: Pressure head versus depth at the instant corresponding to q bot = 1 mm d -1 for five soil depths
19 Challenge #1 FIELD CAPACITY h fc = -10 kpa??

20 Challenge #1 FIELD CAPACITY In non-layered soils:
21 Challenge #1 FIELD CAPACITY 330 q fc = 0.1 mm d -1 a = 1.5 m -1 h fc constant!


22 Challenge #2 PERMANENT WILTING POINT (or critical water content?) h pwp = kpa??
 K, mm d -1 loamy sand loamy clay M, cm 2 d -1 loamy sand loamy clay h, -cm h, -cm Matric Flux")
23 Challenge #2 PERMANENT WILTING POINT (or critical water content?) K, mm d -1 loamy sand loamy clay M, cm 2 d -1 loamy sand loamy clay h, -cm h, -cm Matric Flux Potential M M h h l K h dh M LC / M LS h, -cm
24 Challenge #3 LIMITING AIR-FILLED POROSITY air = s Wouldn t that depend on and and

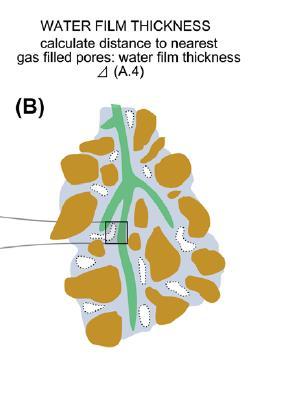
25 Challenge #3 LIMITING AIR-FILLED POROSITY

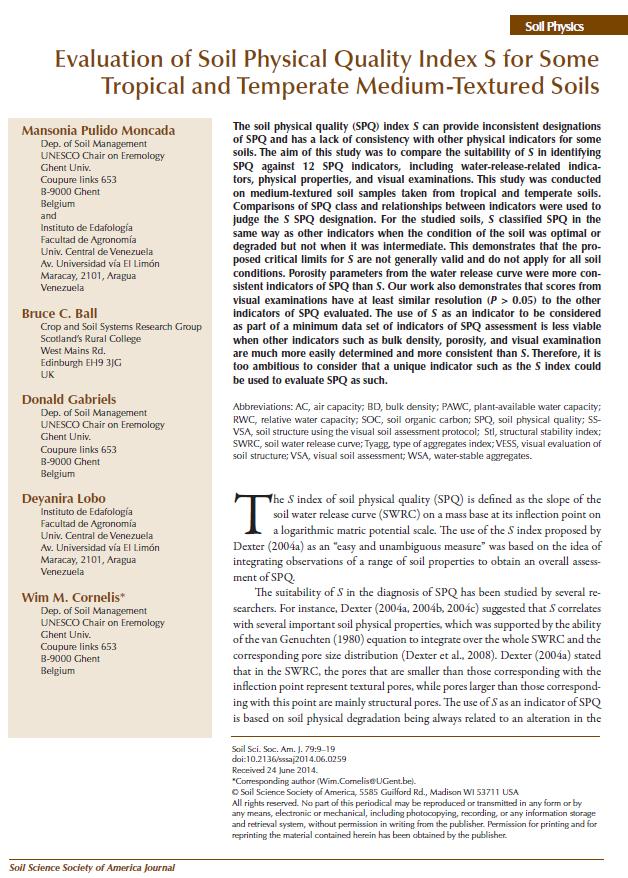
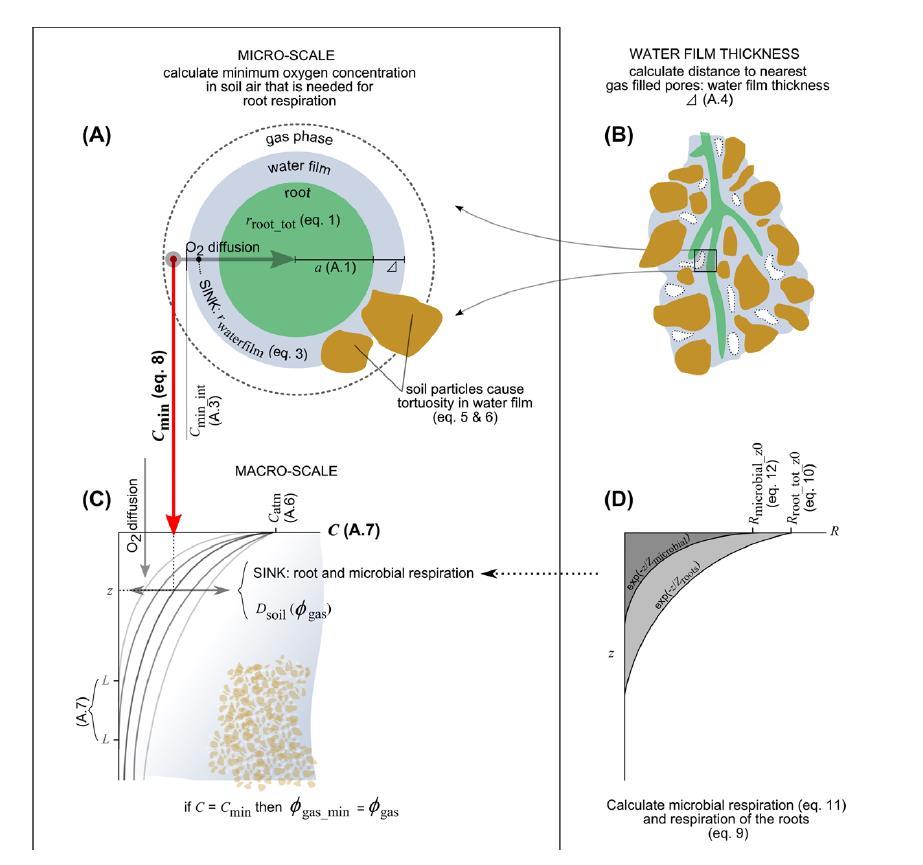
26 Challenge #3 LIMITING AIR-FILLED POROSITY min O O 2 S atm max Z 2 a 2 2 min D a p 2 4 p 3 10
27 Challenge #4 LIMITING PENETRATION RESISTANCE pr ~ 2 MPa Real value depends on crop type, health, DVS, Measuring instruments do not mimic root growth strategies Corresponds to dry conditions relevance?

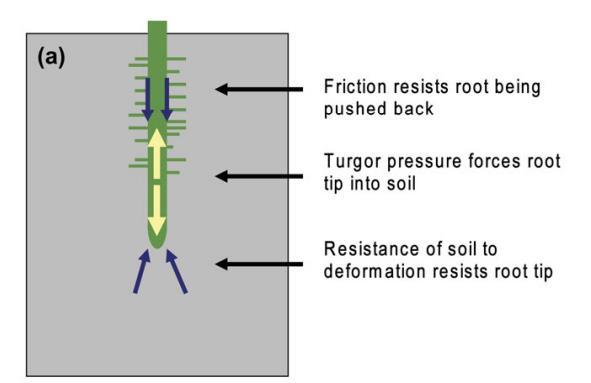
28 Challenge #4 LIMITING PENETRATION RESISTANCE
29 Water content s = 1 r / r s fc air = s pwp pr Soil density crítical density

30 Challenge #X How to handle the LLWR in layered soil profiles?

31 pr ~ 2 MPa h pwp = kpa air = s h fc = -10 kpa SOIL PHYSICS = Modeling and measuring soil physical properties Objective: predicting the behavior of natural or managed soil PHYSICS? ecosystems and you can never do that by measuring alone.


 is not the way towards increased soil physical understanding and should not guide our research")
32 So what can we conclude about the LLWR? It is a classical concept that comprises some of the most limiting soil attributes to crop growth; Its value cannot be assessed in a simple manner and depends on soil, crop and atmospheric conditions that vary over time; It is incapable of dealing with vertical heterogeneity in terms of soil and plant (rooting) properties; The LLWR (or any other indicator ) is not the way towards increased soil physical understanding and should not guide our research (although it will implicitly be in our minds while performing specific investigations).


33 BUT WHY do I consider the LLWR (together with other indicators ) a threat to soil physics in Brazil? Indicators, quality, S, LLWR SOIL PHYSICS


34 Thank you for your attention! d q bot =0.11 mm/d 27 d q bot =0.38 mm/d 9 d q bot =1.3 mm/d 3 d q bot =4.3 mm/d 1 d q bot =13.4 mm/d 0.60 m hydraulic conductivity, mm d -1 0 d depth, m m 10 Bottom flow, mm d -1 1 q bot interval for t = 11 d 0.1 t interval for q bot = 1 mm d Time of redistribution, d