NEW Atmospheric Science
|
|
|
- Joseph Waters
- 5 years ago
- Views:
Transcription
1 NEW Atmospheric Science Jeffrey R. Brook Environment and Climate Change Canada University of Toronto British Columbia Lung Association 2018 Air Quality and Health Workshop The Future of Air Quality Management for Improved Public Health Vancouver - Feb. 5, 2018

2 Topics Recent advances in atmospheric science that may influence how air quality is managed Improving models and emissions data Higher resolution faster computers Protecting people through forecasting (e.g., forest fires) Independent verification Characterizing air quality Multi-scale data fusion Areas and/or populations of greater risk Mixtures Targeting specific types of particulate matter Oxidative potential Page 2 22 février 2018
3 General Air Pollutant Life Cycle Page 3 22 février 2018
4 Area Affected by Wildfire Smoke Average seasonal percentage of fire-pm 2.5 contribution to average seasonal PM 2.5 FireWork concentrations Page 4 22 février 2018

5 Area Affected by Wildfire Smoke Average seasonal percentage of fire-pm 2.5 contribution to average seasonal PM 2.5 FireWork concentrations Page 5 22 février 2018


6 Area Affected by Wildfire Smoke Average seasonal percentage of fire-pm 2.5 contribution to average seasonal PM 2.5 FireWork concentrations JULY AUGUST SEPTEMBER Page 6 22 février 2018


7 Observed and Forecasted PM 2.5 Concentrations EDMONTON Improved forecasts with FireWork Aug 6 th Aug 12 th FireWork was able to forecast the area affected by smoke. However, the forecasted meteorology brought pollution close to the surface level which wasn't observed. Pollution remained on upper levels while still affecting inhabitants. Page 7 22 février 2018 VANCOUVER
 Updated emission factors (PM, NOx, NMHC, NH 3, CO) Plume injection height based on fire energy thermodynamics Energy Balance Q plume F incomplete combustion Q fire")
 Beta tests for southern Ontario (BAQS-Met; PanAm Games) Run routinely since 2013 for western Canada (oil sands) Considered for routine forecasting in 2022 Q surface")
8 Upcoming advances in modelling Mechanistic Forest Fire Emissions Fire spread and growth using hourly forecasted meteorology Fire characteristics (flaming, smoldering, residual) Updated emission factors (PM, NOx, NMHC, NH 3, CO) Plume injection height based on fire energy thermodynamics Energy Balance Q plume F incomplete combustion Q fire dq/dt black body radiation Q evaporation Q radiation Q fuel heating Higher spatial resolution (2.5km) Beta tests for southern Ontario (BAQS-Met; PanAm Games) Run routinely since 2013 for western Canada (oil sands) Considered for routine forecasting in 2022 Q surface heating Ongoing improvements in understanding, such as organic aerosols Page 8 22 février 2018

9 Emissions inventories and datasets Garbage in garbage out Accurate baseline for setting targets VOCs from 4 different oil sands operations VOCs very challenging Reported << Measured Page 9 22 février 2018 Li et al., PNAS, 2017

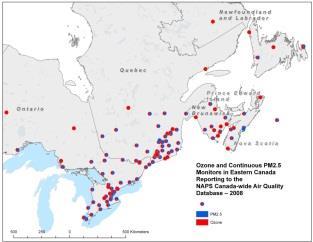
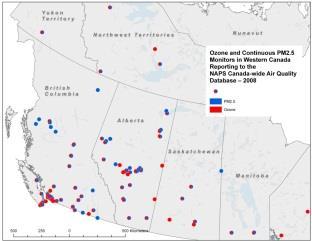
10 Chemical Transport Model (CTM) + Monitoring Average PM 2.5 Summer 2012 Page février 2018 Robichaud and Menard, ACP, 2014


11 CTM + Monitoring : Helps highlight local/region features Interpolated Observations Objective Analysis of Obs. and Model Able to see true, physically meaningful patterns Page février 2018

12 Satellite + CTM + Monitoring A huge benefit to exposure assignment in epidemiological research Page février 2018 MAPLE project
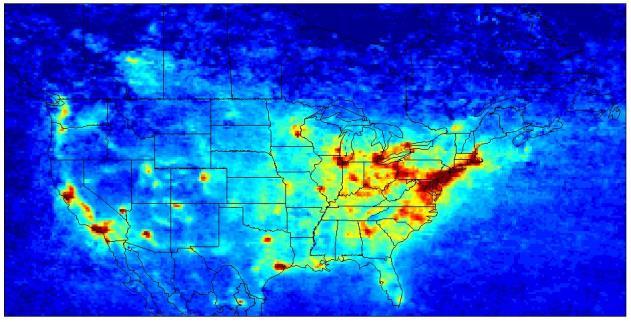
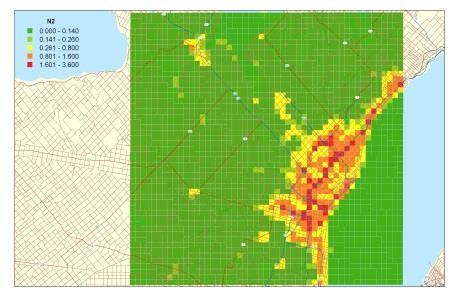
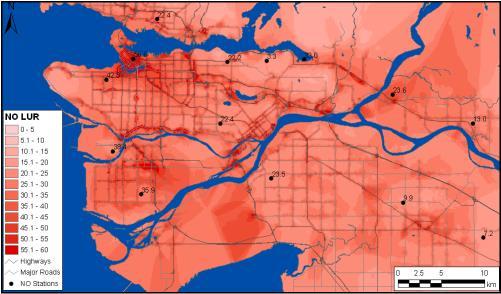
13 Satellite observations Air Quality Model Measurement networks Hi-Res Emissions LUR models Page février 2018


14 Highway MOE Offices Near Road Expressway Station: Highway Resources Road MOE Offices. 125 Resources Rd. Page février 2018 NAPS 60430: 167 m : 401 NR Station <10 m
15 Vancouver Sites 5 Page février 2018
16 Vancouver Toronto NO and NO2 Near Road Site Comparisons Page février 2018
17 BC (mg/m 3 ) Vancouver 4.0 Toronto Black Carbon Near Road 3.5 Site Comparisons Near road Local 0.5 bkgrd NR-TOR-1 Weekday NR-VAN Weekday 0.0 NR-TOR-1 Weekend NR-VAN Weekend Clark (Vancouver) 401 (Toronto) NR-TOR-1 Weekday NR-TOR- NR-VAN Weekday NR-TOR-1 Weekday NR-TOR-1 Weekend NR-VAN Weekday NR-VAN Weekend NR-VAN Page février 2018


18 Vancouver Sites 8 Page février 2018

19 Comparison of ozone is one example of how the mixtures can be different Page février 2018
")


20 Traffic Air Pollutant (TRAP) Mixtures On-road plume-based emission factors NO 2 Black Carbon Ultrafine particles Benzene Isocyanic acid Hydrogen Cyanide Page février 2018 Wren et al., in prep.
 VOCs such as benzene, toluene, xylenes (PTR-TOF-MS) NO (TECO), CO, CO 2, CH 4 (Picarro-CRD), O 3 (2B) PM 2.")
21 Tremendous advances in measurement capability High time resolution mobile measurements (1 5 second data) Measurements NO 2 (LGR-CRD) Black Carbon (HS-LII) CRUISER Toxics (HR-CIMS) Ultrafine particle counts (CPC) VOCs such as benzene, toluene, xylenes (PTR-TOF-MS) NO (TECO), CO, CO 2, CH 4 (Picarro-CRD), O 3 (2B) PM 2.5 (SHARP), optical particle counts (UHSAS) Meteorology and turbulence, GPS Page février 2018
22 Mobile labs bring much detail Can be purpose-equipped Resolve the spatial pattern in the urban background concentrations Within and between neighborhood/grid variations Isolate local hotspots, survey unmonitored areas local hot spots (traffic, industrial, burning, etc.) Contribution from the urban area Contribution from surrounding region Long-range transport Page février 2018


23 Benzene (ppb) Intermodal Freight Hubs Lake Ontario Toronto and region covered by CRUISER W E th Percentile 50th Percentile Mean 5th Percentile Air pollution coming in A local hotspot Page février 2018 Joe et al., Bul Am. Met Soc., 2018

24 Industrial Hot Spots Page février 2018
25 Are there differences in toxicity? Collect bulk samples and test on cells Page février 2018 Thomson et al., Part Fibre Toxicol 13:65 (2016)
26 Oxidative Potential: A fast, easy, health-relevant assay Able to generate much more data than traditional in vitro toxicology Janssen et al. Sci Tot Env Kramer et al., Atmos Env 2016 Page février 2018
27 Oxidative potential (OP) explains emergency room visits better than PM 2.5 Atlanta asthma/wheezing congestive heart failure Page février 2018 Bates et al., ES&T, 2015

28 Oxidative potential (OP) explains emergency room visits better than PM 2.5 Page février 2018
29 Policy Implications a quick overview Models are better than ever and this brings increasing opportunities for AQ managers to learn about their airsheds and evaluate policy scenarios There is a need for increased independent evaluation of emissions in some sectors An approach to public/decision-maker communication regarding exposure hotspots - where, what and how elevated can they be vs. the local background? While research tends to support the hypothesis that not all PM mass poses the same health risk scientific consensus is still lacking on how to prioritize policies. Page février 2018

; Thompson (HC) THANK")
30 Acknowledgements S. Wren, D. Herod, D. Johnson, J. Chen, E. (ECCC); Thompson (HC) THANK YOU Page février 2018