Technical Memorandum. Prepared for: Mid-Ohio Regional Planning Commission Project Title: Sustaining Scioto Project No.:
|
|
|
- Virginia Greer
- 5 years ago
- Views:
Transcription
1 1400 Lakehurst Court Suite 100 Dublin, Ohio Technical Memorandum Prepared for: Mid-Ohio Regional Planning Commission Project Title: Sustaining Scioto Project No.: Technical Memorandum No. 1 Subject: Upper Scioto River Watershed, Water Use Projections Date: January 10, 2013 To: David Rutter, Project Manager, Mid-Ohio Regional Planning Commission From: Kristin Knight, PE, Deputy Project Manager, Brown and Caldwell Limitations: This document was prepared solely for the Mid-Ohio Regional Planning Commission in accordance with professional standards at the time the services were performed and in accordance with the contract between the Mid-Ohio Regional Planning Commission and Brown and Caldwell dated May 1, This document is governed by the specific scope of work authorized by the Mid-Ohio Regional Planning Commission; it is not intended to be relied upon by any other party except for regulatory authorities contemplated by the scope of work. We have relied on information or instructions provided by the Mid-Ohio Regional Planning Commission and other parties and, unless otherwise expressly indicated, have made no independent investigation as to the validity, completeness, or accuracy of such information.
2 Table of Contents Executive Summary... ES-1 Section 1: Project Background Project Location Purpose of Water Use Projections Section 2: Scioto River Withdrawal and Discharges Water Withdrawals Water Discharges Section 3: Population Projections Population Data Utility Service Areas City of Columbus Service Area and Population Del-Co Water Company Service Area and Population Delaware County Regional Sewer District Marion County Regional Sewer District Fairfield County - Tussing Road WWTP Service Area Population Projections Section 4: Demand Projections Projected Water Withdrawals Projected Water Discharges References... R-1 Attachment A... A-1 ii
3 Executive Summary The Mid-Ohio Regional Planning Commission together with partners the City of Columbus Department of Public Utilities, Del-Co Water Company, Inc., the U.S. Geological Survey (USGS) and the Ohio Water Development Authority have initiated a study to model the effects of climate change on water supply in the Upper Scioto River Basin. The primary objective for this project is the development of an adaptive management plan for the region to ensure a resilient water supply system well in to the future. This project, named Sustaining Scioto, is a two-phased project. The first phase of the project involves the development of a computer model for the prediction of the impacts of projected climatologic conditions on the water resources of the Upper Scioto River basin through the year 2090, also referred to as build-out. The USGS developed the watershed model. For future conditions, the USGS will run the model with projected future water demands, build-out land use and a range of climate (rainfall and temperature) projections. The second phase of the project involves development of future water use projections, evaluation of the water budget and evaluation of the vulnerability of water supply sources and infrastructure based on the USGS model results. Finally, using the results of the model and the water inventory, the project team, along with a Stakeholder Advisory Committee, will develop an adaptive management plan for the region that will provide utilities, developers, agriculture and industry in the region with an understanding of the risks imposed by climate change. This plan will also serve as a guide for future investment and planning for water resource management. The focus of this memorandum is the development of water demand projections within the Upper Scioto River watershed. These demand projections were developed using Mid-Ohio Regional Planning Commission population data to estimate population within the region in the year 2035 and at Build-out, where the region has reached full development based on the land planning documents developed by the municipalities, counties and townships within the watershed. These population projections are then translated to water demands for each of the surface water treatment facilities and wastewater treatment facilities based on the historical treatment rates for each facility. These projected water demands will be used in the USGS watershed model to represent future surface water withdrawals and discharges within the Upper Scioto River watershed. The projected surface water withdrawals are shown in Table ES-1 and the surface water discharges are shown in Table ES-2 below. ES-1
4 Table ES-1 Projected Surface Water Withdrawals at 2035 and Build-Out Utility Avg. Day Demand Population 2010 Total Water Usage (gpcd) Percent Total Water Supply from Groundwater Population 2035 Avg Day Demand 2035 Surface Water Population at Build-Out Avg Day Demand at Build-Out Surface Water City of Columbus - Service Area (1) ,125, ,296, ,553, City of Westerville , , , City of Delaware , , , Del-Co Ralph E. Scott , , , Olentangy , , , City of Marysville , , , Ohio Aqua - Marion , , , City of Galion , , , (1) gpcd value from Comprehensive Water Master Plan, 2012 Table ES-2 Projected Surface Water Discharges at 2035 and Build-Out Utility Average Design Flow per NPDES Current Average Daily Flow Rate Population/ Wastewater Population Service Flow (gpcd) 2035 Area 2010 Avg Daily Flow Rate 2035 Population at Build-Out Avg Daily Flow Rate Build-Out City of Columbus Southerly Jackson Pike ,625, ,050, ,420, City of Delaware - Upper Olentangy , , , City of Marysville , , , City of Marion , , , City of Galion , , , City of Kenton , , , City of Canal Winchester , , , City of Pickerington , , , Delaware County Regional Sewer Dist. Alum Creek WRF , , , Olentangy Environmental Control , , , Marion County Regional Sewer Dist. SD No , , Fairfield County - Tussing Road WWTP , , , ES-2 DRAFT for review purposes only. Use of contents on this sheet is subject to the limitations specified at the beginning of this document.
5 Section 1: Project Background The Mid-Ohio Regional Planning Commission together with partners the City of Columbus Department of Public Utilities, Del-Co Water Company, Inc., the U.S. Geological Survey (USGS) and the Ohio Water Development Authority have initiated a study to model the effects of climate change on water supply in the Upper Scioto River Basin. The primary objective for this project is the development of an adaptive management plan for the region, a plan that will ensure a resilient water supply system well in to the future. This project, named Sustaining Scioto, is a two-phased project. The first phase of the project involves the development of a computer model for the prediction of the impacts of projected climatologic conditions on the water resources of the basin through the year 2090, also referred to as build-out. The USGS developed the watershed model and has calibrated and validated the results using historical gaging station data. Model outputs reflect the flow volumes in the Scioto River, with a range of scenarios reflecting projected changes to climatological conditions. Model input for historical conditions included input of existing withdrawals and discharges to the Scioto from public utilities, agriculture and industry. For future conditions, the USGS will run the model with projected future water demands, build-out land use and a range of climate (rainfall and temperature) projections. The second phase of the project involves development of future water use projections, evaluation of the water budget and evaluation of the vulnerability of water supply sources and infrastructure based on the USGS model results. One of the first tasks involves evaluation of the future development within the region and the associated water demand projections based on population growth, commercial and industrial development. A water budget for the region will be prepared based on these demands that will assess the current water system inputs and outputs currently and into the future to determine potential system risks and provide the framework for future planning. Finally, using the results of the model and the water inventory, the project team, along with a Stakeholder Advisory Committee, will develop an adaptive management plan for the region that will provide utilities, developers, agriculture and industry in the region with an understanding of the risks imposed by climate change. This plan will also serve as a guide for future investment and planning for water resource management. 1.1 Project Location Sustaining Scioto encompasses the Upper Scioto River watershed from its headwaters in northern Ohio to just north of Circleville, in the south. The project includes the counties of Franklin, Delaware, Pickaway, Union, Marion, Morrow, Madison, Champaign, Logan, Crawford and Hardin. Figure 1.1 shows a map of the project area. The project area includes the Scioto River, Big Walnut Creek and the Olentangy River as well Griggs, O Shaughnessy, Alum Creek and Hoover Reservoirs and Delaware Lake. 1-1

6 Figure 1-1 Sustaining Scioto Study Area 1-2
7 1.2 Purpose of Water Use Projections To understand the effects of climatological conditions on the Scioto River flow, it is necessary to quantify the amount of water withdrawn from and discharged back to the Scioto River. Water is withdrawn from the Scioto River for a variety of purposes including human consumption, agricultural uses, industrial processes and lawn irrigation. The amount of water necessary for municipal and industrial use that requires treatment can be estimated based on current treatment rates and population. As the population in an area increases and develops, the amount of water consumed in that area generally increases. Both water and wastewater rates can be estimated based on population projections and local per capita water usage. The build-out water demand and wastewater discharge rate is then projected using the existing per capita rate and the projected population at build out. These water and wastewater utility future demand projections along with known withdrawals and discharges from industrial and agricultural users in the watershed will be used by USGS in the watershed model to analyze future stream flow volumes in the Scioto River. 1-3
8 Section 2: Scioto River Withdrawal and Discharges The watershed model developed by the USGS analyzes runoff volumes in the Upper Scioto River watershed and the effects that a range of climate scenarios (projected rainfall and temperature) will have on stream flow volumes. The model uses land cover and precipitation data to model runoff volumes into the Scioto River and its tributaries. Major withdrawals and discharges to the river, identified as 1 million gallons per day or greater, were included in the model to assess the impacts of water use on the stream flow volumes. Both river withdrawals and discharges are regulated by government agencies in the State of Ohio. The USGS obtained a listing of all permitted water withdrawals and water discharges to the Scioto River Watershed within the study area. Figure 2-1 shows a map of the withdrawal and discharge locations within the watershed. 2.1 Water Withdrawals Any facility with a water withdrawal rate greater than 100,000 gallons per day must register the facility with the Ohio Department of Natural Resources (ODNR), Division of Water. Facilities that are registered must monitor and report the amount of water withdrawn for each month in the calendar year and submit those forms to ODNR on an annual basis. Both surface water and groundwater withdrawals are included in this requirement. It should be noted that surface water provides 85% of the water supply for this region. The USGS model is limited to the evaluation of the surface water system, including withdrawals and discharges from municipal and industrial treatment plants. Analysis of the impacts of climate change on groundwater levels was not included as part of this study. The types of facilities that report withdrawals from the Scioto River or one of its major tributaries include public water supply systems, industrial and commercial users, agricultural and landscaping users, managed wetland areas and golf courses. Some of these withdrawals are seasonal in nature while others, like most public water supply systems, occur continually year round. The USGS obtained records from ODNR for all of the registered surface water withdrawals within the study area. The public surface water withdrawals for water supply, included in the model, are listed below: City of Columbus: City of Galion Hap Cremean WTP City of Marysville Dublin Road WTP Aqua Ohio Marion Del-Co Water: City of Delaware Olentangy WTP City of Westerville Ralph E. Scott WTP 2-1
9 2.2 Water Discharges There are two sources of data for discharges into the Scioto River, the ODNR Water Withdrawal Facilities Registration Program and National Pollutant Discharge Permits (NPDES) from the Ohio Environmental Protection Agency (OEPA). Non-wastewater treatment plant discharges were obtained from ODNR Water Withdrawal Facilities Registration Program. Wastewater treatment plant (WWTP) effluents were only included in the model for facilities classified as Major under the NPDES permit system, which include all systems with an average design capacity greater than 1 MGD. The NPDES permit discharge data was used for all WWTP effluents. The wastewater treatment plant surface water discharges used in the model are listed below: City of Columbus: City of Canal Winchester Southerly WWTP City of Pickerington Jackson Pike WWTP City of Delaware - Upper Olentangy WRC Delaware County Regional Sewer District City of Marysville Alum Creek WRF City of Galion Olentangy Environmental Control Center City of Kenton Marion County Regional Sewer District SD No. 7 City of Marion Fairfield County Tussing Road WWTP 2-2
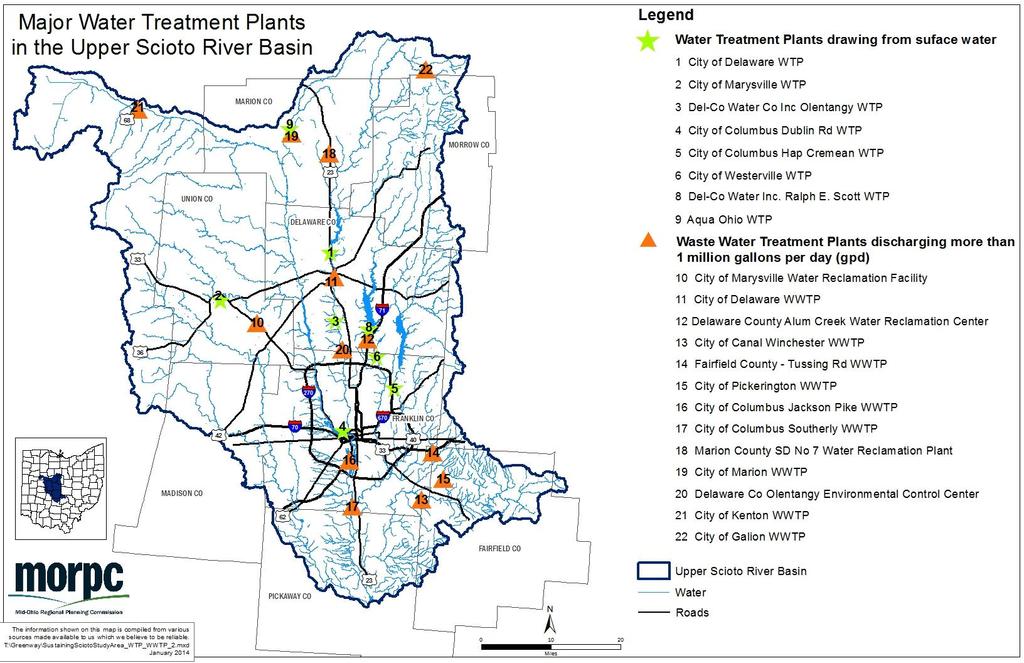
10 2-3
11 Section 3: Population Projections The water withdrawal rates from the Scioto River watershed are projected to increase with population growth. As the population in the region increases and industrial and commercial development continues, the public water supply utilities will need to supply more water to meet the needs of the region. Prolonged drought could also increase the demand for water from agricultural and landscaping based industries. The calibrated watershed model uses historic withdrawal and discharge rates to model current conditions within the watershed. The purpose of this demand projection task is to estimate the future population and development within the region. The population projections will be used to develop projected water demands based on the anticipated growth and to evaluate the availability of water in the river based on the increased demands and the climatological projections. These increased withdrawal volumes can be estimated based on current treatment rates and population projections for each utility. 3.1 Population Data The watershed model will analyze runoff and stream flow volumes for two future scenarios; 2035 and 2090, which is also referred to as build-out. To develop water demands for these scenarios it was necessary to estimate the population within the region at those time periods. The population data used for the growth projections in this study was based on population projections provided by the Mid-Ohio Regional Planning Commission (MORPC). MORPC utilizes census data and input from local government planning agencies to develop population projections and land use designations for the Central Ohio region. The most current population projections available from MORPC are based on the 2010 census and are available in GIS format in the form of 40 acre grids covering the Central Ohio area. The data for each of these grids includes population values for the years 2000, 2010, 2035 and build-out, current and projected future land use, current and future projected number of households and location data such as county, township and city. 3.2 Utility Service Areas Each utility with a withdrawal or discharge into the Scioto River has an associated service area. To determine the amount of water that must be supplied from or discharged to the river, the population within the service area must be defined. In many municipalities, the service area can be assumed to follow approximately the boundary of the city or village. However, in larger cities, private utility systems and regional utilities service areas may not be as clearly defined. GIS layers showing the city, county and township boundaries were used to identify the boundaries for the following utilities: Canal Winchester Delaware Galion Kenton Marion Marysville Pickerington Westerville The population for each of the above service areas was determined by summing the populations of each of the MORPC grid areas located within the service area boundaries. Future growth beyond the existing boundaries was accounted for based on MORPC land development mapping showing areas of anticipated growth in the region. 3-1
12 3.2.1 City of Columbus Service Area and Population The City of Columbus provides water and wastewater services to residents of the City proper as well as many of the suburban areas surrounding Columbus. Water Supply - The current service area for the City s water distribution system is detailed in the Comprehensive Water Master Plan, 2012 (CWMP), a master plan document developed for the water treatment system of the City of Columbus. The CWMP also analyzes future growth in and around the City and estimates the potential service area boundaries for 2015 and build-out conditions in The 2040 service boundary identified in the CWMP was used as the City of Columbus service area for the purpose of this study. The CWMP also included a detailed analysis of the service area population and growth projections based on MORPC population data. The MOPRC population data used for this analysis was based on the 2000 census data. In July, 2012 these population projections were updated to reflect data from the 2010 census. The results of the population projections update showed that growth in the City of Columbus service area was slower than predicted by the 2000 census based projections. There were many potential contributing factors to the slower than anticipated growth, including the economic downturn of Given the long planning period for this study and the continued growth within the City and the region, the original CWMP population projections were used for the service area population for the City s water treatment plants. Wastewater The future service area for the City s sewer collection system is detailed in Figure 3-10 of the CWMP and is included for reference in Attachment A to this document. The City of Columbus Wet Weather Management Plan, 2005 (WWMP) includes detailed population projections for the City s sewer service area. The initial projections for the WWMP were based on 2000 census data and updated in July, 2012 for the 2010 census numbers. The updated population projections for the facilities planning area were used in this analysis for the estimated future wastewater discharges Del-Co Water Company Service Area and Population Del-Co Water Company, Inc. is a private water utility that serves customers in Delaware, Franklin and Knox Counties. Because Del-Co serves primarily rural customers and customers in unincorporated areas, its service area does not follow municipal, township or county boundaries. The service areas for the two Del-Co surface water plants in the study area were determined based on GIS files provided by Del-Co delineating the service boundaries for each WTP. Growth beyond these boundaries was included for the build-out condition if significant growth was projected in areas adjacent to the existing utility service area based on MORPC land development maps. Because Del-Co is a private utility, customers within the utility service area connect to the utility on a voluntary basis. This means that not all of the population within the service area will be customers of Del-Co. In rural areas many homeowners maintain private wells to provide drinking water to their homes. This makes the task of estimating growth in water demand for the Del-Co utilities less straightforward. Del-Co is currently performing a master plan for the utility to project future growth within the service area, however the plan will not be completed in time for use in this study. To develop population projections for use in this study, the current total population in the service areas was compared to the number of current customers in each water treatment plant service area. The current percentage of customers to non-customers was applied to the total future population numbers, determined by using the MORPC GIS grid data, to determine an estimate for the future number of customers in each service area. 3-2
13 3.2.3 Delaware County Regional Sewer District The Delaware County Regional Sewer District (DRSD) operates two wastewater treatment facilities within the study area that discharge above the 1 MGD threshold considered in the model. DRSD provided service boundaries for each facility in GIS. Both facilities are located in the southern half of Delaware County, which is an area with a high probability for development and growth over the planning period of this study. The Delaware County Sewer Master Plan, 2004 analyzes the existing sewer service within the County and identifies areas of potential future sewer service need. The study uses population density as a parameter for extension of sewer services to new development. Population growth projections for each of the wastewater treatment facilities were based on the areas identified for future sewer service in the Delaware County Sewer Master Plan within the respective service areas of each facility Marion County Regional Sewer District The Marion County Regional Sewer District operates one wastewater treatment facility within the study area with a discharge rate above the 1 MGD threshold considered in the model. The service area for this facility is shown in the Marion County 2011 Land Use Plan, 2011 and is included for reference in Attachment A of this document. This service boundary was used in conjunction with the MORPC GIS grid data to determine the projected population for the facility service area Fairfield County Tussing Road WWTP Fairfield County operates one wastewater treatment facility within the study area with a discharge rate above the 1 MGD threshold considered in the model. The service area for this facility is shown in the Our Scioto River Basin Our Future, 208 Water Quality Management Plan Research for Ohio EPA report and is included for reference in Attachment A of this document. This service boundary was used in conjunction with the MORPC GIS grid data to determine the projected population for the facility service area. 3-3
14 3.3 Service Area Population Projections Based on the identified facility service areas and the MORPC population data, the projected populations for each of the facility service areas are shown in Table 3-1 below. Table 3-1 Utility Service Area Population Projections City/Utility Facility Type Population Build-Out City of Canal Winchester WW 5,057 7,431 12,220 28,005 City of Columbus - W 1,125,700 1,296,700 2,553,354 W/WW WW 1,480,000 1,625,000 2,050,000 3,420,000 City of Delaware W/WW 25,154 34,737 60,754 71,482 Del-Co Ralph E. Scott W - 35,416 68, ,938 Olentangy W - 60, , ,094 City of Galion (1)(2) W/WW 11,341 10,512 11,038 16,414 City of Kenton (1)(2) WW 8,336 8,262 8,675 24,320 City of Marion W/WW 35,318 37,144 42,554 74,650 City of Marysville W/WW 11,920 22,094 77, ,277 City of Pickerington WW 11,034 18,951 29,377 53,295 City of Westerville W 32,426 36,192 45,045 50,123 Marion County Regional Sewer Dist. - SD No. 7 WW - 4,761 6,003 13,169 Delaware County Regional Sewer Dist. Alum Creek WW 27,152 45,581 76,099 85,751 Olentangy Environmental Control WW 16,113 26,351 57,026 69,969 Fairfield County - Tussing Road WW 6,940 7,930 16,100 19,973 (1) Population data not included in MORPC GIS population data. Populations projected from 2000 and 2010 census data. (2) Municipalities with negative growth between 2000 and 2010 census were assigned a 0.2% growth rate for 2035 population projections. 3-4
15 Section 4: Demand Projections Once the population of an area has been determined, the demands placed upon water and wastewater treatment facilities that service those areas can be evaluated. It is common in utility planning to establish a planning level figure based on gallons of water treated per person per day, or gallons of water consumed per capita per day (gpcd). This value is based on the amount of water consumed or treated per day per customer in the facility service area. These gpcd values are unique for each utility and vary based on the regional and economic characteristics of the facility service area. These values can vary greatly between utilities, for example, a utility with a large number of industrial clients with high water usage would generally have a higher gpcd value than a suburban community with primarily residential occupancy. Gallon per capita per day can be calculated based solely on residential consumption, industrial and commercial demands or a combination of both. The values calculated for this study are based on total water system demands therefore industrial, commercial and residential demands are included. Water and wastewater facilities also use peak demand values to ensure that the treatment facility can treat flows outside of the average range. Water treatment plants use maximum day values to size tanks and equipment to meet the demands of a peak water usage event. Wastewater treatment facilities use peak flows to ensure that tanks and facility equipment can handle the excess flows experienced during wet weather events. The watershed modeling being performed for the Sustaining Scioto Study will analyze average river flows based on a range of scenarios representing longer term climate conditions, so peak demand or flow values are not appropriate for the scale of this project. Therefore, the demands developed for this task and used in the model are calculated for average day. Five of the eight utilities identified as having surface water withdrawals also withdraw groundwater as an additional water source. Total system water demand was calculated for these utilities based on the total recorded withdrawal of both surface water and groundwater sources to establish the gpcd for the system. The projected demands calculated for 2035 and 2090 were then adjusted to account for the percentage of groundwater used at each utility to identify the total demand for surface water sources. 4-1
16 4.1 Projected Water Withdrawals Utility Avg. Day Demand Population 2010 Total Water Usage (gpcd) Percent Total Water Supply from Groundwater Population 2035 Avg Day Demand 2035 Surface Water Population at Build-Out Avg Day Demand at Build-Out Surface Water City of Columbus - Service Area (1) ,125, ,296, ,553, City of Westerville , , , City of Delaware , , , Del-Co Ralph E. Scott , , , Olentangy , , , City of Marysville , , , Ohio Aqua - Marion , , , City of Galion , , , (1) gpcd value from Comprehensive Water Master Plan,
17 4.2 Projected Water Discharges Utility Average Design Flow per NPDES Current Average Daily Flow Rate Population/ Service Area 2010 Wastewater Flow (gpcd) Population 2035 Avg Daily Flow Rate 2035 Population at Build-Out Avg Daily Flow Rate Build-Out City of Columbus Southerly Jackson Pike ,625, ,050, ,420, City of Delaware - Upper Olentangy , , , City of Marysville , , , City of Marion , , , City of Galion , , , City of Kenton , , , City of Canal Winchester , , , City of Pickerington , , , Delaware County Regional Sewer Dist. Alum Creek WRF , , , Olentangy Environmental Control , , , Marion County Regional Sewer Dist. SD No , , Fairfield County - Tussing Road WWTP , , ,
18 References Reports Comprehensive Water Master Plan, City of Columbus, 2012 Comprehensive Water Master Plan Projected Water Demand Review, City of Columbus, August 2012 Wet Weather Management Plan, City of Columbus, 2005 WWMP Population Projections, City of Columbus, July 2012 Delaware County Sewer Master Plan, Regional Sewer District Facilities Plan Update, Delaware County Regional Sewer District, 2005 Marion County 2011 Land Use Plan, Marion County Regional Planning Commission, 2011 Our Scioto River Basin Our Future, 208 Water Quality Management Plan Research for Ohio EPA, Mid-Ohio Regional Planning Commission, 2012 R-1
19 Attachment A: A-1